Abstract
It has been accepted for many years that functionally important motions are crucial to binding properties of ligands in such molecules as hemoglobin and myoglobin. In enzymatic reactions, theory and now experiment, are beginning to confirm the importance of motions on a fast (ps) timescale in the chemical step of the catalytic process. What is missing is a clear physical picture of how slow conformational fluctuations are related to the fast motions that have been identified as crucial. This paper presents a theoretical analysis of this issue for human heart lactate dehydrogenase. We will examine how slow conformational motions bring the system to conformations that are distinguished as catalytically competent because they favor specific fast motions.
1 Introduction
How enzymes catalyze chemical reactions remains an area of intense debate. For many years, experiments that measure (or are interpreted as measuring) static quantities have confirmed that such abilities as charge stabilization are important to function,1 in agreement with some theoretical contributions.2 A newly emerging interpretation from experiment is that protein dynamics may be crucial to enzyme function.3 Such “functionally important motions” have been accepted for many years in binding proteins such as hemoglobin and myoglobin.4 In addition, statistical models including barriers modulated by such motions have been shown to be capable of recreating with good accuracy, and often few adjustable parameters, the chemical rates of enzymatically catalyzed reactions.
A protein exhibits motions in a large range of timescales.5 Conformational motions are of the order of ms, much slower than the transition state crossing, which can be viewed as happening in a frozen conformational landscape. In the present paper we will use the term “fast dynamics” to describe a particular type of motion we have studied in the last few years,6 that is coupled to the reaction coordinate and has timescales of a few hundreds fs. This fast dynamics involves rapid sub-ps motions, but they are slower than typical bond vibration motions that have period of a few fs. Several experimental groups have found such fast motions to be necessary to interpret both experimental and theoretical results.7 We have shown using transition path sampling methodologies8 that such fast dynamics is central to the reaction coordinate in the reactions catalyzed by human heart lactate dehydrogenase (LDH) and purine nucleoside phosphorylase (PNP).9
We have observed these fast motions and their necessary inclusion in the reaction coordinate, because this is the timescale on which we have observed the enzyme during reaction. Because these motions are on the same timescale as the barrier crossing event, on physical grounds, they may not be treated as a statistical bath. It is well known that slower protein motions are also involved in the function of an enzyme, and it is the goal of this paper to examine how these slow motions are related to fast motions (promoting vibrations) in a system in which such rapid motions have been identified as important.
Our Transition Path Sampling (TPS) analysis10,11 of the reactive ensemble of trajectories for the LDH reaction found that a compressional motion of residues along the donor-acceptor (D–A) axis is essential for the reaction. This compressional motion has a timescale of the order of 100–150 fs.12 However, this fast residue-compression motion happens in a catalytically competent conformation. The TPS analysis cannot tell us anything about slow conformational motions that brought the system to the conformation in which the fast residue-compression motion is effective; these conformational motions are the subject of this paper.
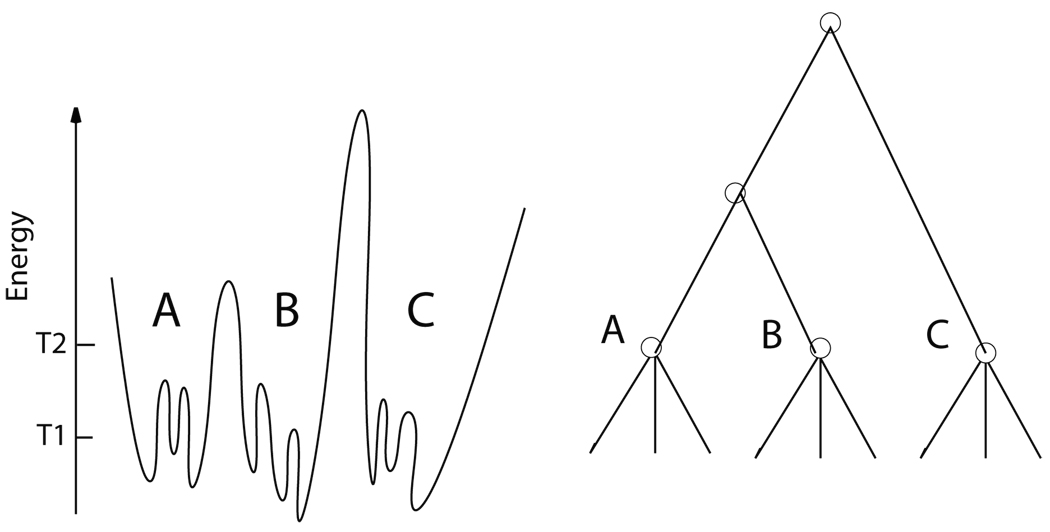
To better explain the kind of questions we want to address, it is useful to recall the topological connectivity picture of protein conformations13 which is summarized in Figure 1. The rapid residue-compression motions we identified with TPS in LDH are oscillations near the minimum of a conformation.
Figure 1.
The topological connectivity view of the energy landscape of a protein: at left is the energy landscape and at the right the disconnectivity graph.13 The nodes of the disconnectivity graph are determined by the energies T1, T2 which define energy wells at different scales. As an example, 3 basins (A, B, C) are shown. Conformations in the same “basin” (e.g. A) are separated by barriers of only a few kBT, so intraconversions between conformations of the same basin are frequent. Also, conformations in the same basin are geometrically similar. However, to have an interconversion between conformations belonging to different basins, the system has to overcome a high barrier, therefore these transitions are rare. Conformations belonging to different basins are not geometrically similar.
With this picture in mind, it is easier to explain the questions we will address.
Our TPS analysis of LDH showed that the reactive conformations have short donor-acceptor distance. How are such conformations distributed in the space of all conformations? Are they common or rare? Care must be taken to search for these reactive conformations in several basins of Figure 1.
What are the features of the free energy landscape that separates conformations with short D–A distance that belong to different basins? This will give us information about conformational motions that bring the system to catalytically competent conformations.
How does the chemical barrier for a conformation that has short D–A distance (that TPS found is catalytically competent) compare with the chemical barrier for a conformation that has long D–A distance?
In subsequent sections we will examine these 3 questions.
2 Classification of conformations
2.1 Methods
Model System
Lactate dehydrogenase (LDH) catalyzes the reversible reduction of pyruvate to lactate, utilizing NADH as a cofactor. Two major isozymes are expressed in humans with the H form mainly found in the heart, and M mainly in skeletal muscles and the liver. The H form is optimized to oxidize lactate to pyruvate, that is then utilized as fuel by the heart through aerobic metabolism. The M form operates more often to reduce lactate. Under anaerobic conditions, the reduction of pyruvate facilitates regeneration of NAD+ thereby enabling continued ATP synthesis via glycolysis.
We used the PDB entry 1I0Z for all simulations of the tetramer of human heart Lactate Dehydrogenase. 14 The PDB structure has oxamate, a substrate analog, bound in the active site of the enzyme. We built lactate starting from the coordinates of the bound substrate analog by replacing the N atom of oxamate with a C. Then the parameters for lactate were derived by analogy to the existing parameters in the standard CHARMM topology file of the CHARMM force field 22. No crystal waters were included in our work because all further simulations were carried out using the GBMV implicit solvent module. We carried out the energy minimization by repeating three times a two-step cycle: we held the heavy atoms with a harmonic restraining force of 100 kcal/mol/Å2 for the first cycle, 50 kcal/mol/Å2 for the second cycle and unrestrained for the third cycle; in each cycle this was followed by 500 steps of steepest descent followed by adopted Basis Newton-Raphson (ABNR) minimization with an average gradient tolerance of 0.00001.
Conformational Sampling
Our purpose was to search for a specific subset of conformations, those that have short donor-acceptor distances for both hydride and proton transfers. To accomplish this we augmented a known conformational search strategy with a biasing term that directed the search to the desired subset. We used Langevin Dynamics15 to carry out the conformation search and the bias was introduced by adding a harmonic restraining force16 on the donor-acceptor atom pairs. The following parameters were used in the Langevin Dynamics simulation. The collision frequency was 2.0 ps−1. Harmonic distance restraints were applied on the following atom pairs, each with a force constant of 50 kcal/mol/Å2. These reference values correspond to the transition state distances as determined by TPS:10,11 Valine31 CB–NAD+ NN1, 4.74 Å; His193 NE2–Lac O1, 2.78 Å; NAD+ NC4–Lac C2, 2.95 Å. Additional half-parabolic restraints with force constant of 10 kcal/mol/Å2 were imposed on: NAD+ AH–Ser151 C, with the half-parabolic constraint at 8 Å to keep the adenine ring in its docking site; Arg106 N–Lac O1 because it is known that this residue polarize the substrate.17
Simulation details
The system was subjected to 20 ps of heating at 300 K, while heavy atoms were held by a harmonic restraint with a force constant equal to 5.0 kcal/mol/Å2. Restraints on heavy atoms were turned off during the 1.137 ns production run. The harmonic restraints on the atom pairs mentioned earlier were turned on, to bias the search for conformations likely to be catalytically competent. Coordinates were saved every 0.75 ps beginning at 380 ps of the production run, when the system was stable. We calculated the sum of His 193 NE2–LAC O1 and NAD+ NC4–LAC C2 distances in all subunits and compared the result to the crystal structure. A snapshot was selected for further processing if at least one subunit was as tight as the crystal structure. The structures generated by Langevin Dynamics were transient conformations, so it was desirable to bring each selected structure to the nearest local minimum. This was done by simulated annealing. Once the kinetic energy is below a characteristic barrier height, a significant change cannot occur so it was not necessary to anneal all the way to 0 K.We cooled each structure down to 190 K and then removed the excess energy by ABNR minimization with average gradient tolerance of 0.0001 and step tolerance of 0.0001. The structures were unrestrained during annealing and minimization.
We took advantage of the fact that there is no cooperativity in the homotetramer of human heart LDH. In this case, each component of the tetramer is approximately an independent trajectory contributing to the conformational search. Only monomer transitions were probed during the pathway calculations and subsequent determination of the free energy diagram of the chemical event.
2.2 Results for conformational sampling
Our sampling strategy initially identified 254 seemingly stable subunit conformations, in which the donor-acceptor distance remained “short” (defined as shorter than the donor-acceptor distance in the minimized crystal structure), but after an unrestrained (in donor-acceptor distance) simulated annealing and minimization, this number dropped to 92 conformations.
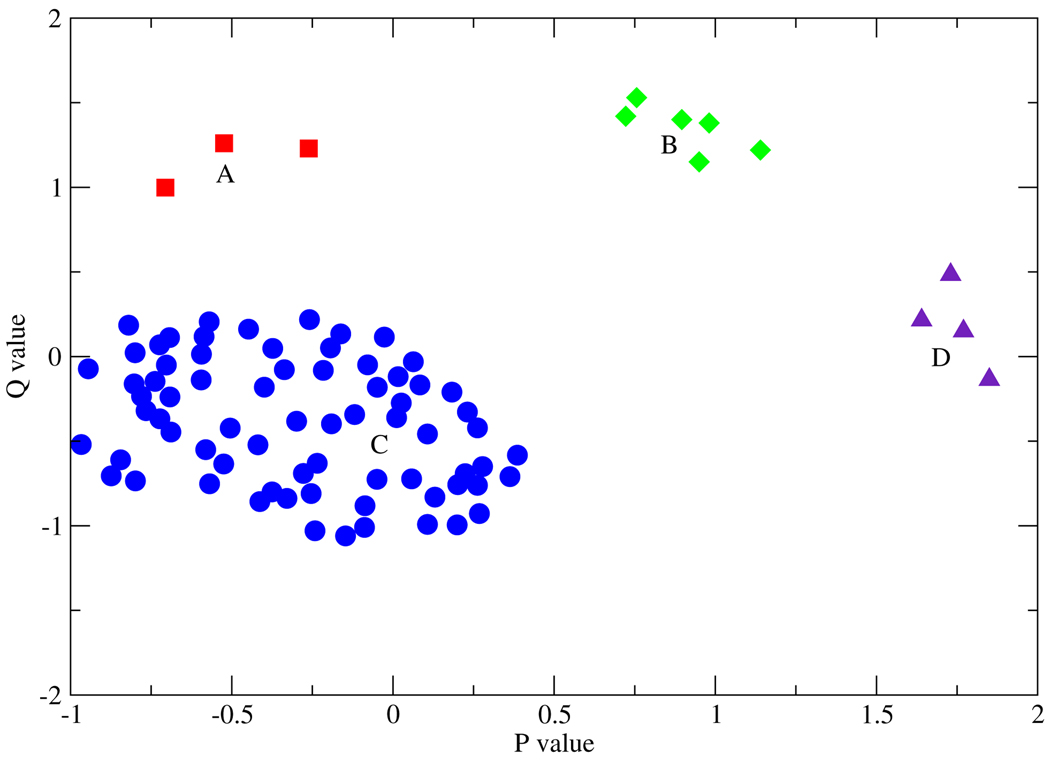
We subsequently analyzed these conformations as isolated monomers. Furthermore, the short N-terminal portion that does not interact with the rest of the monomer was deleted and not included in further analysis. The two unique monomers of the crystallographic asymmetric unit were included in this analysis, making the total number of conformations equal to 94. Geometrical similarity based on mass-weighted RMSD of residues 18 to 332 was used to cluster these “short D–A distance” structures. Pairwise mass-weighted RMSD between all 94 structures were calculated and the results were projected on a two-dimensional plane. Following Levitt18 the projection on a plane p,q was done as follows: the coordinates of each structure on the plane, (pi,qi), were treated as parameters for a least-squares fitting of the 2-dimensional distance dij = [(pi − pj)2 + (qi − qj)2]1/2 to the actual RMSD distance Dij, i.e. they are found by minimizing the residual Σij (Dij − dij)2.
Structures within 1 unit distance from the lowest energy structure were assigned to the first cluster. The lowest energy structure from the remaining points was used as the next pivot, but the neighbor search utilized all points. These steps were carried out iteratively until all structures were assigned to a cluster. The last step involved deleting elements that belong to more than one cluster. The results of the cluster analysis are shown in Figure 2: one can identify 4 distinct clusters of similar conformations.
Figure 2.
The clustered conformations found from cluster analysis after identification of stable low donor acceptor distance conformations. 94 distinct structures coalesce into the 4 clusters shown. The meaning of the p,q coordinates is explained in the text.
For efficiency, we only selected one representative from a subset of geometrically similar structures: 19 for each cluster, the snapshot with the lowest potential energy was used as representative of that cluster during the calculation of all possible pairwise interconversion pathways.
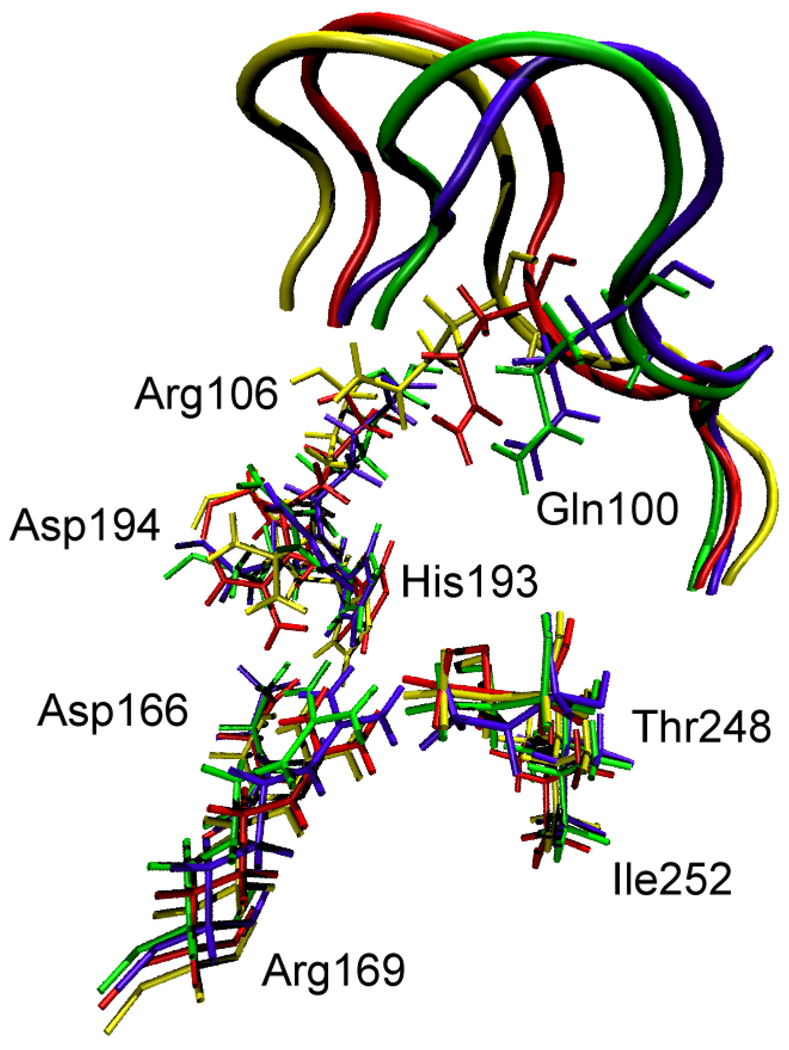
This clustering divided the conformational states, by definition, into two classes: states belonging to one of the clusters have short D-A distance, while states lying outside the clusters have long D-A distance. However, inspection of individual states showed that, in addition, most states outside the clusters had the active site loop (residues 96–106) open, while the loop was closed for the states inside the clusters. As can be seen in Figure 3 which shows the active state residues for the 4 representative cluster states, they have the active site loop closed but with slightly different displacements of the end of the loop that lies along the surface of the protein.
Figure 3.
Overlay of the active site residues of the 4 representative conformations of the clusters shown in Figure 2. Residues belonging to the same conformation are shown with the same color. At the top of the picture, the active site loop is shown (residues 96–106, its residues 100 and 106 are shown explicitly) The 4 residues at the bottom of the figure are related to each other by a simple translation. However, the important residues His193, Arg106, Gln100 and Asp194 are being pushed by the active site loop (which has a different closed position in each of the 4 conformations), and their geometric arrangement is different in a non-trivial way among the 4 conformations.
The 4 clusters were defined by their difference in the total RMSD. We found that most of the contribution to this RMSD difference comes from the active site loop (residues 96–106) and the antigen loop (residues 220–226). However, to be useful for an analysis of catalysis, these clusters should have, in addition to total RMSD, some microscopic differences in the active site geometry. We show a comparison of the active sites of the 4 cluster representatives in Figure 3. It can be seen that the slightly different closed positions of the active site loop push the catalytically important residues His193, Arg106, Gln100 and Asp194 in different ways, and as a result the 4 representative states have different geometric arrangements in the active site.
3 Free energies for intra-basin conformational motions
We will now calculate the pathway of interconversion between representative structures that belong to different clusters shown in Figure 2, i.e. the path between a conformation that belongs to cluster A and a conformation that is in cluster B, between conformations in clusters A and C etc. We used as the coordinate that describes progress along the path that connects the endpoint conformations the ΔRMSD, defined as the RMSD of a point along the pathway relative to one end, minus the RMSD of the same point relative to the other end of the pathway.20 One could use this ΔRMSD coordinate to drive the conformational transition and hope that if the simulation is carried out long enough, the minimum free energy path will be reached. A more targeted strategy is to first use a method that finds the minimum free energy path, and only then do an umbrella sampling by projecting the minimum free energy path onto the ΔRMSD coordinate. This strategy was carried out by Brooks and coworkers21 where they used the nudged-elastic band method22 to find a minimum energy pathway before they proceeded with the umbrella sampling. We will follow their procedure, but we will use the finite-temperature string method instead of their nudged-elastic band, to find the minimum free energy path.
3.1 String Methods
The string method23–26 can identify the minimum energy path (for the zero-temperature string method) or the minimum free energy path (for the finite-temperature string) that connects two stable states, without need of knowing a predefined reaction coordinate. In this work we first used the zero-temperature string to find a reasonable minimum energy path between a pair of conformations on the potential energy surface. Then, using this pathway as the starting path, we used the finite-temperature string to find the minimum free energy pathway between the endpoint conformations (We could have done this in one step, but found the approach to be numerically unstable on such a large system.)
The implementation of the string method requires discretization of the string into a chain of images. Once a reasonable initial pathway that connects the stable states is defined, the string methods proceed iteratively. The zero-temperature string descends in the potential energy landscape in iterations of 2 steps: first an energy minimization (using the true potential energy) for each image is performed; then a reparameterization is performed to enforce some constraint on the images, e.g. that the distances between neighboring images remain equal. For the finite-temperature string method a restrained Langevin dynamics simulation is performed to obtain a distribution of structures which are then averaged. Then the reparameterization is enforced on the average structures along the finite temperature string.
The initial pathway for the zero-temperature string was generated by a straight line interpolation between the fixed endpoints. Intermediate images were relaxed by energy minimization, then redistributed along the string by cubic spline interpolation to enforce the constraint that the images remain equally spaced by mass-weighted RMSD. Minimization of each image was carried out in two steps: first by 20 steps of ABNR minimization while the heavy atoms are held by a harmonic restraint (200 kcal/mol/Å2 force constant) in order the relieve strains in the structure that involve hydrogen atoms, followed by 20 more steps of ABNR minimization with a smaller force constant. The restraint during the second minimization cycle was gradually decreased during successive iterations toward the minimum energy path. Further minimization along a minimum energy pathway will merely slide the structures along the path.
The minimum energy path is not the correct pathway for conformational changes in proteins, instead the minimum free energy path is needed because it takes into account entropic effects. Using the output pathway of the zero-temperature string method as a starting path, we then employed the finite temperature string method. The descent of the string images on the free energy surface was done using Langevin dynamics to generate an ensemble of realizations restricted on hyperplanes perpendicular to the string. The finite-temperature string method doesn’t converge to a unique minimum free energy pathway, rather it identifies regions (“transition tubes”) in the conformational space that contain most of the transition pathways.
3.2 Free energies between conformations
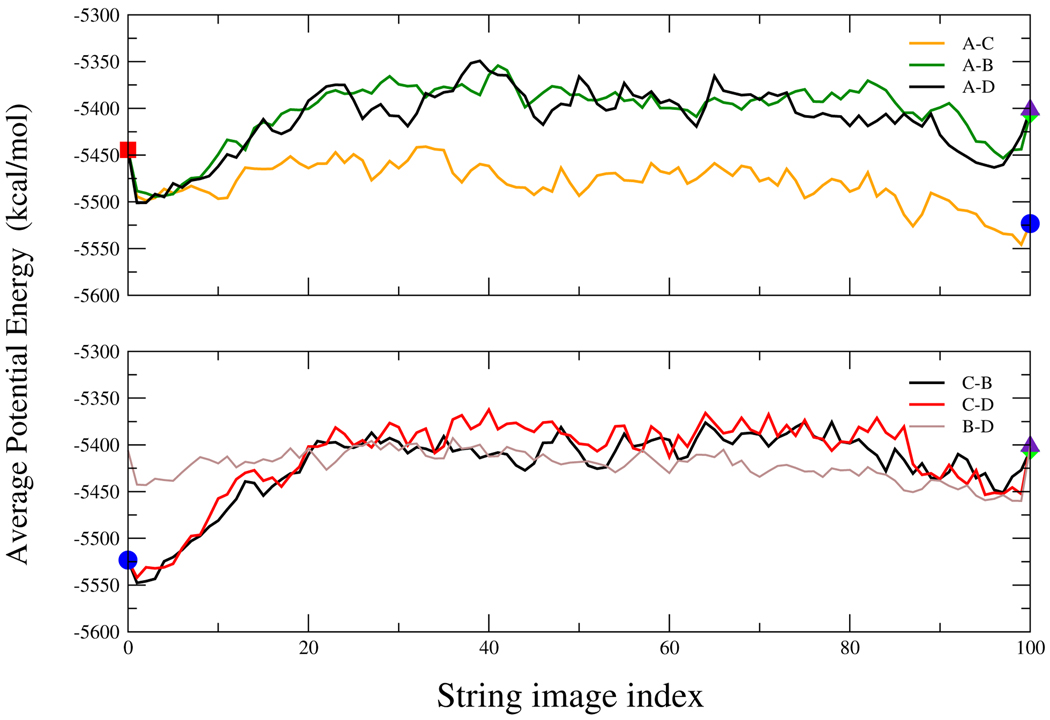
In Figure 4 we plot (vs. average potential energy) the pathways for the 6 possible conversions between the clusters shown in Figure 2, i.e. a conversion between a conformation that belongs to cluster A and a conformation that is in cluster B, conversion between conformations in clusters A and C etc. Each point along the finite-temperature string is a geometric average generated by Langevin dynamics simulation restrained around a target structure. It is the average potential energy, after subtracting the restraint, that is being plotted in Figure 4. (note the ruggedness of the potential energy landscape) It should be pointed out that this type of calculation requires thousands of CPU hours. Besides the present paper, there only one more work27 that applied the string method to a realistic protein.
Figure 4.
Converged pathways given by the finite-temperature string method for the 6 possible interconversions between the 4 clusters shown in Figure 2.
Finally, we need to compute the free energy between the conformations whose potential energy barriers are shown in Figure 4. With the paths of interconversion between end structures found, we next calculated the relative free energies along the finite-temperature strings. This was done by projecting the string onto an 1-dimensional progress coordinate, ΔRMSD. Umbrella sampling simulations followed by the weighted-histogram analysis method (WHAM) method to combine data from multiple simulations were employed to calculate the potential of mean force.
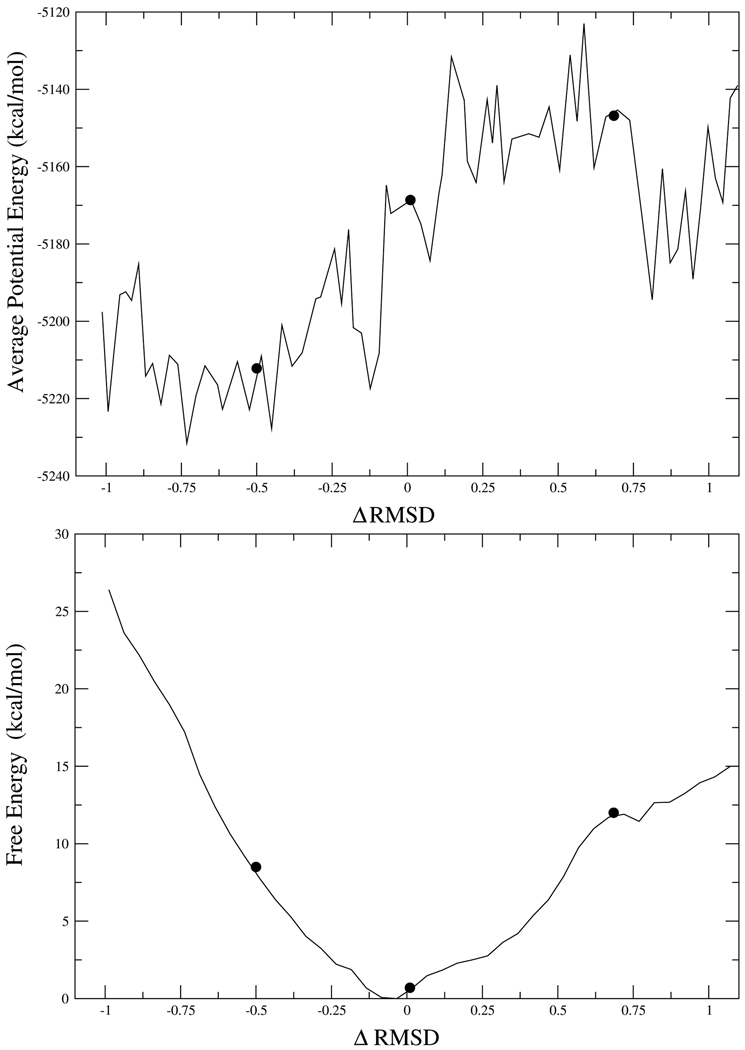
The result of one such calculation (between clusters C and D in Figure 2) of the free energy is shown in the bottom part of Figure 5. The energy is plotted vs the ΔRMSD coordinate. At first sight this result looks paradoxical since the endpoints, which are potential energy minima in the top of Figure 5, have higher free energy than the point at the of the potential energy barrier, shown in the top part of Figure 5. The explanation for this result is that there are very few conformations with short D–A distance. It is an entropic contribution that makes the rare short D–A conformations have high free energy. This is very similar to the well-known “golf course” potential,28 which also has a free energy barrier leading to a state that was a minimum in potential energy. That model problem also suggests that the free energy shown in Figure 5 should turn downwards close to the ends of the pathway: this trend does not appear in Figure 5 because the finite-temperature string had difficulty converging near the edges of the pathway, as can be seen in Figure 4. Nevertheless, Figure 4 captures the main feature of the free energy, that it is lower in the middle of the pathway (abundant conformations with long D–A distance) than far from it (rare conformations with short D–A distance).
Figure 5.
The underlying potential energy profile (top) and the free energy (bottom) for one of the conformational transformations (that between clusters C and D) shown in Figure 4.
4 Free energy of chemical reaction
The final necessary piece of information for interpreting the results is how these conformational changes affect the chemical barrier to reaction. We expect to find that conformations with short D–A distances have lower chemical barriers than those with long D–A distances.
The structures within several free energy windows along a conformational free energy pathway were obtained. Within a free energy window, the structure with the shortest donor-acceptor distance was used in the calculations of the chemical free energy barrier.
4.1 Methods
To model the chemical reaction catalyzed by human heart LDH we employed a combined quantum mechanical and molecular mechanical potential. The QM region contained 52 atoms including lactate, the sidechain of His193 (including the Cα as boundary), and atoms of NAD+ (nicotinamide and ribose with its C5′ as boundary). The connections between the QM and MM regions were modeled by the generalized hybrid orbital (GHO) method.29 The QM model used was the semiempirical Austin Model 1 (AM1). For the MM region we used the CHARMM22 force field for all protein atoms and the three-point charge TIP3P model for water molecules. The potential of mean force was calculated along the reaction coordinate defined as the distance d[(NC4-H–C2-H) + d(Nε2-H–O1-H)]. The free energy barrier was obtained by umbrella-sampling simulations. The free energies of the separate simulation windows along the reaction coordinate were combined using the weighed histogram analysis method (WHAM) to remove the contributions of biasing potentials.
4.2 Results
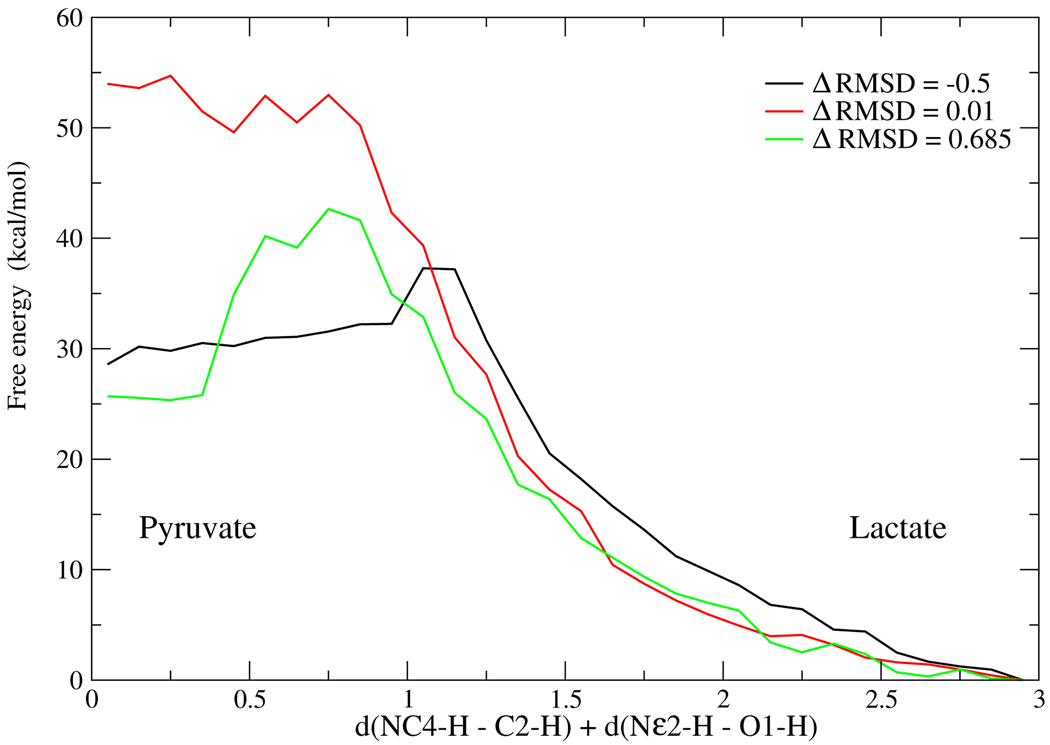
The chemical barrier to reaction along the free energy path of the conformational transition of Figure 5, is shown in Figure 6, using the reaction coordinate mentioned above, d[(NC4-H–C2-H) + d(Nε2-H–O1-H)]. Note that this reaction coordinate allows for some fluctuations of the D–A distance.
Figure 6.
The chemical barrier to reaction along the free energy path of the transformation in Figure 5. The reaction proceeds from right (Lactate) to left (Pyruvate). The lowest chemical barrier is obtained at the end point high free energy (rare) conformations. The 3 conformations for which the chemical barrier was calculated are marked with dots in Figure 5.
As we had expected, the conformation with shorter D–A distance has the lowest chemical barrier. We should point out this is just a verification of the consistency of the calculations. We know that it is almost certainly true that in LDH the catalytically competent conformations have short D–A distance because we have determined by TPS10,11 that this property is true for most reactive trajectories.
5 Conclusions
In previous work, by analyzing the TPS ensemble of reactive trajectories in the reaction catalyzed by human LDH, we found that a compressional motion along the donor-acceptor distance is present in all reactive trajectories. This finding raised the question, what kind of conformational motions bring the system to the catalytically competent conformations that have short donor-acceptor distance. In the present work we found that: a) these conformations are very rare; b) there is a free energy barrier of entropic origin towards these competent conformations. This last finding suggests that perhaps an appropriate description of catalysis in this enzyme is a search for these rare competent conformations, followed by the reactive event which is assisted by fast sub-ps protein motions.30
Acknowledgement
We acknowledge the support of the National Institutes of Health through grant GM068036, and the National Science Foundation through grant CHE-0714118.
References
- 1.Sigala P, Kraut D, Caaveiro J, Pybus B, Ruben E, Ringe D, Petsko G, Herschlag D. J. Am. Chem. Soc. 2008;130:13696–13708. doi: 10.1021/ja803928m. [DOI] [PMC free article] [PubMed] [Google Scholar]
- 2.Warshel A, Sharma, Kato M, Y X, Liu H, Olsson M. Chem. Rev. 2006;106:3210–3235. doi: 10.1021/cr0503106. [DOI] [PubMed] [Google Scholar]
- 3.(a) Henzler-Wildman K, Lei M, Thai V, Kerns S, Karplus M, Kern D. Nature. 2007;450:913–916. doi: 10.1038/nature06407. [DOI] [PubMed] [Google Scholar]; (b) Henzler-Wildman K, Lei M, Ott M, Wolf-Watz M, Fenn T, Pozharski E, Wilson M, Petsko G, Karplus M, Hübner C, Kern D. Nature. 2007;450:838–844. doi: 10.1038/nature06410. [DOI] [PubMed] [Google Scholar]; (c) Agarwal P, Geist A, Gorin A. Biochemistry. 2004;43:10605–10618. doi: 10.1021/bi0495228. [DOI] [PubMed] [Google Scholar]; (d) Agarwal P. J. Am. Chem. Soc. 2005;127:15248–15256. doi: 10.1021/ja055251s. [DOI] [PubMed] [Google Scholar]
- 4.Frauenfelder H, McMahon B, Austin R, Chu K, Groves J. Proc. Natl. Acad. Sci. USA. 2001;98:2370–2374. doi: 10.1073/pnas.041614298. [DOI] [PMC free article] [PubMed] [Google Scholar]
- 5.Boehr D, Dyson H, Wright P. Chem. Rev. 2006;106:3055–3079. doi: 10.1021/cr050312q. [DOI] [PubMed] [Google Scholar]
- 6.Antoniou D, Basner J, Núñez S, Schwartz SD. Chem. Rev. 2006;106:3170–3187. doi: 10.1021/cr0503052. [DOI] [PubMed] [Google Scholar]
- 7.(a) Hay S, Pudney C, Sutcliffe M, Scrutton N. Chem. Phys. Chem. 2008;15:1875–1881. doi: 10.1002/cphc.200800303. [DOI] [PubMed] [Google Scholar]; (b) Hay S, Pudney C, McGrory T, Pang J, Sutcliffe M, Scrutton N. Angew. Chem. 2009;48:1452–1454. doi: 10.1002/anie.200805502. [DOI] [PubMed] [Google Scholar]; (c) Johannissen L, Scrutton N, Sutcliffe M. J. R. Soc. Interf. 2008;5:5225–5232. doi: 10.1098/rsif.2008.0068.focus. [DOI] [PMC free article] [PubMed] [Google Scholar]; (d) Loveridge E, Tey L, Allemann R. J. Am. Chem. Soc. 2010;132:1137–1143. doi: 10.1021/ja909353c. [DOI] [PubMed] [Google Scholar]
- 8.(a) Bolhuis P, Chandler D, Dellago C, Geissler P. Annu. Rev. Phys. Chem. 2002;53:291–318. doi: 10.1146/annurev.physchem.53.082301.113146. [DOI] [PubMed] [Google Scholar]; (b) Dellago C, Chandler D. In: Bridging the time scales: molecular simulations for the next decade (vol. 605 of Lecture Notes in Physics) Nielaba P, Mareschal M, Ciccotti G, editors. New York: Springer Verlag; 2003. [Google Scholar]; (c) Hagan M, Dinner A, Chandler D, Chakraborty A. Proc. Natl. Acad. Sci. USA. 2003;100:13922–13927. doi: 10.1073/pnas.2036378100. [DOI] [PMC free article] [PubMed] [Google Scholar]
- 9.(a) Taylor E, Tyler P, Evans G, Furneaux R, Murkin A, Schramm V. J. Am. Chem. Soc. 2006;128:7126–7127. doi: 10.1021/ja061403n. [DOI] [PMC free article] [PubMed] [Google Scholar]; (b) Luo M, Li L, Schramm V. Biochemistry. 2008;47:2565–2576. doi: 10.1021/bi702133x. [DOI] [PubMed] [Google Scholar]
- 10.Quaytman S, Schwartz S. Proc. Natl. Acad. Sci. USA. 2007;104:12253–12258. doi: 10.1073/pnas.0704304104. [DOI] [PMC free article] [PubMed] [Google Scholar]
- 11.Saen-oon S, Quaytman S, Schramm V, Schwartz S. Proc. Natl. Acad. Sci. USA. 2008;105:16543–16548. doi: 10.1073/pnas.0808413105. [DOI] [PMC free article] [PubMed] [Google Scholar]
- 12.Basner JE, Schwartz SD. J. Phys. Chem. B. 2004;108:444–451. [Google Scholar]
- 13.(a) Becker O, Karplus M. J. Chem. Phys. 1997;106:1495–1517. [Google Scholar]; (b) Becker O. Proteins: Struct. Funct. Genet. 1997;27:213–226. doi: 10.1002/(sici)1097-0134(199702)27:2<213::aid-prot8>3.0.co;2-g. [DOI] [PubMed] [Google Scholar]
- 14.Read J, Winter V, Eszes C, Sessions R, Brady R. Proteins: Struct., Funct., Genet. 2001;43:175–185. doi: 10.1002/1097-0134(20010501)43:2<175::aid-prot1029>3.0.co;2-#. [DOI] [PubMed] [Google Scholar]
- 15.Loncharich RJ, Brooks BR, Pastor RW. Biopolymers. 1992;32:523–535. doi: 10.1002/bip.360320508. [DOI] [PubMed] [Google Scholar]
- 16.Brooks B, Bruccoleri R, Olafson B, States D, Swaminathan S, Karplus M. J. Comp. Chem. 1983;4:187–217. [Google Scholar]
- 17.Clarke A, Wigley D, Chia W, Barstow D, Atkinson T, Holbrook J. Nature. 1986;324:699–702. doi: 10.1038/324699a0. [DOI] [PubMed] [Google Scholar]
- 18.Levitt M. J. Mol. Biol. 1983;168:621–657. doi: 10.1016/s0022-2836(83)80306-4. [DOI] [PubMed] [Google Scholar]
- 19.Berry RS, Kunz R. Phys. Rev. Lett. 1995;74:3951–3954. doi: 10.1103/PhysRevLett.74.3951. [DOI] [PubMed] [Google Scholar]
- 20.Banavali NK, Roux B. J. Am. Chem. Soc. 2005;127:6866–6876. doi: 10.1021/ja050482k. [DOI] [PubMed] [Google Scholar]
- 21.Arora K, Brooks CL., III Proc. Natl. Acad. Sci. USA. 2007;104:18496–18501. doi: 10.1073/pnas.0706443104. [DOI] [PMC free article] [PubMed] [Google Scholar]
- 22.G GH, Uberuaga B, Jonsson H. J. Chem. Phys. 2000;113:9901. [Google Scholar]
- 23.E W, Ren W, Vanden-Eijnden E. Phys. Rev. B. 2002;66:052301. [Google Scholar]
- 24.E W, Ren W, Vanden-Eijnden E. J. Phys. Chem. B. 2005;109:6688–6693. doi: 10.1021/jp0455430. [DOI] [PubMed] [Google Scholar]
- 25.Ren W, Vanden-Eijnden E, Maragakis P, E W. J. Chem. Phys. 2005;123:134109. doi: 10.1063/1.2013256. [DOI] [PubMed] [Google Scholar]
- 26.E W, Ren W, Vanden-Eijnden E. J. Chem. Phys. 2007;126:164103. doi: 10.1063/1.2720838. [DOI] [PubMed] [Google Scholar]
- 27.Maragliano L, Cottone G, Ciccotti G, Vanden-Eijnden E. J. Am. Chem. Soc. 2010;132:1010–1017. doi: 10.1021/ja905671x. [DOI] [PubMed] [Google Scholar]
- 28.Bicout D, Szabo A. Prot. Sci. 2000;9:452–465. doi: 10.1110/ps.9.3.452. [DOI] [PMC free article] [PubMed] [Google Scholar]
- 29.Gao J, Amara P, Alhambra C, Field M. J. Phys. Chem. A. 1998;102:4714–4721. [Google Scholar]
- 30.Schwartz S, Schramm V. Nature Chem. Biol. 2009;5:551–558. doi: 10.1038/nchembio.202. [DOI] [PMC free article] [PubMed] [Google Scholar]


