

Abstract
The amount of information we can actively maintain “in mind” is very limited. This capacity limitation, as known as working memory capacity, has been of great interest due to its wide scope influence on the variety of intellectual abilities. Recently, there has been an ongoing debate about how this capacity should best be characterized. One viewpoint argues that working memory capacity is allocated in a discrete fashion with an upper limit of 3-4 representations. An alternative viewpoint argues that the capacity can be allocated in a continuous fashion with no upper limit in the number of representations. In this article, we will review recent neurobiological and behavioral evidence that has helped shape the debate regarding one of the more central mechanisms in cognitive neuroscience.
Our limited ability to actively hold information “in mind” is facilitated by the working memory (WM) system. WM is known to play a central role in most cognitive processes as a form of mental workspace. WM performance is severely disrupted in many psychiatric and neurological populations, and even within a healthy population individual differences in WM ability are strongly predictive of intelligence and reasoning ability. Consequently, many neuroscientists and psychologists have been motivated to better understand this central cognitive limitation. Here, we discuss an ongoing debate regarding how to best characterize the capacity limits of WM and how recent advances in neurophysiology have helped shape the debate.
Capacity Limits: Discrete Slots or Flexible Resource?
Over the past several decades, both behavioral and neural studies have suggested a capacity limit of only about 3-4 items in WM [1-10]. For example, Luck and Vogel [3] asked observers to detect supra-threshold changes amongst arrays of colored squares following a brief retention period, and found monotonic declines in change detection as the number of items to be stored increased. Based on the observers' accuracy, they concluded that observers could hold about four items worth of information in WM. Importantly, the same apparent limit was observed regardless of whether observers had to maintain a single feature (e.g., color) or multiple features (e.g., color and orientation) from each item, suggesting that capacity limits in WM are better defined by the maximum number of items that can be represented, rather than by the total quantity of information. This kind of item-based limit in WM falls in line with so-called discrete resource or “slot” models of capacity in WM. The discrete resource view suggests that resources for storage are quantized such that any item represented in WM must be assigned to an available slot. Thus, this view predicts that only a subset of items will be represented from supra-capacity displays, while no information will be retained for the remaining items [11]. By contrast, flexible resource models of capacity suggest that mnemonic resources can be allocated in a continuous fashion, without set limits on the number of items that can be represented [12,13]. Essentially, this view proposes that each item in a display receives a share of WM resources and that performance is limited for arrays with large numbers of items because each individual item receives only a small proportion of the available resources. Thus, these models suggest that there is no upper limit on the number of items that can be actively held in WM.
An extreme version of the discrete resource model might claim that observers can maintain up to four perfect representations in WM, with all errors in a memory task accounted for by monotonic declines as set size increases beyond this “magic” number. This caricature, however, overlooks multiple demonstrations that representations in WM have limited resolution or clarity. Discrete resource models can accommodate this result by acknowledging that slots do not have unlimited resolving power [2,11,14,15]. For example, it has been convincingly demonstrated that change detection performance is worse with complex stimuli [1,16]. Although this result may appear to suggest that smaller numbers of items can be represented as stimulus complexity rises, subsequent studies have shown that declines in change detection performance with complex stimuli may be better explained by high similarity between the items in complex stimulus categories. These studies showed that increased sample-test similarity leads to reduced change detection performance because of errors in detecting relatively small changes, rather than because of a reduction in the total number of items represented. Thus, errors in detecting such changes may be best explained by limited mnemonic resolution rather than by the storage of smaller numbers of items [2].
Interactions between number and resolution in WM
One empirical pattern that has sometimes been argued to support flexible resource accounts is the inverse relationship between resolution in WM and set size [11,12,14]. At first glance, this result is naturally explained by flexible resource models that posit a smaller proportion of resources for each item as set size increases. However, the inverse relationship between set size and WM resolution does not distinguish between discrete and flexible resource models, given that both models allow for variations in mnemonic resolution in sub-span displays. For example, Barton et al. [14] proposed that a limited number of discrete “slots” may determine the maximum number of representations that can be held in WM, while a separate resource determining mnemonic resolution is divided amongst the currently active slots. Thus, given that both models can accommodate an inverse relationship between resolution and set size in sub-span arrays, the most diagnostic aspect of this function comes after the putative item limit has been exceeded. Only the discrete resource model predicts that resolution should reach a stable lower bound after a specific item limit, because those models assume that displays exceeding that limit do not actually lead to the storage of additional items. In line with this prediction, Zhang and Luck [11] observed that resolution remained stable for arrays sizes that exceed the item limit in their study, in line with the predictions of the discrete resource model. This is still a controversial issue, however. For example, Bays and Husain [12] measured mnemonic resolution in a spatial WM task, and concluded that there was “no evidence for any discontinuity in the region of four items.” However, one caveat that may apply to both of these models is the fact that there are strong variations across individuals in their performance in these memory tasks [10,17,18]. Given that various studies have found that individual capacity estimates range from around 1 to 6 items, it may be overly simplistic to search for a single set size at which aggregate measures of resolution reach a stable asymptote. From this perspective, a convincing test of whether mnemonic resolution reaches an asymptote as at a specific item limit needs to take into account individual variations in capacity.
Another reason to give careful consideration to individual differences is that the discrete and flexible resource models make different predictions regarding whether number and resolution in WM will co-vary across individuals. Specifically, flexible resource models suggest that both aspects of memory are determined by a single pool of resources. If so, then individuals with ample mnemonic resources should excel both in terms of the maximum number of items that can be represented, as well as the resolution of those online representations. Awh et al. [2] tested this prediction by obtaining separate measures of number and resolution in WM across stimuli that varied in complexity. This analysis revealed that the maximum number of stimuli that could be maintained was highly correlated across both simple and complex stimuli, suggesting that a common slot system may constrain how many items can be stored, regardless of stimulus complexity. By contrast, there was no correlation between the number of items that could be maintained and the resolution of the stored representations, despite evidence supporting the reliability of the measures. Thus, number and resolution in WM seem to be best accounted for by a two-factor model in which they represent distinct aspects of memory ability. This two-factor model contradicts flexible resource models that posit a single resource to explain both aspects of memory performance.
Neural evidence for WM capacity limits
The most important criterion for WM is that it is an “online” memory system. This aspect is often ambiguous in behavioral measures partly because it is often difficult to assess whether performance was primarily determined by active maintenance in WM or if “offline” long term memory representations that were retrieved at test were also contributing to the subject's behavioral report. Here, neural measures of WM have a critical advantage because they can isolate sustained activity that occurs exclusively during the maintenance period. For example, Vogel & Machizawa [19] recorded EEG from subjects as they performed a lateralized WM change detection task in which they must remember arrays of simple objects presented in a cued hemifield. 300ms following the onset of the memory array, they observed a large, negative-voltage wave over posterior contralateral electrodes that persisted throughout the maintenance period. This contralateral delay activity (CDA) has been shown to be strongly modulated by the number of items that must be remembered. It monotonically rises in amplitude from 1- to 3-items; reaching an asymptote at approximately 4-items. That is, this activity reaches a limit at approximately the same point as behavioral estimates predict that capacity is exhausted. Indeed, the specific point at which the CDA reaches asymptote is different for each subject depending upon his or her WM capacity. Thus, this “online” measure of WM is highly sensitive to individual differences in behavioral WM performance. In subsequent studies, the amplitude of this activity has been found to be unaffected by a number of factors such as object size & spacing, perceptual difficulty, number of locations, task difficulty, and arousal [20,21]. Similarly, recent WM neuroimaging studies have shown that activation in the human intra-parietal sulcus also increases with set size and reaches an asymptote at approximately four items for both simple and complex items [5,7,22]. Together, results from two separate neural techniques provide similar “online” measures of a limit on the maximum number of items that can be simultaneously represented in WM.
The patterns of neural activity described above are most easily explained by discrete resource models of WM because they show evidence that capacity is exhausted for arrays of four items and that these limits can be measured during the active maintenance stage of the task. It's not clear how a flexible resource model could account for the finding that activity asymptotes at a fixed number of items because they propose that all items in a display are equally represented in WM, just with dwindling levels of precision. Furthermore, the basic finding that the CDA is modulated by number of items is also challenging to these models. In particular, flexible resource models generally explain that superior mnemonic precision for 1-item arrays over 3-item arrays is because all WM resources can be dedicated to that single item in memory rather than being divided across three items. Thus, the same amount of WM resources are always consumed irrespective of how many items are being remembered on that trial, which results in varying levels of precision for report. However, if this is correct, then one would expect that a neural measure of WM resources should show equivalent levels of activation for 1- and 3-item arrays, but this is not the case. These models could potentially account for neural set size effects by postulating that when the objects don't require high levels of precision, some proportion of WM resources can be held in reserve. This would predict that objects that require high levels of mnemonic precision should show little or no modulation of the CDA across different set sizes. Recently, we tested this prediction by comparing CDA amplitudes for arrays of brightly colored squares with arrays of complex abstract shapes [23]. Figure 4 shows that while behavioral performance affirmed that the complex items were substantially more difficult to remember accurately, the CDA set size effects were identical for both complex and simple objects. Thus, corroborating the behavioral findings of Awh et al. [2] these results suggest that an equivalent number of items can be stored in visual WM, regardless of complexity [24,25]
4.
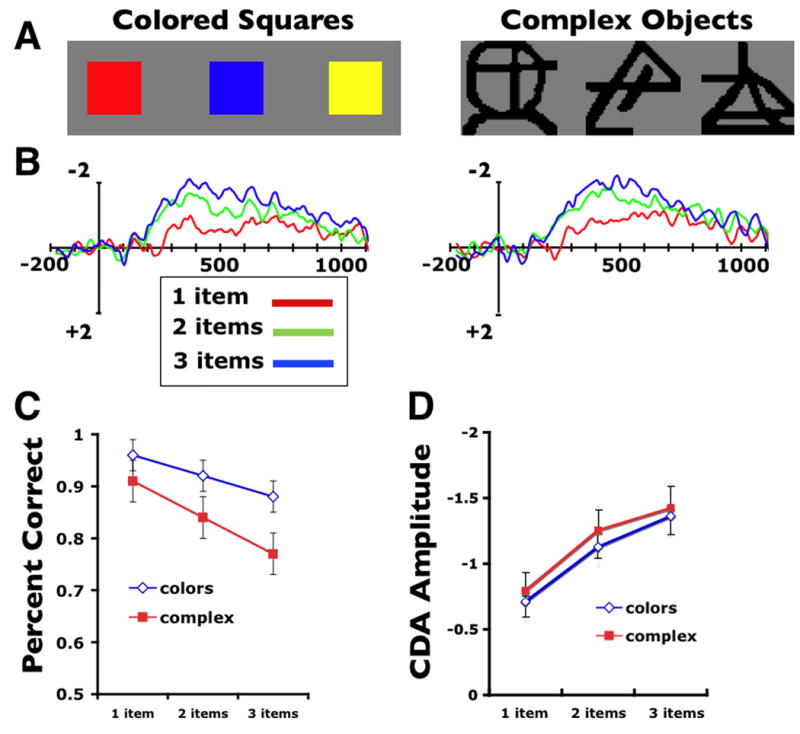
A. Example stimuli for colored squares and complex items. The memory arrays consisted of 1, 2, or 3 items. B. CDA difference waves across set sizes for colors and complex items. C. Average change detection accuracy for the two conditions across set sizes. D. Mean amplitude of the CDA for both conditions across the three set sizes.
Neural Oscillations and Capacity limits
A specific neurophysiological mechanism for WM capacity limits has been proposed by computational models that utilize neural oscillations as the primary representational scheme for information being held in WM. These models propose that each item held in WM is represented through a unique pattern of synchronous firing across large populations of neurons with each coding different attributes of the item (e.g., color, shape, position, etc). When multiple items must be held simultaneously in WM, the oscillatory activity for each item must be kept “out of phase” with the others in memory so they won't interfere with one another. For example, Lisman & Idiart,[26], proposed that the number of high frequency EEG cycles (e. g. gamma band, 25∼100hz) that can be embedded in the low frequency EEG cycle (e.g. theta band, 4∼7hz) determines the number of separated representations that can be held in WM without interference. Using a similar oscillatory modeling approach, Raffone & Wolters [27] suggested that the maximal number of asynchronous representations was about three to four items. One compelling aspect of these oscillatory models is that a discrete, item-based WM capacity limit may ultimately be due to a basic biophysical limitation surrounding how represented information can be segregated in the brain.
While these oscillatory models do provide a plausible neurophysiological explanation of capacity limits, to date there has been scant direct evidence that the brain actually employs such a phase-coding scheme in WM. However, in the last year there have been multiple studies that have begun to do just that. For example, Siegel et al [28] found that when monkeys performed a two-item sequential STM task, gamma oscillations over prefrontal cortex contained information about each object in separate phase orientations. That is, item 1 was always coded in a specific range of phase orientations that did not overlap with item 2. However, on trials when the monkey made an error, these phase orientations did indeed overlap. While these results alone are not sufficient to confirm oscillatory capacity limit models, they do provide the first critical demonstration that the brain uses phase-coding during WM tasks. With humans, multiple labs have begun taking an oscillatory approach to characterizing the CDA, which we have shown to be highly sensitive to capacity limitations. One challenge to this is that ERP components like the CDA are measured by averaging together many trials, which would likely wash out any oscillatory activity that wasn't in phase-locked to the stimulus. However, Jensen and colleagues [29,30] have recently demonstrated that the posterior alpha band (∼10hz) is often modulated asymmetrically. That is, alpha amplitude changes are reflected more in the peaks of the oscillation than in the troughs, which often remain unchanged. The consequence of such an asymmetrical modulation is that it results in a sustained slow wave, which is likely the source signal of the CDA. Consistent with this alpha-power viewpoint, multiple studies have recently shown that visual WM load modulates alpha power and that the magnitude of this modulation appears to predict individual differences in WM capacity [31,32].
Conclusions
The debate between discrete and continuous models of WM capacity isn't likely to end soon, partly because as the models have become more complex their predictions about behavior have become increasingly similar. However, we are optimistic that recent developments of precise neural measures of WM will help to better distinguish between these two models. To us, the CDA appears to provide a powerful “online” measure of the number of items that are currently in WM and thus provides strong evidence for discrete capacity models. New work is beginning to characterize the underlying oscillatory source of this “number of items” signal. At present, there is no “online” neural activity that has been shown to directly correspond to the resolution of information in WM. Though, some recent neuroimaging approaches examining activity in V1 and the lateral occipital complex have shown considerable potential in this regard [33,34]. We see this as likely being the next frontier in characterizing the capacity limits of this central cognitive mechanism.
1.
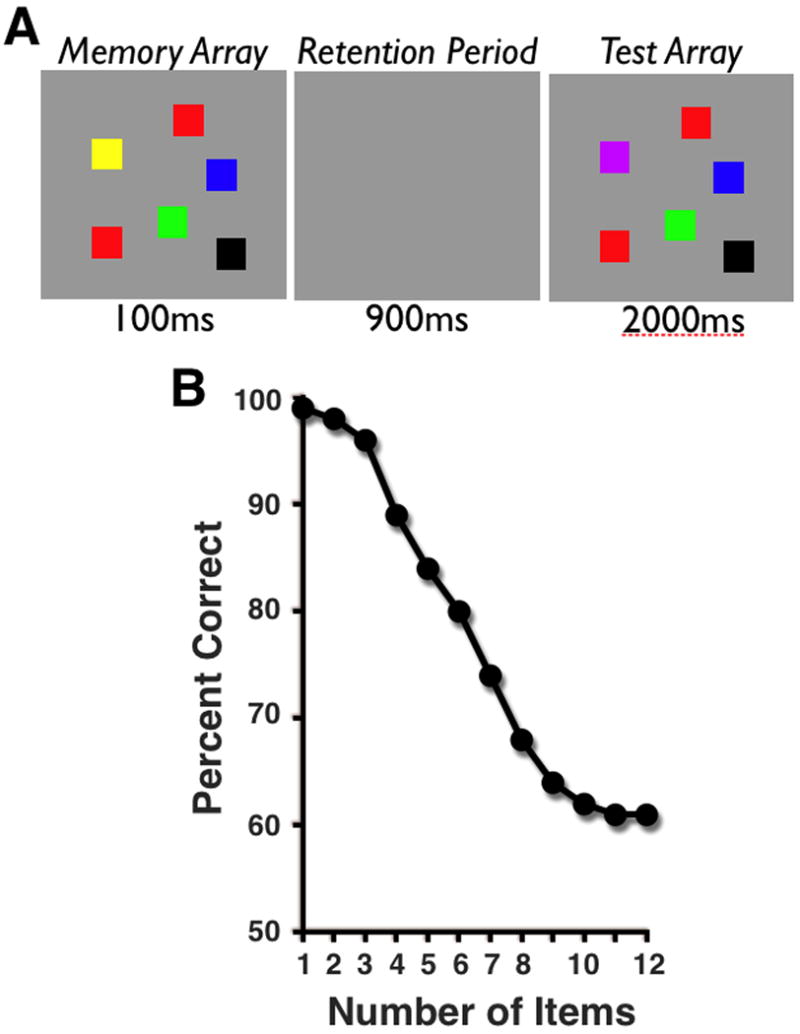
A. Typical change detection stimuli and procedure. Subjects must judge whether the colors in the test array are the same or different from those originally presented in the memory array. B. Average accuracy on change detection as a function of number of items (adapted from Luck & Vogel, 1997).
2.
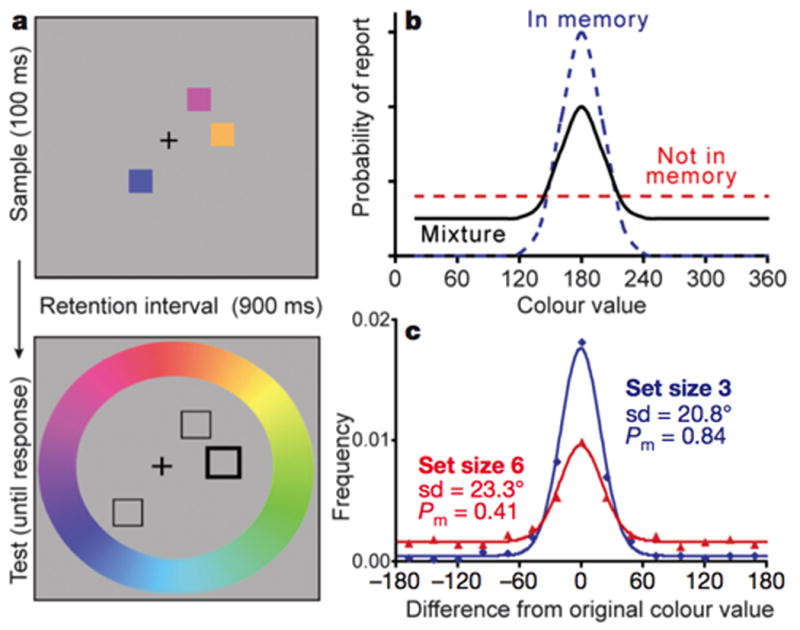
A. Visual WM recall procedure (adapted from Zhang & Luck, 2008). Subjects must remember the colors in the sample array across a 900ms retention interval. At test, subjects must report the original color of the cued item by clicking on the color wheel. B. Theoretical predictions of a mixture model of recall performance. This combines a Gaussian model of the resolution of the items held in WM (centered around the original color value) and a uniform distribution for the items that were not stored in memory. C. Results comparing set size 3 and 6. Note that while the standard deviation (reflecting the resolution) is equivalent, the tails of the function (reflecting missing items) increases for set size 6.
3.
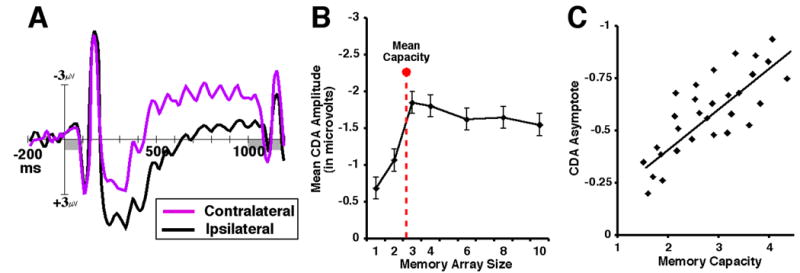
A. The contralateral delay activity (CDA). ERPs time-locked to the onset of the memory array in a bilateral change detection task. Posterior electrodes are averaged together in terms of whether they are ipsilateral or contralateral with respect to the visual field of the remembered items. B. Mean amplitude of CDA as a function of number of items in memory array. C. The correlation of CDA asymptote and individual memory capacity (adapted from Vogel & Machizawa, 2004).
Footnotes
Publisher's Disclaimer: This is a PDF file of an unedited manuscript that has been accepted for publication. As a service to our customers we are providing this early version of the manuscript. The manuscript will undergo copyediting, typesetting, and review of the resulting proof before it is published in its final citable form. Please note that during the production process errors may be discovered which could affect the content, and all legal disclaimers that apply to the journal pertain.
References
- 1.Alvarez GA, Cavanagh P. The capacity of visual short-term memory is set both by visual information load and by number of objects. Psychol Sci. 2004;15:106–111. doi: 10.1111/j.0963-7214.2004.01502006.x. [DOI] [PubMed] [Google Scholar]
- 2.Awh E, Barton B, Vogel EK. Visual working memory represents a fixed number of items regardless of complexity. Psychol Sci. 2007;18:622–628. doi: 10.1111/j.1467-9280.2007.01949.x. [DOI] [PubMed] [Google Scholar]
- 3.Luck SJ, Vogel EK. The capacity of visual working memory for features and conjunctions. Nature. 1997;390:279–281. doi: 10.1038/36846. [DOI] [PubMed] [Google Scholar]
- 4.Pashler H. Familiarity and visual change detection. Percept Psychophys. 1988;44:369–378. doi: 10.3758/bf03210419. [DOI] [PubMed] [Google Scholar]
- 5.Todd JJ, Marois R. Capacity limit of visual short-term memory in human posterior parietal cortex. Nature. 2004;428:751–754. doi: 10.1038/nature02466. [DOI] [PubMed] [Google Scholar]
- 6.Vogel EK, McCollough AW, Machizawa MG. Neural measures reveal individual differences in controlling access to working memory. Nature. 2005;438:500–503. doi: 10.1038/nature04171. [DOI] [PubMed] [Google Scholar]
- 7.Xu Y, Chun MM. Dissociable neural mechanisms supporting visual short-term memory for objects. Nature. 2006;440:91–95. doi: 10.1038/nature04262. [DOI] [PubMed] [Google Scholar]
- 8.Fukuda K, Vogel EK. Human variation in overriding attentional capture. J Neurosci. 2009;29:8726–8733. doi: 10.1523/JNEUROSCI.2145-09.2009. [DOI] [PMC free article] [PubMed] [Google Scholar]; * This study further examined the question of whether individual differences in WM capacity are due to the number of available representations in WM or if they reflect the efficiency of attentional control over these representations. Here, we used ERPs to show that low capacity individuals were more prone to involuntary attentional capture by distractors, which leads to the unnecessary retention of irrelevant information in working memory. These results supported the hypothesis that the individual differences in working memory capacity may primarily reflect how the individual can recover from attentional capture by distracting information within the first moments following stimulus onset.
- 9.Sperling G. The information available in brief visual presentations. Psychological Monographs: General and Applied. 1960;74 [Google Scholar]
- 10.Rouder JN, Morey RD, Cowan N, Zwilling CE, Morey CC, Pratte MS. An assessment of fixed-capacity models of visual working memory. Proc Natl Acad Sci U S A. 2008;105:5975, 5979. doi: 10.1073/pnas.0711295105. [DOI] [PMC free article] [PubMed] [Google Scholar]; * Using a computational modeling approach, the authors evaluated several variations of both discrete and continuous models of WM. They found that discrete models showed superior fits of measured WM performance over continuous models, particularly when individual differences in WM performance was accounted for.
- 11.Zhang W, Luck SJ. Discrete fixed-resolution representations in visual working memory. Nature. 2008;453:233–235. doi: 10.1038/nature06860. [DOI] [PMC free article] [PubMed] [Google Scholar]; * They developed a working memory recall procedure that enabled them to separately assess the number and the precision of representations held in working memory. Their mixture modeling analysis suggested that across several types of stimuli, individuals had discrete representations of 3∼4 objects. Precision decreased as the number of representations increased up to one's capacity estimate, after which the precision remained constant.
- 12.Bays PM, Husain M. Dynamic shifts of limited working memory resources in human vision. Science. 2008;321:851–854. doi: 10.1126/science.1158023. [DOI] [PMC free article] [PubMed] [Google Scholar]; * Here, they investigated how precision of spatial representations in working memory changes as they attempt to remember more locations. They found a monotonic decline in the precision as the number of location increased even beyond the typical capacity limit of 3∼4. They interpreted the result as an evidence for continuous allocation of working memory resource. However, they did not take into consideration the individual differences in working memory capacity, which could potentially compromise such an interpretation.
- 13.Wilken P, Ma WJ. A detection theory account of change detection. J Vis. 2004;4:1120–1135. doi: 10.1167/4.12.11. [DOI] [PubMed] [Google Scholar]
- 14.Barton B, Ester EF, Awh E. Discrete resource allocation in visual working memory. J Exp Psychol Hum Percept Perform. 2009;35:1359–1367. doi: 10.1037/a0015792. [DOI] [PMC free article] [PubMed] [Google Scholar]
- 15.Zhang W, Luck SJ. Sudden death and gradual decay in visual working memory. Psychol Sci. 2009;20:423–428. doi: 10.1111/j.1467-9280.2009.02322.x. [DOI] [PMC free article] [PubMed] [Google Scholar]
- 16.Eng HY, Chen D, Jiang Y. Visual working memory for simple and complex visual stimuli. Psychon Bull Rev. 2005;12:1127–1133. doi: 10.3758/bf03206454. [DOI] [PubMed] [Google Scholar]
- 17.Vogel EK, Awh E. How to exploit diversity for scientific gain: Using individual differences to constrain cognitive theory. Current Directions in Psychological Science. 2008;17:171–176. [Google Scholar]
- 18.Kane MJ, Hambrick DZ, Tuholski SW, Wilhelm O, Payne TW, Engle RW. The generality of working memory capacity: a latent-variable approach to verbal and visuospatial memory span and reasoning. J Exp Psychol Gen. 2004;133:189–217. doi: 10.1037/0096-3445.133.2.189. [DOI] [PubMed] [Google Scholar]
- 19.Vogel EK, Machizawa MG. Neural activity predicts individual differences in visual working memory capacity. Nature. 2004;428:748–751. doi: 10.1038/nature02447. [DOI] [PubMed] [Google Scholar]
- 20.McCollough AW, Machizawa MG, Vogel EK. Electrophysiological measures of maintaining representations in visual working memory. Cortex. 2007;43:77–94. doi: 10.1016/s0010-9452(08)70447-7. [DOI] [PubMed] [Google Scholar]
- 21.Ikkai A, McCollough AW, Vogel EK. Contralateral delay activity provides a neural measure of the number of representations in visual working memory. J Neurophysiol. doi: 10.1152/jn.00978.2009. in press. [DOI] [PMC free article] [PubMed] [Google Scholar]
- 22.Todd JJ, Marois R. Posterior parietal cortex activity predicts individual differences in visual short-term memory capacity. Cogn Affect Behav Neurosci. 2005;5:144–155. doi: 10.3758/cabn.5.2.144. [DOI] [PubMed] [Google Scholar]
- 23.Perez V, Ashby NS, Awh E, Vogel EK. Complex objects do not consume more visual working memory capacity. in preparation. [Google Scholar]
- 24.Gao Z, Li J, Liang J, Chen H, Yin J, Shen M. Storing fine detailed information in visual working memory--evidence from event-related potentials. J Vis. 2009;9:17. doi: 10.1167/9.7.17. [DOI] [PubMed] [Google Scholar]
- 25.Luria R, Sessa P, Gotler A, Jolicoeur P, Dell'acqua R. Visual Short-term Memory Capacity for Simple and Complex Objects. J Cogn Neurosci. 2009 doi: 10.1162/jocn.2009.21214. [DOI] [PubMed] [Google Scholar]; * The ERP measure of working memory capacity (i.e. CDA) was tested for abstract polygon shapes and colors. Here they found that the CDA was larger and had shallower set size effects for polygons as compared to colors. These results suggest that polygons consumed a greater proportion of working memory resources than colors which is consistent continuous resource allocation models. Though, considering the very different pattern of results that we found for complex shapes (Figure 4), it is currently unclear whether these results are unique to polygons. Thus, further experiments using this approach will be necessary to examine a wide range of precision-limited stimulus (e.g., color, spatial position, etc.) to establish whether they influence the number of representations that are held in WM.
- 26.Lisman JE, Idiart MAP. Storage of 7+/-2 Short-Term Memories in Oscillatory Subcycles. Science. 1995;267:1512–1515. doi: 10.1126/science.7878473. [DOI] [PubMed] [Google Scholar]
- 27.Raffone A, Wolters G. A cortical mechanism for binding in visual working memory. J Cogn Neurosci. 2001;13:766–785. doi: 10.1162/08989290152541430. [DOI] [PubMed] [Google Scholar]
- 28.Siegel M, Warden MR, Miller EK. Phase-dependent neuronal coding of objects in short-term memory. Proc Natl Acad Sci U S A. 2009 doi: 10.1073/pnas.0908193106. [DOI] [PMC free article] [PubMed] [Google Scholar]
- 29.van Dijk H, van der Werf J, Mazaheri A, Medendorp WP, Jensen O. Modulations in oscillatory activity with amplitude asymmetry can produce cognitively relevant event-related responses. Proceedings of the National Academy of Sciences of the United States of America. 2010;107:900–905. doi: 10.1073/pnas.0908821107. [DOI] [PMC free article] [PubMed] [Google Scholar]
- 30.Mazaheri A, Jensen O. Asymmetric amplitude modulations of brain oscillations generate slow evoked responses. J Neurosci. 2008;28:7781–7787. doi: 10.1523/JNEUROSCI.1631-08.2008. [DOI] [PMC free article] [PubMed] [Google Scholar]
- 31.Grimault S, Robitaille N, Grova C, Lina JM, Dubarry AS, Jolicoeur P. Oscillatory activity in parietal and dorsolateral prefrontal cortex during retention in visual short-term memory: additive effects of spatial attention and memory load. Hum Brain Mapp. 2009;30:3378–3392. doi: 10.1002/hbm.20759. [DOI] [PMC free article] [PubMed] [Google Scholar]
- 32.Sauseng P, Klimesch W, Heise KF, Gruber WR, Holz E, Karim AA, Glennon M, Gerloff C, Birbaumer N, Hummel FC. Brain oscillatory substrates of visual short-term memory capacity. Curr Biol. 2009;19:1846–1852. doi: 10.1016/j.cub.2009.08.062. [DOI] [PubMed] [Google Scholar]
- 33.Ester EF, Serences JT, Awh E. Spatially global representations in human primary visual cortex during working memory maintenance. J Neurosci. 2009;29:15258–15265. doi: 10.1523/JNEUROSCI.4388-09.2009. [DOI] [PMC free article] [PubMed] [Google Scholar]
- 34.Serences JT, Ester EF, Vogel EK, Awh E. Stimulus-specific delay activity in human primary visual cortex. Psychol Sci. 2009;20:207–214. doi: 10.1111/j.1467-9280.2009.02276.x. [DOI] [PMC free article] [PubMed] [Google Scholar]