

Abstract
Aims
It is well established that glaucoma results in a thinning of the inner retina. To investigate whether the outer retina is also involved, ultrahigh-resolution retinal imaging techniques were utilised.
Methods
Eyes from 10 glaucoma patients (25–78 years old), were imaged using three research-grade instruments: (1) ultrahigh-resolution Fourier-domain optical coherence tomography (UHR-FD-OCT), (2) adaptive optics (AO) UHR-FD-OCT and (3) AO-flood illuminated fundus camera (AO-FC). UHR-FD-OCT and AO-UHR-FD-OCT B-scans were examined for any abnormalities in the retinal layers. On some patients, cone density measurements were made from the AO-FC en face images. Correlations between retinal structure and visual sensitivity were measured by Humphrey visual-field (VF) testing made at the corresponding retinal locations.
Results
All three in vivo imaging modalities revealed evidence of outer retinal changes along with the expected thinning of the inner retina in glaucomatous eyes with VF loss. AO-UHR-FD-OCT images identified the exact location of structural changes within the cone photoreceptor layer with the AO-FC en face images showing dark areas in the cone mosaic at the same retinal locations with reduced visual sensitivity.
Conclusion
Losses in cone density along with expected inner retinal changes were demonstrated in well-characterised glaucoma patients with VF loss.
Introduction
Glaucoma is the second leading cause of blindness worldwide after cataract.1 It is widely accepted that the primary site of injury in glaucoma is the retinal ganglion cell (RGC).2 Elevated intraocular pressure (IOP) associated with some glaucomas irreversibly damages the ganglion cell axons in the optic nerve, followed by retrograde degeneration of their cell bodies.3 4 Studies have also shown evidence of photoreceptor involvement in conjunction with RGC damage, but this has been a topic of debate.5–13 One way to confirm their involvement is to obtain in vivo images of photoreceptors in glaucomatous eyes. However, the limited resolution of conventional retinal-imaging instruments has not allowed visualisation of individual photoreceptors due to the uncorrected higher-order ocular aberrations. By applying adaptive optics (AO) to various retinal imaging modalities,14–18 it is now possible to image individual photoreceptors in vivo. Our recent published study of patients exhibiting glaucoma-like VF defects in other optic neuropathies (optic nerve head drusen, optic neuritis, non-arteritic ischaemic optic neuropathy, pseudotumour cerebri) revealed structural changes in cones combined with expected inner retinal changes.19 This finding raises the possibility that similar outer retinal changes also occur in glaucoma.
Methods
Subjects
Ten patients with different types of glaucoma (25–78 years of age) were identified in the glaucoma clinics at the University of California, Davis. One of the patients (patient no 6) was a participant in the Ocular Hypertension Treatment Study (OHTS) who was determined by the endpoint committee to have developed primary open-angle glaucoma (POAG).20 21 A second patient (patient no 5) was a former participant in the recent Phase 3 clinical trial of memantine as a neuroprotective drug and had been determined by that study's coordinating centre to have POAG with glaucomatous optic neuropathy and corresponding VF loss. Table 1 summarises the clinical findings and patient characteristics.
Table 1. Summary of clinical findings of glaucoma patients.
| (a) Patient no 1 | Age: 25 | Diagnosis: pigmentary dispersion glaucoma |
| Right eye | Left eye | |
| Visual acuity | ▶ 20/15 | ▶ 20/15 |
| Colour vision | ▶ Within normal limits | ▶ Within normal limits |
| VF | ▶ Within normal limits, foveal threshold of 37 dB, MD of −1.67 dB | ▶ Superior arcuate defect, inferior partial arcuate defect, foveal threshold of 37 dB, MD of −16.37 dB |
| IOP (mm Hg) | ▶ 15 | ▶ 17 |
| Refractive error | ▶ −1.50 D (sphere) | ▶ −1.75 D (sphere) |
| Fundus | ▶ 0.7 C/D ratio with no notching—see supplementary figure 1A | ▶ 0.85 C/D ratio with pallor in the cup and narrow rim—see supplementary figure 1A |
| (b) Patient no 2 | Age: 48 | Diagnosis: POAG |
| Visual acuity | ▶ 20/20-1 | ▶ 20/20-1 |
| Colour vision | ▶ Within normal limits | ▶ Within normal limits |
| VF | ▶ Within normal limits, foveal threshold of 35 dB, MD of −0.28 dB | ▶ Inferior nasal step, foveal threshold of 36 dB, MD of −1.49 dB |
| IOP (mm Hg) | ▶ 12 | ▶ 13 |
| Refractive error | ▶ −6.50+0.50×70 | ▶ −6.50+1.00×95 |
| Fundus | ▶ 0.6 C/D ratio, normal fundus—see supplementary figure 1B | ▶ 0.8 C/D ratio with superior notch with a focal NFL defect—see supplementary figure 1B |
| (c) Patient no 3 | Age: 33 | Diagnosis: POAG |
| Visual acuity | ▶ 20/20 | ▶ 20/20 |
| Colour vision | ▶ Within normal limits | ▶ Within normal limits |
| VF | ▶ Within normal limits, foveal threshold of 39 dB, MD of 0.00 dB | ▶ Superior arcuate defect, foveal threshold of 40 dB, MD of −10.77 dB |
| IOP (mm Hg) | ▶ 15 | ▶ 8 |
| Refractive error | ▶ −8.75+1.00×10⁵ | ▶ −9.00+3.50×87 |
| Fundus | ▶ 0.8 C/D ratio—see supplementary figure 1C | ▶ 0.9 C/D ratio—see supplementary figure 1C |
| (d) Patient no 4 | Age: 63 | Diagnosis: POAG |
| Visual acuity | ▶ 20/20-1 | ▶ 20/30 |
| Colour vision | ▶ Within normal limits | ▶ Within normal limits |
| VF | ▶ Superior nasal step, foveal threshold of 35 dB, MD of −5.21 dB | ▶ Inferior nasal step, foveal threshold of 33 dB, MD of −4.09 dB |
| IOP (mm Hg) | ▶ 14 | ▶ 12 |
| Refractive error | ▶ +1.50 +0.75×180 | ▶ +1.00 D (sphere) |
| Fundus | ▶ 0.75 C/D ratio with thin rim and peripapillary atrophy, no disc haemorrhage, vitreous syneresis—see supplementary figure 1D | ▶ 0.8 C/D ratio with thin rim and peripapillary atrophy, no disc haemorrhage, vitreous syneresis—see supplementary figure 1D |
| (e) Patient no 5 | Age: 57 | Diagnosis: POAG |
| Visual acuity | ▶ 20/20 | ▶ 20/15-2 |
| Colour Vision | ▶ Within normal limits | ▶ Within normal limits |
| VF | ▶ Superior partial arcuate defect, foveal threshold of 36 dB, MD of −8.35 dB | ▶ Within normal limits, foveal threshold of 36 dB, MD of −0.75 dB |
| IOP (mm Hg) | ▶ 12 | ▶ 12 |
| Refractive error | ▶ −3.25+0.50×100 | ▶ −4.00+0.75×72 |
| Fundus | ▶ 0.8 C/D ratio with a focal NFL defect, small disc haemorrhage—see supplementary figure 1E | ▶ 0.7 C/D ratio with inferior temporal thinning of the rim, no disc haemorrhage—see supplementary figure 1E |
| (f) Patient no 6 | Age: 55 | Diagnosis: POAG |
| Visual acuity | ▶ 20/15-2 | ▶ 20/15-2 |
| Colour vision | ▶ Within normal limits | ▶ Within normal limits |
| VF | ▶ Within normal limits, foveal threshold of 38 dB, MD of −0.28 dB | ▶ Within normal limits, foveal threshold of 36 dB, MD of −0.56 dB |
| IOP (mm Hg) | ▶ 15 | ▶ 17 |
| Refractive error | ▶ −4.75+0.50×95 | ▶ −6.25+1.50×75 |
| Fundus | ▶ 0.6 C/D ratio with inferior notch, no disc haemorrhage—see supplementary figure 1F | ▶ 0.4 C/D ratio—see supplementary figure 1F |
| (g) Patient no 7 | Age: 56 | Diagnosis: NTG |
| Visual Acuity | ▶ 20/20 | ▶ 20/20 |
| Colour vision | ▶ Abnormally high tritan scores | ▶ Abnormally high tritan scores |
| VF | ▶ Within normal limits, foveal threshold of 36 dB, MD of +0.07 dB | ▶ Inferior partial arcuate defect, foveal threshold of 36 dB, MD of −4.95 dB |
| IOP (mm Hg) | ▶ 13 | ▶ 13 |
| Refractive error | ▶ −5.25+1.00×180 | ▶ −4.75+0.75×25 |
| Fundus | ▶ 0.6 C/D ratio with no disc haemorrhage—see supplementary figure 1G | ▶ 0.7 C/D ratio with disc haemorrhage at 1 o'clock position—see supplementary figure 1G |
| (h) Patient no 8 | Age: 50 | Diagnosis: NTG |
| Visual acuity | ▶ 20/25-2 | ▶ 20/20-2 |
| Colour vision | ▶ Not available for testing | ▶ Not available for testing |
| VF | ▶ Superior arcuate defect, foveal threshold of 37 dB, MD of −4.54 dB | ▶ Within normal limits, foveal threshold of 38 dB, MD of+0.25 dB |
| IOP (mm Hg) | ▶ 14 | ▶ 20 |
| Refractive error | ▶ +2.00 +1.00×146 | ▶ +1.00+0.50×43 |
| Fundus | ▶ 0.8 C/D ratio with disc haemorrhage at 8-9 o'clock position—see supplementary figure 1H | ▶ 0.8 C/D ratio with disc haemorrhage at 5 o'clock position—see supplementary figure 1H |
| (i) Patient no 9 | Age: 78 | Diagnosis: POAG |
| Visual acuity | ▶ 20/20-1 | ▶ 20/20 |
| Colour vision | ▶ Not available for testing | ▶ Not available for testing |
| VF | ▶ Superior arcuate defect as well as inferior partial arcuate defect, foveal threshold of 36 dB, MD of −15.09 dB | ▶ Inferior partial arcuate defect, foveal threshold of 35 dB, MD of −6.72 dB |
| IOP (mm Hg) | ▶ 18 | ▶ 17 |
| Refractive error | ▶ −0.25+0.50×167 | ▶ +0.25+0.50×175 |
| Fundus | ▶ 0.9 C/D ratio with loss of rimdsee supplementary figure 1I | ▶ 0.9 C/D ratio with loss of rim—see supplementary figure 1I |
| (j) Patient no 10 | Age: 57 | Diagnosis: POAG |
| Visual acuity | ▶ 20/20 | ▶ 20/20 |
| Colour vision | ▶ Abnormally high tritan scores | ▶ Abnormally high tritan scores |
| VF | ▶ Superior arcuate defect involving fixation, foveal threshold of 36 dB, MD −2.74 dB | ▶ Within normal limits, foveal threshold of 33 dB, MD of −1.84 dB |
| IOP (mm Hg) | ▶ 13 | ▶ 11 |
| Refractive error | ▶ −2.00+1.00×050 | ▶ −4.75+3.50×162 |
| Fundus | ▶ 0.8 C/D ratio with 360° peripapillary atrophy, thinning of rim in the inferior temporal region—see supplementary figure 1J | ▶ 0.6 C/D ratio with normal optic nerve rim—see supplementary figure 1J |
C/D, cup to disc; IOL, intraocular lens; NFL, nerve fibre layer; NTG, normal tension glaucoma; POAG, primary open-angle glaucoma; VF, visual field.
All patients had various combinations of characteristic glaucomatous changes such as enlargement of cup-to-disc ratios, disc haemorrhages, peripapillary atrophy, focal notching, thinning of neural rims and VF defects. Supplementary figure 1 shows fundus pictures from both eyes of the patients. All showed significantly enlarged optic cups with thinning of neural rims consistent with glaucomatous optic neuropathy. Humphrey VF 24-2 SITA (Swedish Interactive Threshold Algorithm) Standard paradigm with size III stimulus was used to test visual sensitivity in all patients.
Three normal subjects of different ages (21, 35 and 58 years old) were also imaged for comparison. All normals underwent comprehensive ophthalmic examinations including a dilated fundus exam to confirm that they are free of any eye diseases, and their visual function (eg, visual acuity, visual sensitivity and colour vision) was within normal limits. To optimise AO performance, patients and normal subjects with clear ocular media were selected.
The Tenets of the Declaration of Helsinki were observed throughout, and the protocol was approved by the Institutional Review Board of the University of California, Davis, School of Medicine. Written informed consent was obtained after all procedures were fully explained to the subjects and prior to any experimental measurements.
Procedure
In vivo retinal imaging
Three custom instruments were used for retinal imaging: (1) an ultrahigh-resolution Fourier-domain optical coherence tomography (UHR-FD-OCT), (2) an AO–UHR-FD-OCT and (3) an AO-flood illuminated fundus camera (AO-FC). Table 2 describes the role of each instrument in this study.
Table 2. Retinal imaging modalities and their role in this study.
| Modality | Usage | AO system | FOV | Reference |
|---|---|---|---|---|
| UHR-FD-OCT | ▶ To assess the integrity of all the retinal layers | ▶ NA | ▶ 18° FOV | 22 |
| AO-UHR-FD-OCT | ▶ Outer retina—cone photoreceptor and RPE layers | ▶ Hartmann–Shack wavefront sensor | ▶ 0.25×0.3 mm | 15 |
| ▶ Used on nine of the 10 glaucoma patients | ▶ 2 DMs: a bimorph DM to correct the refractive error and a Micro-ElectroMechanical Systems DM for the higher-order aberration | ▶ 0.86°×1.04° FOV | ||
| ▶ Retinal locations of different visual sensitivity based on the Humphrey visual-field analysis were selected for imaging | ▶ 300 frames at ∼3 μm isotropic volumetric resolution | |||
| ▶ 841±61 nm imaging light | ||||
| AO-FC | ▶ Outer retina—cone photoreceptors | ▶ Hartmann–Shack wavefront sensor | ▶ 1° FOV | 18 |
| ▶ Imaged the same locations in seven of the nine eyes imaged with AO-UHR-FD-OCT above | ▶ One DM: trial lenses used to correct the refractive error | ▶ ∼2.5 μm lateral resolution | ||
| ▶ 650±40 nm imaging light |
AO, adaptive optics; AO-FC, AO-flood illuminated fundus camera; DM, deformable mirror; FOV, field of view; UHR-FD-OCT, ultrahigh-resolution Fourier-domain optical coherence tomography.
Each system has a calibrated fixation target for testing different retinal eccentricities, that is the same retinal location could be imaged on each patient. Subjects were instructed to look at the tip of an arrow that could be moved to different positions on the calibrated fixation target spanning ±10° on the retina. Hence, the retinal area of interest can be aligned with the imaging system while the subject is looking at the tip of the arrow. Prior to image acquisition, pupils were dilated with 1% tropicamide and 2.5% phenylephrine. A bite bar was used to stabilise the patient's head during imaging.
Functional testing
A Humphrey VF analyser (HFA II-I series; Carl Zeiss Meditec, Dublin, California) with SITA standard, central 24-2 threshold paradigm and white stimulus size 3 (0.43° diameter stimulus on a white background (10 cd/m2, 200 ms duration)) was used to map the VF of each patient. Retinal locations with different visual sensitivities were chosen for AO-imaging.
Colour vision tests comprising American Optical Hardy-Rand-Rittler (AO-HRR) plates, Farnsworth D-15, Neitz anomaloscope and Cambridge Colour Test (CCT) were performed on eight of the 10 glaucoma patients. Two patients (no 8 and no 9) were unavailable for this testing.
Image analysis
OCT images
The UHR-FD-OCT and AO-UHR-FD-OCT images were optimised for image contrast and clarity by using a custom LabVIEW (National Instruments, Austin, Texas) program. Images were then registered using Image J software (National Institutes of Health) to minimise eye motion artefacts.
Measurement of inner segment and outer segment length
The best eight to ten AO-UHR-FD-OCT images from the same retinal location were registered and averaged to enhance contrast of the four stratified-outer-retinal-layers. These layers included the individual cones that are resolvable at both junctions between the cone inner segment (IS) and outer segment (OS), and between the cone OS and the retinal pigment epithelium (RPE). IS length (ISL), defined as the distance between the external limiting membrane (ELM) and the IS/OS junction of a single cell (‘dot’) positioned directly underneath the ELM, and the OS length (OSL), defined as the distance between two ‘dots’ that can be vertically paired at the junctions of IS/OS and OS/RPE representing a single cone photoreceptor, were measured at 10 different locations across the entire image in all patients. When the OS/RPE layer was absent at one of these 10 locations, the OSL was considered to be zero at that location in the image. The 10 ISL and OSL values from the same image were averaged and compared between retinal locations of varying visual sensitivity within the same eye. Additionally, the mean ISL and OSL values from retinal locations that are equidistant from the fovea (eg, 4.5° nasal vs 4.5° temporal vs 4.5° superior vs 4.5° inferior retina) were analysed for statistical significance by using either a t test or ANOVA. Those at different retinal eccentricities were not tested for statistical significance due to inherent structural differences that may be associated with retinal eccentricity (eg, 2° nasal vs 10° temporal retina).
AO-FC en face images
The best seven to eight AO-FC en face images were selected from each retinal location for registration and subsequent averaging to further improve image contrast using MATLAB (The Mathworks, Natick, Massachusetts) software.23
Cone identification/cone density measurement
Using further MATLAB software, the cone densities were calculated from the registered and averaged AO-FC en face images; the algorithm details are published elsewhere.23 Briefly, the user identifies and measures the dimmest and the brightest cones in each image as well as the shortest centre-to-centre spacing between adjacent cones. These values are then used as thresholds for selecting cones in the image. The algorithm only selects pixels that satisfy both of the following conditions:
the intensity lies between the minimum and maximum threshold values;
the spacing must exceed the shortest threshold.
If there are blood vessels in the image, their area is subtracted from the image before the cone density calculation. The accuracy of this algorithm has been tested using both simulated and real retinal images from normal subjects, and was found to be in 97.7% agreement with the simulated images and within one SE of Curcio's mean density for the real retinal images.23 The cone counts from our images were compared with the histology data24 at the corresponding retinal locations to calculate a relative cone density.
Results
Figure 1 shows UHR-FD-OCT, AO-FC and AO-UHR-FD-OCT images of the normal retinas at different retinal eccentricities. Figure 1A shows an UHR-FD-OCT image through the fovea with four well-defined-stratified outer retinal layers. The top layer represents the ELM (labelled ‘1’); the first bright line represents the IS/OS (labelled ‘2’); the second bright line represents the OS/RPE, or otherwise, named Verhoeff's membrane (labelled ‘3’); and the bottom bright band represents the RPE. Figure 1B shows AO-UHR-FD-OCT images with the same four well-defined outer retinal layers, but the IS/OS and OS/RPE layers are now bright ‘interrupted’ lines, as opposed to ‘solid’ lines. Each interruption seen in the IS/OS and OS/RPE layers represents a gap between adjacent cones. ISL and OSL are indicated with solid lines. Figure 1C shows AO-FC images of densely packed cone photoreceptors, with both their size and centre-to-centre spacing increasing with retinal eccentricity as expected.
Figure 1.
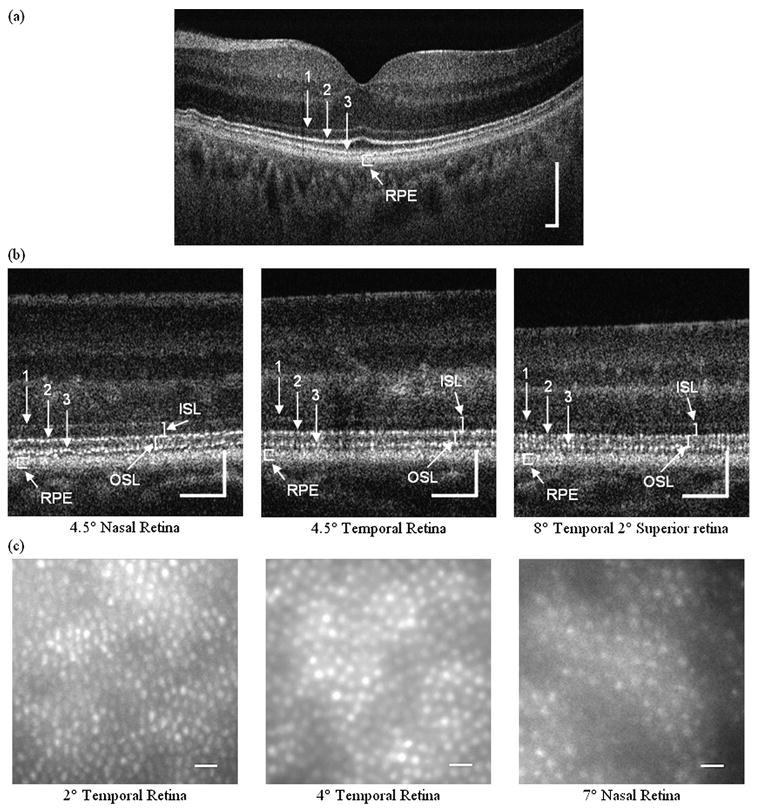
Ultrahigh-resolution retinal images from the three normal subjects. (A) An 18° field of view ultrahigh-resolution Fourier-domain optical coherence tomography (UHR-FD-OCT) image centred at the fovea (from 58 years-old normal subject): 1, external limiting membrane (ELM); 2, junction between inner and outer segments of cone photoreceptors (inner segment (IS)/outer segment (OS)); 3, Verhoeff's membrane (OS/retinal pigment epithelium (RPE)). Scale bar=200 μm. (B) Adaptive optics (AO) UHR-FD-OCT images taken at three different retinal locations (from a 35-year-old normal subject): 1, ELM; 2, IS/OS; 3, OS/RPE. Scale bar=100 μm. Inner segment length (ISL) and outer segment length (OSL) are shown with white solid lines. (C) AO-flood illuminated fundus camera en face images taken at three different retinal locations (from a 21-year-old normal subject). Scale bar=10 μm.
Figure 2 shows the UHR-FD-OCT images from four patients at various retinal locations. Two locations with different visual sensitivities (one with reduced visual sensitivity caused by glaucoma damage and the other with either normal or higher visual sensitivity) were chosen for comparison. The UHR-FD-OCT images were examined first to acquire a global view of the retina; then the AO-UHR-FD-OCT was used to obtain individual cellular level images over smaller areas. White dotted boxes represent retinal locations where the AO images were acquired, and the integrity of the four stratified-outer-retinal-layers was examined for each retinal location. When there was a characteristic glaucomatous VF loss, the OS/RPE layer from retinal locations with reduced visual sensitivity was either less distinct or completely absent, depending on the severity of the loss, while all other three layers, ELM, IS/OS and RPE, were clearly visible. Patient no 8 showed absence of the OS/RPE layer inside the white dotted box at 6° temporal 6° inferior retina (a location of glaucomatous VF loss), but outside the box (locations with higher visual sensitivity), the OS/RPE layer became distinct, implying that the integrity of cone photoreceptors is well maintained at those locations. At 4.5° temporal retina (with normal visual sensitivity), the OS/RPE layer was distinct. Patients no 9 and no 10 also showed the same results: that is, affected retinal locations (8° nasal 8° inferior retina for patient no 9 and 4.5° nasal 4.5° inferior retina and 4.5° temporal 4.5° inferior retina for patient no 10) showed either no or a less distinct OS/RPE layer, while those retinal locations with normal or higher visual sensitivity (4.5° nasal 4.5° inferior retina for patient no 9 and 4.5° superior retina for patient no 10) showed a more distinct OS/RPE layer. However, patient no 6, who had no glaucomatous VF loss (despite characteristic glaucomatous changes in the optic nerve head), showed four well-defined outer retinal layers, suggesting that the cones are well maintained.
Figure 2.
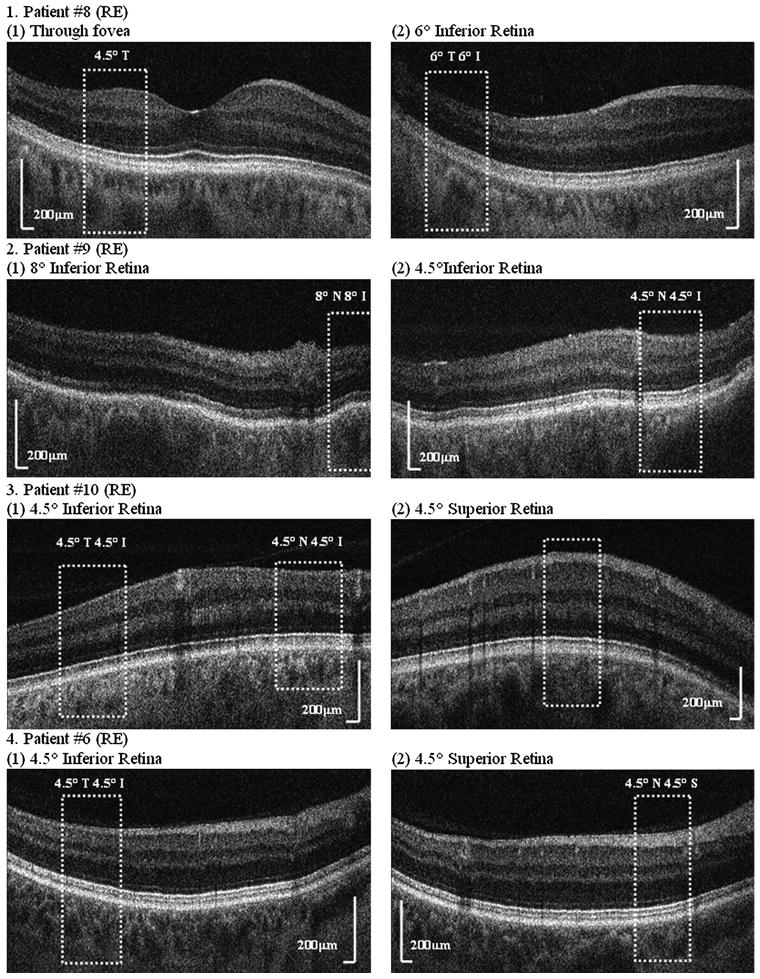
Ultrahigh-resolution Fourier-domain optical coherence tomography (UHR-FD-OCT) images from four glaucoma patients at various retinal locations; two locations with different visual sensitivity were chosen, one with reduced visual sensitivity and the other with either normal or higher visual sensitivity for comparison. Each white dotted box indicates the location where the adaptive optics UHR-FD-OCT image was acquired. I, inferior retina; N, nasal retina; S, superior retina; T, temporal retina.
Figure 3 shows AO images taken at several retinal locations with different visual sensitivity in one eye from all 10 glaucoma patients. Retinal locations chosen for AO imaging are numbered on the VF map. All patients with glaucomatous VF loss (ie, everyone except patient no 6) showed the same pattern of results, namely:
Figure 3.
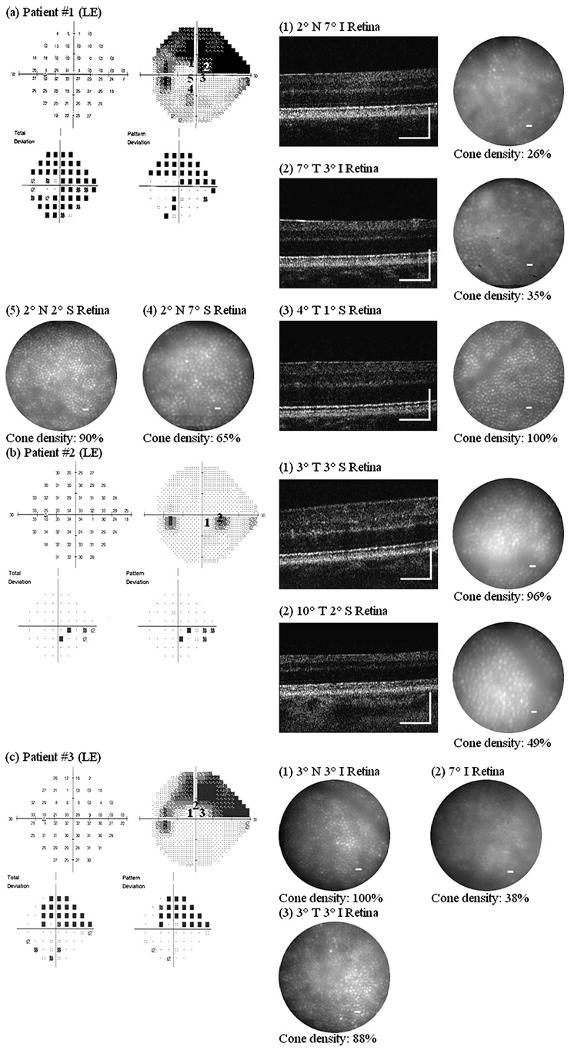
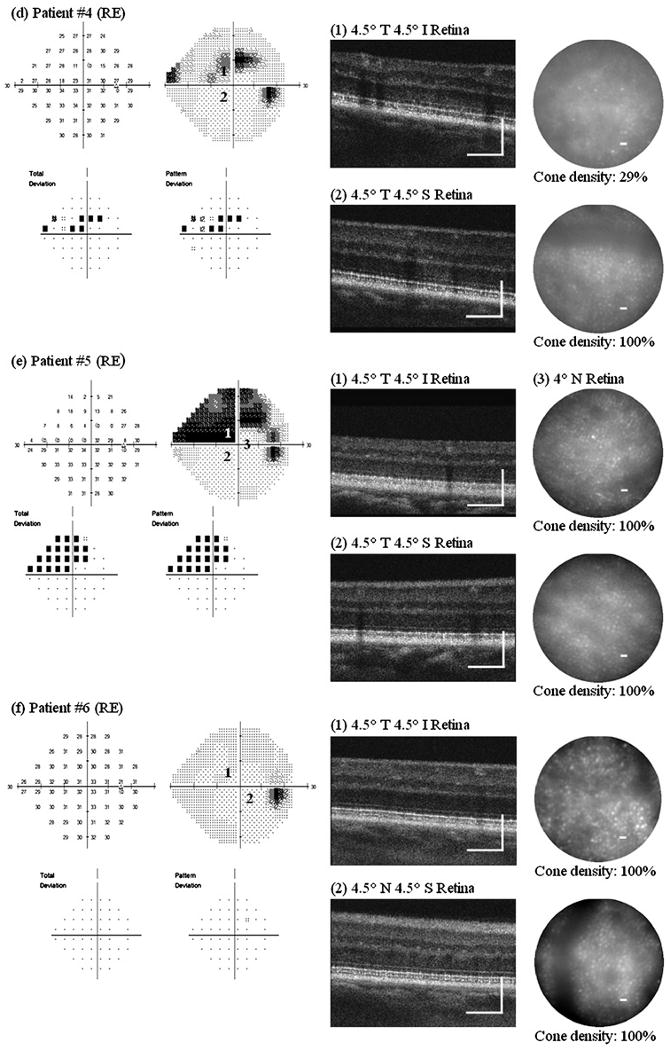
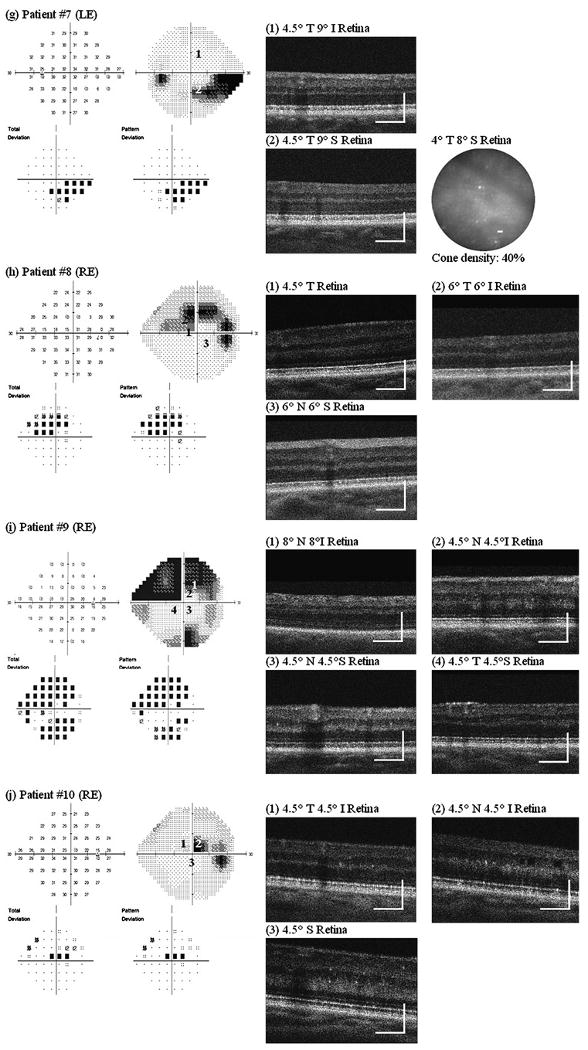
Adaptive optics (AO) ultrahigh-resolution Fourier-domain optical coherence tomography (UHR-FD-OCT) and AO-flood illuminated fundus camera (AO-FC) en face images from our 10 glaucoma patients. Retinal locations where AO images were acquired are registered to the visual-field maps by numbers. Cone density was calculated from each AO-FC en face image in relation to histology data at the corresponding retinal location. Scale bar=200 μm for AO-UHR-FD-OCT images and 10 μm for AO-FC en face images. I, inferior retina; LE, left eye; N, nasal retina; RE, right eye; S, superior retina; T, temporal retina.
-
In retinal locations that showed reduced visual sensitivity:
The AO-UHR-FD-OCT images revealed blurred, irregular, uneven and patchy OS/RPE layer, while all three other outer retinal layers, ELM, IS/OS and RPE, remained distinct. The greater the visual sensitivity loss, the more indistinct and uneven the OS/RPE layer.
The AO-FC en face images revealed dark areas in the mosaic where cones are not readily visible. These areas were more extensive at retinal locations with greater visual sensitivity loss. Cone density measurements ranged from 26% to 100% of the expected normal value, depending on the level of visual sensitivity.
-
In contrast, at retinal locations with normal visual sensitivity:
The AO-UHR-FD-OCT images revealed all four distinct, regular and even outer retinal layers with the IS/OS and the OS/RPE layers forming double ‘dotted’ lines, each dot on each layer representing an individual cone.
The AO-FC en face images revealed regularly packed cones with higher cell densities. The AO images along with the VF maps and the relative cone density measurements (compared with histological data from normal eyes24) for these nine patients are shown in figure 3A–E, G–J. We have demonstrated elsewhere19 that there is close agreement between cone densities in AO images and histological data from normal retina.
In our earlier study, we reported a series of optic neuropathy patients who showed changes in cones in conjunction with expected changes in the inner retina in the presence of permanent VF loss. However, if the VF loss was only transient or has not yet developed, the outer retinal layers were found to be unaffected.19 Patient no 6 is a similar case; despite some early signs of glaucomatous changes in the optic nerve head (see Supplement figure 1F), the VF had remained unaffected. Two retinal locations (4.5° temporal 4.5° inferior retina and 4.5° nasal 4.5° superior retina) were chosen for AO imaging. The AO-UHR-FD-OCT images showed all four distinct outer retinal layers along with healthy nerve fibre layer (NFL), and the AO-FC images showed regular and densely packed cones with normal densities at both retinal locations (figure 3F).
Two of our 10 patients (no 7 and no 10) showed evidence of tritan anomaly on the CCT. Some previous studies have reported abnormal blue yellow colour vision in glaucoma patients.9 10 It is yet to be determined if the observed changes in the cones in these patients are responsible for the tritan anomaly.
In addition to the consistent outer retinal changes described above, the AO-UHR-FD-OCT image from 4.5° nasal 4.5° inferior retina on patient no 10 also revealed several cystic changes in the inner nuclear layer (appears as dark holes; see image (2), figure 3J) which were not detected in the UHR-FD-OCT image.
The presence of overlying thick NFL and/or blood vessels obscured the image quality of underlying retinal layers, but when visual sensitivity was normal at that location, the OS/RPE layer was still visible and regular in appearance, although somewhat fainter.
After the observation of patchy and uneven position of the OS/RPE layer at the retinal locations with reduced visual sensitivity, both the ISL and OSL were measured from the AO-UHR-FD-OCT images and statistical comparisons made between retinal locations that are equidistant from the fovea within the same eye. Table 3 summarises the results from nine glaucoma patients. Patient no 3 was not available for imaging with our AO-UHR-FD-OCT system.
Table 3. Length of inner segment (IS) and outer segment (OS) of cone photoreceptors from both affected and unaffected parts of the retina in glaucoma patients.
| Subject | Segment | Retinal location (segment lengths in mm) | p Value | ||
|---|---|---|---|---|---|
| (a) Patient no 1 (LE) | (1) 2° N 7° I retina | (2) 7° T 3° I retina | (3) 4° T 1° S retina | ||
| IS | 35.59±0.81 | 35.67±1.12 | 37.18±1.04 | ||
| OS | 18.68±16.16 | 11.02 ±14.34 | 36.52 ±1.24 | ||
| (b) Patient no 2 (LE) | (1) 3° T 3° S retina | (2) 10° T 2° S retina | |||
| IS | 34.88±1.44 | 34.48±1.44 | |||
| OS | 36.05±1.68 | 32.08±2.15 | |||
| (c) Patient no 4 (RE) | (1) 4.5° T 4.5° I retina | (2) 4.5° T 4.5° S retina | |||
| IS | 38.91±0.86 | 39.13±0.98 | 0.6 | ||
| OS | 29.25±1.76 | 35.44±1.26 | 0.0001 | ||
| (d) Patient no 5 (RE) | (1) 4.5° T 4.5° I retina | (2) 4.5° T 4.5° S retina | |||
| IS | 35.26 ±0.70 | 35.77 ±1.23 | 0.27 | ||
| OS | 6.16 ±12.99 | 34.95 ±2.48 | 0.0001 | ||
| (e) Patient no 6 (RE) | (1) 4.5° T 4.5° I retina | (2) 4.5° N 4.5° S retina | |||
| IS | 35.95±0.78 | 35.41±0.65 | 0.11 | ||
| OS | 31.72±1.50 | 31.07±1.23 | 0.31 | ||
| (f) Patient no 7 (LE) | (1) 4.5° T 9° I retina | (2) 4.5° T 9° S retina | |||
| IS | 36.79±1.23 | 37.53±0.59 | 0.11 | ||
| OS | 24.91±1.15 | 21.39±5.02 | 0.04 | ||
| (g) Patient no 8 (RE) | (1) 4.5° T retina | (2) 6° T 6° I retina | (3) 6° N 6° S retina | ||
| IS | 41.41±1.19 | 35.72±0.80* | 36.15±0.96* | 0.30* | |
| OS | 39.86±1.75 | 8.41±17.73* | 25.87±1.67* | 0.006* | |
| (h) Patient no 9 (RE) | (1) 8° N 8°I retina | (2) 4.5° N 4.5° I retina | (3) 4.5° N 4.5° S retina | ||
| IS | 35.08±0.97 | 34.66±1.05* † | 34.59±1.32* ‡ | 0.89* | |
| OS | 0±0 | 31.15±1.13* † | 32.28±0.80* ‡ | 0.019* | |
| (4) 4.5° T 4.5° S retina | |||||
| IS | 34.88±0.98† ‡ | 0.64† | |||
| 0.58‡ | |||||
| OS | 32.45±0.83 † ‡ | 0.009† | |||
| 0.65‡ | |||||
| (i) Patient no 10 (RE) | (1) 4.5° T 4.5° I retina | (2) 4.5° N 4.5° I retina | (3) 4.5° S retina | ||
| IS | 37.06±1.01* † | 36.54±1.12* ‡ | 37.20±0.86‡ † | 0.29* | |
| 0.15‡ | |||||
| 0.74† | |||||
| OS | 29.48±11.37* † | 13.68±17.80* ‡ | 41.90±0.91‡ † | 0.03* | |
| 0.0001‡ | |||||
| 0.003† | |||||
p Values marked with *, †, ‡ correspond to comparisons that are labelled with the same symbols. Affected retinal locations are shown in bold.
LE, left eye; RE, right eye.
All nine patients showed the same trend of results:
A small variation in ISL across the retina regardless of the level of visual sensitivity, ranging from 34.48 to 41.41 μm;
Significant shortening of the OSL with a decrease in visual sensitivity, ranging from 0 to 41.90 μm;
A large variation in OSL at the locations with reduced visual sensitivity (ie, large SD), implying a significant variation in shortening of the cone OS, for example, 8.41±17.73 μm at 6° temporal 6° inferior retina for patient no 8;
Uniform ISL within one retinal location (ie, smaller SD) regardless of visual sensitivity, implying the IS were unaffected by the disease process at that location.
Patient no 6, who maintained a normal VF, showed no statistically significant difference in ISL and OSL between the two retinal locations imaged (p values of 0.11 and 0.31 respectively). Patient no 9 also showed the same insignificant results for the comparison between retinal locations with normal visual sensitivity (4.5° temporal 4.5°superior retina vs 4.5° nasal 4.5°superior retina)—p values of 0.58 and 0.65 for ISL and OSL respectively.
Discussion
The results show structural changes in cone photoreceptors in eyes with glaucomatous damage in vivo. Prior studies have suggested that glaucoma may cause abnormalities of the outer retina,5–13 but these results have been met with skepticism.25 26 Histological studies have shown loss and injury of photoreceptors in glaucoma,6 7 and other studies have inferred outer retinal layer changes based on colour vision tests8 9 and electro-physiology.10–13 Animal studies based on rats and mice showed a reduction in photoreceptoral responses after IOP insult, but its recovery was much faster than that of inner retina, suggesting the inner retina is more vulnerable to injury.27–29 However, none have permitted direct assessment of structural integrity of individual photoreceptors.
The patients presented here represent a wide range of glaucomatous conditions, from preperimetric disease to advanced glaucomatous optic neuropathy with corresponding VF defects. All patients had glaucoma for several years prior to imaging, presenting initially with elevated IOP and glaucomatous optic neuropathy. Nine of 10 patients had reproducible VF defects and thinning of the NFL that corresponded to optic nerve changes. Patient no 6, an OHTS participant, developed a glaucomatous endpoint as determined by that study's masked optic disc reading centre with repeat photographs over time. Attribution to POAG was confirmed by the masked endpoint committee. This individual did not have any detectable VF defects at the evaluation for the present study and is considered to have ‘preperimetric’ glaucomatous damage.
All three modalities revealed consistent structural changes in cone photoreceptors at the retinal locations where visual sensitivity was compromised. The AO-UHR-FD-OCT images showed shortening of the cone OS with an increase in glaucomatous damage, which could explain the dark areas in the AO-FC images and indistinct OS/RPE layer in the UHR-FD-OCT images. As the OS shortens and/or swells, it may cause loss of waveguide properties due to changes in the refractive index inside the cones and/or disarray of packing organisation as the supporting structure to the cone OS becomes weaker. We suspect a similar abnormal angular tuning of cone photoreceptors observed in patients with other optic neuropathies19 is also occurring in glaucoma patients.
This study is the first to utilise both AO-FC and AO-UHR-FD-OCT systems to view cone photoreceptors from two different angles in vivo in well-documented glaucoma patients, and to compare regions of normal and depressed visual sensitivity. The ability to image different cellular structures in the retina in living eyes has the potential to provide a new approach to the diagnosis and monitoring of glaucomatous damage.
Supplementary Material
Acknowledgments
The authors thank S Garcia for assistance in testing patients.
Funding This research was supported by the National Eye Institute (EY014743) and an RPB Senior Scientist Award.
Footnotes
Competing interests None.
Patient consent Obtained.
Ethics approval Ethics approval was provided by the School of Medicine, University of California, Davis, USA.
Provenance and peer review Not commissioned; externally peer reviewed.
References
- 1.Quigley HA. Number of people with glaucoma worldwide. Br J Ophthalmol. 1996;80:389–93. doi: 10.1136/bjo.80.5.389. [DOI] [PMC free article] [PubMed] [Google Scholar]
- 2.Quigley HA, Nickells RW, Kerrigan LA, et al. Retinal ganglion cell death in experimental glaucoma and after axotomy occurs by apoptosis. Invest Ophthalmol Vis Sci. 1995;36:774–86. [PubMed] [Google Scholar]
- 3.Hayreh SS. Blood supply of the optic nerve head and its role in optic atrophy, glaucoma and oedema of the optic disc. Br J Ophthalmol. 1969;53:721–48. doi: 10.1136/bjo.53.11.721. [DOI] [PMC free article] [PubMed] [Google Scholar]
- 4.Quigley HA, Green WR. The histology of human glaucoma cupping and nerve damage: clinicopathologic correlation in 21 eyes. Ophthalmology. 1979;10:1803–27. doi: 10.1016/s0161-6420(79)35338-6. [DOI] [PubMed] [Google Scholar]
- 5.Panda S, Jonas JB. Decreased photoreceptor count in human eyes with secondary angular-closure glaucoma. Invest Ophthalmol Vis Sci. 1992;33:2532–6. [PubMed] [Google Scholar]
- 6.Nork TM, Ver Hoeve JN, Poulsen GL, et al. Swelling and loss of photoreceptors in chronic human and experimental glaucomas. Arch Ophthalmology. 2000;118:235–45. doi: 10.1001/archopht.118.2.235. [DOI] [PubMed] [Google Scholar]
- 7.Büchi ER. Cell death in the rat retina after a pressure induced ischemia-reperfusion insult: an electron microscopic study, II: outer nuclear layer. Jpn J Ophthalmol. 1992;36:62–8. [PubMed] [Google Scholar]
- 8.Pokorny J, Smith VC. Eye disease and color defects. Vision Res. 1986;26:1573–84. doi: 10.1016/0042-6989(86)90176-8. [DOI] [PubMed] [Google Scholar]
- 9.Poinoosawmy D, Nagasubramanian S, Gloster J. Color vision in patients with chronic simple glaucoma and ocular hypertension. Br J Ophthalmol. 1980;64:852–7. doi: 10.1136/bjo.64.11.852. [DOI] [PMC free article] [PubMed] [Google Scholar]
- 10.Fazio DT, Heckenlively JR, Martin DA, et al. The electroretinogram in advanced open angle glaucoma. Doc Ophthalmol. 1986;63:45–54. doi: 10.1007/BF00153011. [DOI] [PubMed] [Google Scholar]
- 11.Vaegan, Graham SL, Goldberg I, et al. Flash and pattern electroretinogram changes with optic atrophy and glaucoma. Exp Eye Res. 1995;60:697–706. doi: 10.1016/s0014-4835(05)80011-9. [DOI] [PubMed] [Google Scholar]
- 12.Odom JV, Feghali JG, Jin JC, et al. Visual function deficits in glaucoma: electroretinogram pattern and luminance nonlinearities. Arch Ophthalmol. 1990;108:222–7. doi: 10.1001/archopht.1990.01070040074034. [DOI] [PubMed] [Google Scholar]
- 13.Holopigian K, Seiple W, Mayron C, et al. Electrophysiological and psychophysical flicker sensitivity in patients with primary open-angle glaucoma and ocular hypertension. Invest Ophthalmol Vis Sci. 1990;31:1863–8. [PubMed] [Google Scholar]
- 14.Roorda A, Romero-Borja F, Donnelly WJ, et al. Adaptive optics scanning laser ophthalmoscopy. Opt Express. 2002;10:405–12. doi: 10.1364/oe.10.000405. [DOI] [PubMed] [Google Scholar]
- 15.Zawadzki RJ, Choi SS, Fuller AF, et al. Cellular resolution volumetric in vivo retinal imaging with adaptive optics–optical coherence tomography. Optics Express. 2009;17:4084–409. doi: 10.1364/oe.17.004084. [DOI] [PMC free article] [PubMed] [Google Scholar]
- 16.Zhang Y, Cense B, Rha J, et al. High-speed volumetric imaging of cone photoreceptors with adaptive optics spectral domain optical coherence tomography. Opt Express. 2006;14:4380–94. doi: 10.1364/OE.14.004380. [DOI] [PMC free article] [PubMed] [Google Scholar]
- 17.Pircher M, Zawadzki RJ, Evans JW, et al. Simultaneous imaging of human cone mosaic with adaptive optics enhanced scanning laser ophthalmoscopy and high-speed transversal scanning optical coherence tomography. Opt Lett. 2008;33:22–4. doi: 10.1364/ol.33.000022. [DOI] [PMC free article] [PubMed] [Google Scholar]
- 18.Choi SS, Doble N, Hardy JL, et al. In-vivo imaging of the photoreceptor mosaic in retinal dystrophies and correlations with retinal function. Invest Ophthalmol Vis Sci. 2006;47:2080–92. doi: 10.1167/iovs.05-0997. [DOI] [PMC free article] [PubMed] [Google Scholar]
- 19.Choi SS, Zawadzki RJ, Keltner JL, et al. Changes in cellular structures revealed by ultra-high resolution retinal imaging in optic neuropathies. Invest Ophthalmol Vis Sci. 2008;49:2103–19. doi: 10.1167/iovs.07-0980. [DOI] [PMC free article] [PubMed] [Google Scholar]
- 20.Gordon MO, Kass MA. The ocular hypertension treatment study: design and baseline description of the participants. Arch Ophthalmol. 1999;117:573–83. doi: 10.1001/archopht.117.5.573. [DOI] [PubMed] [Google Scholar]
- 21.Kass MA, Heuer DK, Higginbotham EJ, et al. The ocular hypertension treatment study: a randomized trial determines that topical ocular hypertensive medication delays or prevents the onset of primary open-angle glaucoma. Arch Ophthalmol. 2002;120:701–13. doi: 10.1001/archopht.120.6.701. [DOI] [PubMed] [Google Scholar]
- 22.Alam S, Zawadzki RJ, Choi SS, et al. Clinical application of rapid serial Fourier domain optical coherence tomography for macular imaging. Ophthalmology. 2006;113:1425–31. doi: 10.1016/j.ophtha.2006.03.020. [DOI] [PMC free article] [PubMed] [Google Scholar]
- 23.Xue B, Choi SS, Doble N, et al. Photoreceptor counting and image montaging of en face retinal images from an adaptive optics fundus camera. J Opt Soc Am A. 2007;24:1364–72. doi: 10.1364/josaa.24.001364. [DOI] [PMC free article] [PubMed] [Google Scholar]
- 24.Curcio CA, Sloan KR, Kalina RE, et al. Human photoreceptor topography. J Comp Neurol. 1990;292:497–523. doi: 10.1002/cne.902920402. [DOI] [PubMed] [Google Scholar]
- 25.Kendell KR, Quigley HA, Kerrigan LA, et al. Primary open-angle glaucoma is not associated with photoreceptor loss. Invest Ophthalmol Vis Sci. 1995;36:200–05. [PubMed] [Google Scholar]
- 26.Wygnanski T, Desarnik H, Quigley HA, et al. Comparison of ganglion cell loss and cone loss in experimental glaucoma. Am J Ophthalmol. 1995;120:184–9. doi: 10.1016/s0002-9394(14)72606-6. [DOI] [PubMed] [Google Scholar]
- 27.Sun D, Bui BV, Vingrys AJ, et al. Alterations in photoreceptor-bipolar cell signaling following ischemia/reperfusion in the rat retina. J Comp Neurol. 2007;505:131–46. doi: 10.1002/cne.21470. [DOI] [PubMed] [Google Scholar]
- 28.Kong YX, Crowston JG, Vingrys AJ, et al. Functional changes in the retina during and after acute intraocular pressure elevation in mice. Invest Ophthalmol Vis Sci. 2009;50:5732–40. doi: 10.1167/iovs.09-3814. [DOI] [PubMed] [Google Scholar]
- 29.He Z, Bui BV, Vingrys AJ. The rate of functional recovery from acute IOP elevation. Invest Ophthalmol Vis Sci. 2006;47:4872–80. doi: 10.1167/iovs.06-0590. [DOI] [PubMed] [Google Scholar]
Associated Data
This section collects any data citations, data availability statements, or supplementary materials included in this article.