

Abstract
Multicellular organisms, from Caenorhabditis elegans to humans, have roughly the same number of protein encoding genes. We show that the need to prevent disease-causing nonspecific interactions between proteins provides a simple physical reason why organism complexity is not reflected in the number of distinct proteins. By collective evolution of the amino acid sequences of protein binding interfaces we estimate the degree of misbinding as a function of the number of distinct proteins. Protein interaction energies are calculated with an empirical, residue-specific energy function tuned for protein binding. We show that the achievable energy gap favoring specific over nonspecific binding decreases with protein number in a power-law fashion. From the fraction of proteins involved in nonspecific complexes as a function of increasing protein number and decreasing energy gap, we predict the limits these binding requirements place on the number of different proteins that can function effectively in a given cellular compartment. Remarkably, the optimization of binding interfaces favors networks in which a few proteins have many partners, and most proteins have few partners, consistent with a scale-free network topology. We conclude that nonspecific binding adds to the evolutionary pressure to develop scale-free protein–protein interaction networks.
Keywords: protein–protein binding, proteome size, interactome, contact potentials, Hamming bound
The number of proteins encoded by the genomes of humans and the nematode Caenorhabditis elegans is remarkably similar, ∼20,000 each (1), with comparable numbers for other eukaryotes (2). Large differences in organism complexity are thus reflected far less in proteome size than in gene regulatory networks (3), the degree of compartmentalization (4), the variety of distinct cell types (2), and alternative splicing (5). In this work, we provide a physical explanation for the absence of an increase in protein diversity from simple multicellular organisms to humans. Our approach seeks to capture the fundamental aspects of protein interactions conserved in any functioning cell, namely high binding specificity and minimal aggregation as the proteins participate in a network of binding interactions.
The networks of protein–protein interactions, or interactomes (6–9), although distinctive to their individual organisms, manifest global and local characteristics that are shared across species (10, 11). Most notably, the organization of these networks exhibits a scale-free topology (10, 12) with a substantial number of highly connected hub proteins (13). Based on structural (14) and temporal (15) information, the hub proteins can be classified as date hubs or party hubs. In a date hub, multiple binding partners compete for binding to a single interface, where binding to one partner excludes simultaneous binding to any of the others. In a party hub, a protein has multiple binding interfaces that are accessible independent of each other, such that binding is not competitive. Collectively, these network features are relevant functionally by creating robust, modular interactomes (15, 16) and physically by determining the number of proteins that can operate efficiently in a cell, as shown below.
Proper protein function requires not only binding to specific targets, as captured in the interaction networks, but also avoidance of disease-causing nonfunctional interactions (17) and nonspecific aggregation (18) in the crowded cellular environment. The failure of a protein to maintain a strong specificity for its functional partners relative to other proteins can result in a variety of disease states. For the prion protein PrP, the erroneous relocation of this protein from the membrane into the cytosol allows it to bind to a cytosolic ubiquitin ligase, thus depleting the free ligase from solution, diminishing its ability to complete required tasks and contributing to neurodegeneration (17). Related challenges arise in the maturation of the immune system, where unsuppressed binding to “self” is associated with autoimmune reactions (19). Here we employ a simple physical model to predict how the evolutionary pressure to minimize nonfunctional protein–protein interactions (20, 21) limits the diversity of proteins and shapes their interaction networks. We explore these effects first in simple models of protein binding networks and then in a network fragment from yeast (14).
Model Development
Our model is designed to reproduce the competition between specific and nonspecific protein binding in a cell and incorporates both physicochemical information on protein interactions and systems-level information on their interactomes. As illustrated schematically in Fig. 1 for four protein binding interfaces that are part of a larger set of N = 200 interfaces, we first define a target network of specific protein–protein interactions. In Fig. 1 each protein has one specific binding target, creating a network topology with pairs of protein binding partners. Mimicking an evolutionary process, we then optimize the sequences of the binding interfaces to maximize the specific interactions of the network while suppressing all other interactions as much as possible. For each protein interface in the network, this sequence optimization produces two sets of binding energies, one for specific interactions (i.e., with target partners in the network) and another for nonspecific interactions (with all other interfaces).
Fig. 1.

Schematic of the sequence optimization formalism, illustrated for a Pairs interaction network. (Top Left) The initial random sequences of four protein interfaces are part of a larger set of N = 200 interfaces. In the figure, specific partners are lined up horizontally and bind as in a book to be closed. Hydrophobic residues are colored blue, polar residues are red, and positively and negatively charged residues are colored yellow and orange, respectively. The two specific interaction energies E12 and E34 are shown in black (in units of kBT), and all the nonspecific ones in red (including those for self-binding, as indicated by circular arrows). Each protein is labeled from 1 to 4 (pink and green circles), and these labels are maintained in the other panels. (Top Right) After sequence optimization, the specific binding energies are more negative, and the gap to the nonspecific interactions has widened. (Bottom Right) From the binding energies, pairwise dissociation constants (in units of nM) are calculated for the two specific (black) and the eight nonspecific complexes (red). (Bottom Left) From the dissociation constants, and for total concentrations of 100 nM of each of the proteins, equilibrium concentrations (in nM) are calculated for all complexes and the free proteins.
As a simple physical measure of the achieved specificity in the network, we will use the minimum-energy gap ΔE between the specific and nonspecific binding energies for the different interfaces. An analogous gap between “ground states” and “first excited states” was previously used in studies of a related problem, the stability of proteins with respect to mutations as a function of their size (22). Here, large energy gaps indicate strong suppression of nonspecific interactions. From the binding energies, we determine the N2 dissociation constants for both specific and nonspecific complexes. For given total protein concentrations, the dissociation constants in turn determine the absolute concentrations of specific and nonspecific complexes (see Methods and Figs. S1 and S2). The amount of proteins in nonspecific complexes then provides an additional measure for the achieved specificity in the network. The number of nonspecific complexes present at equilibrium depends on the full distribution of nonspecific interactions and therefore represents a global measure of the competitiveness of the cell or cellular compartment. We also tested Z scores as an alternative statistical measure (SI Text). Here the discriminatory power of Z scores is relatively low because of the large number of weak nonspecific interactions. We are most interested in the competitive nonspecific protein binding that might interfere with functional interactions and, therefore, we focus on the minimum energy gap and the number of nonspecific complexes formed at equilibrium.
Each of the N interfaces in a given protein interaction network is represented by L = 25 amino acids, arranged on a 5 × 5 grid, a typical size for protein–protein binding interfaces (23). The proteins bind to one another specifically with a given orientation (perfect overlap). Binding with rotated or translated interfaces is thus considered nonspecific in all cases, even if it may be functional in some (24). To maintain a functional state, the binding affinity must be stronger for specific functional interactions than the most-competitive nonspecific interactions. We use Monte Carlo (MC) optimization to select interface sequences that collectively achieve strong, low-energy interactions between specific binding partners, and weak, high-energy interactions with all other interfaces in the network (see Methods and SI Text). To calculate interaction energies, we use the experimentally derived Miyazawa–Jernigan (MJ) contact potentials, tuned for protein binding (25, 26). Previous studies of immune recognition used similar energy functions and selection strategies (19, 27). In the optimization, we require the overall amino acid composition to be consistent with experimental observation (28) (see Methods). We assume that our cell operates near ambient temperature and do not consider variations in temperature.
Results and Discussion
Binding Energy Gap in Simple Network Topologies.
The simplest measure of the competitiveness of a particular set of sequences is the minimum-energy gap separating the weakest specific interaction from the most-competitive nonspecific interaction. First, we investigate the decrease in the gap for simple protein–protein interaction networks comprised of the basic building blocks of pairs, simple date hubs, and chains (Fig. 2A) where each protein has only a single binding interface. For optimized binding interfaces in these networks, we find that the minimum-energy gap ΔE decreases in a power-law fashion with the number N of protein interfaces, ΔE ∼ N-γ (Fig. 2B). The power-law dependence is conserved even for the complex topology of a yeast protein interaction network fragment (14) (Fig. 3D) and for networks optimized with alternative energy functions (29, 30). A power-law decrease was also found in lattice-model calculations of the energy gaps separating the native and the most-competitive nonnative structures of proteins as a function of their length, reflecting a similar increase in the combinatorial possibilities for nonspecific interactions (22).
Fig. 2.

Specific and nonspecific binding of proteins in simple interaction networks. (A) Basic topological units of the protein–protein interaction networks. Orange and green circles represent shared and unshared interfaces, respectively, and black lines indicate specific binding. The units are replicated to create networks, as illustrated in the oval for a Pairs and Threes network with N = 20 proteins. (B) Minimum-energy gap ΔE for networks of N proteins. Optimal gaps (symbols as in A) were found by MC optimization of interfaces with L = 25 amino acids. The gray dashed line is the Hamming bound of the binary model, scaled by an arbitrary factor 2/3 for comparison. Solid lines are power-law fits, with scaling exponents γ = 0.13 for the Pairs topology, 0.13 for Pairs and Threes in a 1∶1 ratio, 0.14 for Threes, 0.14 for Fives, and 0.19 for Chains. We also optimized the Pairs topology with different contact potentials. For the Betancourt–Thirumalai (30) and Skolnick et al. (29) potentials, we obtained γ = 0.12 and 0.13, respectively. (C) Concentration of proteins bound in nonspecific complexes, normalized by the concentration bound in specific complexes and free in solution. Individual protein concentrations are set at 100 nM each. With fixed total protein concentration the results are similar (SI Text and Fig. S5). Data are averaged over the two configurations of protein sequences with the largest minimum-energy gaps. (D) Hamming bound (34) on the minimum gap for N binary sequences of length L. For comparison, the gap of the Pairs network in B and the corresponding power law are shown as red symbols and line, multiplied by an arbitrary factor of 1.65.
Fig. 3.

Fragment of yeast protein–protein interaction network. (A) Component of the yeast interactome (14) with all unique binding interfaces explicitly indicated. The shared interfaces on each light green protein are shown in orange, and the unshared interfaces are in dark green. The separate small graph shows the largest connected component. (B) Modified network with one unshared (dark green) interface removed from each available protein in A. The edge is then reconnected to the same protein by a remaining interface such that the protein–protein interaction network is unchanged (in contrast to the interface network). By reducing the number of interfaces from 52 to 40, this procedure decreases the combinatorial number of possible nonspecific interactions, but creates 12 new shared interfaces. In B the edges are reconnected specifically to avoid chains of interactions, creating a minimally connected network. For this network, the reduction in interfaces outweighs the introduction of new shared interfaces and the minimum-energy gap is higher than in the original network. (C) Modified network with number of interfaces reduced to 40, as in B, but with edges reconnected to maximize the creation of chains of interactions. This procedure results in a highly connected component (smaller graph) that constrains the sequences in the optimization and results in a smaller energy gap than either in A or in B. (D) Minimum-energy gap (green, left scale) and concentration of nonspecific complexes normalized by the sum of specific and free protein concentrations (blue, right scale), as a function of the number N of proteins (bottom scale) and binding interfaces (top scale). Individual protein concentrations are set at 100 nM. Interactomes in A were replicated and connected by added interfaces indicated by black arrows. The scaling exponent of the minimum-energy gap is γ = 0.29.
The scaling exponent γ determines how quickly the energy gap decreases to zero as the number of interfaces increases, and correspondingly how quickly binding specificity is lost. Although the exponents in Fig. 2B are small, ranging from 0.13 to 0.19, the gap reduction is significant for typical proteome sizes. Even for the simplest “Pairs” network topology in Fig. 2 A and B, increasing the number of distinct interfaces to ∼10,000 (by extrapolating the power-law fit) would reduce the gap to only ∼5 kBT. For the slightly more complex “Chains” topology, the same number of interfaces would result in an even smaller gap of ∼2.5 kBT, leading to significant protein misbinding. For the more realistic yeast network fragment discussed below, a similarly small gap is already reached with ∼1,000 interfaces (Fig. 3D).
To provide a theoretical justification for the observed power-law scaling and to quantify the scaling exponent γ, we consider the simplest binding network model, with only two types of residues in perfectly aligned interfaces of size L. In this binary model, we define the energy of interaction between two sequences as Eij = -L + Δ, where Δ is the Hamming distance, i.e., the number of nonidentical residues in sequences i and j. As a result, pairs of specific binding partners have identical sequences, with a Hamming distance of zero and therefore the lowest possible (strongest) binding energy, with self-binding not considered here. For the Pairs network (Fig. 2A), in which each protein has exactly one specific partner, the optimization problem for the binary model is identical to choosing N/2 points on an L-dimensional hypercube of 2L points, such that the N/2 points are mutually as far apart as possible. In effect, each pair of proteins repels all other protein pairs. In this binary model, the minimum-energy gap ΔE corresponds to the Hamming distance of the two closest protein pairs and has an upper bound given by the Hamming bound (Fig. 2D). This bound scales with the number of proteins as Δ = ΔE ∼ N-γ (SI Text), and we show analytically that the scaling exponent γ decreases with the size of the protein interfaces as 1/L. Hence with larger interfaces, the gap is shifted to larger values and drops off slightly more slowly. Although one may expect the full 20-residue model to have weaker scaling compared to the binary model of the same length, the scaling exponents are in fact quite similar between the binary and full models for the Pairs network (Fig. 2 B and D). This similarity reflects degeneracies of the 20 amino acid interaction matrix (31) that reduce its effective dimensionality, and the added competition from shifted and rotated nonspecific binding in the full model.
Effects of Interaction Network Topology.
Building on this quantitative understanding of the Pairs network, we can now characterize the change in the magnitude and scaling of the energy gap ΔE with variations in the topology of the interaction network. We find that the topology of the protein interaction network can greatly influence the degree of nonspecific binding. In the date-hub topologies “Threes” and “Fives” (Fig. 2B), in which each central protein (or interface) has multiple binding partners, the gap ΔE is smaller than with only pairwise binding. With a smaller gap, the competition for binding from nonspecific interfaces is stronger, and as a consequence the concentration of nonspecific complexes is larger (Fig. 2C). Decreases in the minimum gap are generally accompanied by a shift in the distribution of nonspecific energies to lower values.
Binding to multiple partners increases the complexity of the sequence optimization problem because hub interfaces must attract several distinct specific binding partners that in turn have to repel one another. The resulting competition explains the smaller gap ΔE in the date-hub topologies. Remarkably, though, the scaling exponents for networks with isolated date hubs (Threes and Fives) are nearly identical to that of the Pairs network (Fig. 2B). In contrast, for a chain of interacting interfaces the gap drops more strongly with protein number N, resulting in a larger scaling exponent. To understand these changes in the scaling exponent, we use the result for the binary model (SI Text), where a larger scaling exponent occurs when the sequence length L is reduced (Fig. 2D) and therefore fewer sequences exist to select from. Here, a similar contraction of the effectively available sequence space is responsible, as explained below.
The scaling exponent γ of the energy gap reflects the complexity of optimizing sequences for a given interaction network topology. For the shared interfaces in the date-hub topologies Threes and Fives (Fig. 2A), the sequences of the binding partners tend to be similar, as might be expected if gene duplication is a means of evolving new partners for date hubs (10). These highly similar interfaces will thus all be attracted to the same hub interface, while being repulsive to each other by the requirement of no self-binding. As a result, the sequence options are not significantly constrained compared to the Pairs network. For a shared interface in a chain topology, however, the sequences of its binding partners must be distinct. Otherwise, the next specific binding partner in the chain would be attractive to both these partners, including the nonspecific one. This competition in chains of date hubs results in frustration effects that significantly restrict the sequence selection and thereby contract the available sequence space.
Yeast Protein–Protein Interaction Network.
Thus far we have characterized model interaction networks comprised of the basic topological elements of pairs, simple date hubs, and chains with a 1∶1 ratio of interfaces to proteins. We will now use the understanding derived from these elementary networks to study a realistic, more complex network fragment of the yeast interactome (14). As a major extension, we have to distinguish between binding interfaces and the proteins to which they belong. A protein can have an interface that is shared between multiple partners to form a date hub. Alternatively, a protein can have multiple interfaces that form a party hub. Consequently, the network of protein–protein interactions is only a reduced representation of the more complex network of binding interface interactions (Fig. 3A). As shown in Fig. 3D, and discussed above, duplicated yeast networks also exhibit power-law scaling of the energy gap with both the number of proteins and interfaces, albeit with a larger exponent of γ = 0.29 that reflects the greater network complexity.
We can use the yeast network fragment to explore whether nonspecific binding also exerts pressure on the topology of the protein–protein interaction network. To address this question, we modify the interface–interface interaction network in ways that do not change the underlying protein–protein interaction network, but do change the number of interfaces and their connectivity. Specifically, we alter the interface network to reduce the number of interfaces and minimize the number of chains by creating date hubs (Fig. 3B). For comparison, we also construct a network that similarly reduces the number of interfaces, but maximizes the formation of chains (Fig. 3C). By comparing the effects of these changes on the binding energy gap, we gain insight into the effects of interface network topology on the degree of protein misbinding.
After optimization, the maximally connected network in Fig. 3C with its date-hub chains produces the smallest ΔE and correspondingly the worst specificity, despite having only two-thirds as many ways to bind nonspecifically (Fig. S3). In contrast, the network with the smallest numbers of chains and interfaces (Fig. 3B) has the largest ΔE. These findings reinforce the poor specificity of the chain topology observed in Fig. 2B and suggest that introducing a new interface on a protein by creating a party hub is overall less costly than sharing an interface in a date-hub chain, despite the larger number of interfaces requiring optimization.
A striking aspect of the yeast interactome fragment in Fig. 3A is the large number of unique interfaces distributed among the proteins. This high ratio of interfaces to proteins reflects both the functional need to maintain a connected set of protein interactions and the physical need to maintain specificity in binding. Our results indicate that these requirements favor the evolution of two major topologies: date hubs and party hubs. Date hubs can improve the specificity of a network by reducing the number of distinct interfaces used between proteins, as long as two date hubs do not bind directly to one another [and, in fact, highly connected date hubs in experimental networks rarely interact directly with each other (12)]. Indeed, the minimally connected network in Fig. 3B has more date hubs and a larger ΔE (higher specificity) than that in Fig. 3A thanks to a reduction in the net number of interfaces. Without changing the network topology at the protein–protein level, unfavorable chains of connected date hubs can be separated through the creation of party hubs, in which additional unshared interfaces take over connections from shared interfaces. Correspondingly, the network in Fig. 3A with fewer chains has a larger ΔE than the maximally connected network in Fig. 3C. Hence the pressure to minimize nonspecific binding supports the formation both of party hubs, which are often functionally essential for forming large multiprotein complexes, and of date hubs, which are often needed to perform the same action on multiple proteins (such as protein kinases) (14).
Chains of date hubs are not only the least favorable topology for binding specificity, but they produce exactly the reverse of a scale-free distribution of the number of connections: many shared interfaces and few unshared interfaces. In contrast, both date hubs and party hubs (by replacing a shared interface with two unshared interfaces) are favorable for binding specificity and result in a high number of singly connected interfaces, and a low but significant number of highly connected interfaces—a hallmark of a scale-free topology. With these conditions for functional connectivity of proteins and physical specificity in binding interfaces satisfied, we treat the yeast network fragment (Fig. 3A) as a representative biological topology. Extrapolating this system to larger protein numbers (by duplicating and connecting this fragment; Fig. 3D) we estimate that on the order of 1,000 distinct proteins can be accommodated in a cellular compartment, with < 10% of proteins trapped in nonspecific complexes.
Cross-Compartmental Mixing and Binding Specificity.
Nonspecific binding potentially affects the experimental determination of protein–protein interaction networks. Proteins fully localized in different subcellular compartments (32) may not be optimized against nonspecific interactions, thus increasing the probability of false positives in assays designed to probe functional binding within the entire proteome. To mimic cross-compartmental mixing and to quantify the resulting spurious nonspecific interactions, we studied the binding between protein ensembles that were optimized independently, and then mixed together. We find that the combinatorial increase in the number of possible nonspecific interactions (32) and the lack of optimization together result in a small but significant increase in the relative affinities to nonspecific partners (Fig. S4). Hence these cross-compartment nonspecific interactions are relatively more likely than intracompartment nonspecific interactions to trigger false positives for functional interactions. Careful culling of purported interactions between proteins that are not colocated should improve the network quality.
Conclusions
Proteins exist in a finite range of sizes with a limited amino acid alphabet. We find that these restrictions set an intrinsic limit to designing protein interfaces that can bind selectively to target proteins, while remaining relatively repulsive to all other protein interfaces. Roughly, for a cell or cellular compartment with N proteins, there are on the order of N specific interactions, but almost N2 nonspecific ones. Hence there is a disadvantage to simply expanding the number of distinct proteins in organisms of greater complexity because introducing more proteins into a cell will eventually result in random, nonspecific interactions taking over. These unwanted interactions are favorably attenuated when proteins interact in a network topology that is globally connected by hub proteins with both shared and distinct interfaces, as the trade-off between adding more interfaces versus sharing the same interfaces favors a mixture of both types. Such networks exhibit improved specificity while maintaining communication between proteins. Nonspecific association can also be suppressed by lowering protein concentrations and by varying their spatial and temporal expression patterns. The requirement for protein specificity amid a sea of sticky protein surfaces should contribute to the evolution of protein interaction networks with a scale-free topology and a limited number of proteins, regardless of organism complexity.
Methods
Sequence Optimization.
For the binding rules established by the connectivity of a particular protein–protein interaction network, the optimal set of N sequences has the largest minimum-energy gap ΔE, defined as the smallest energy gap between specific and nonspecific binding partners:
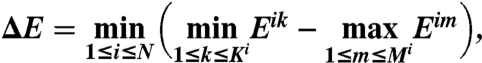 |
where Mi is the number of specific binding partners of interface i in the network, and Ki is the number of nonspecific partners of interface i that includes self-, rotated, and shifted alignments. Eij is the binding energy between a pair of interfaces si and sj,
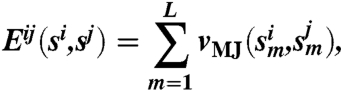 |
where the sum extends over the L amino acid contacts in a given alignment, with L = 25 for perfect alignment. The vMJ are MJ contact potentials (26) that have been optimized for the calculation of protein binding affinities (25), shifted up by a constant energy e0 = 2.27 kBT. The potentials have been optimized for ambient conditions (25, 26).
To find optimal sequences of the proteins in a given network, we perform global optimization with a fitness function designed to bias toward large gaps. With binding constants being proportional to the Boltzmann factors of the binding energies, we define the fitness function as the negative sum over Ki the Boltzmann-weighted nonspecific energies of each protein pair, multiplied by a sum over the Mi inverse-Boltzmann-weighted specific binding energies,
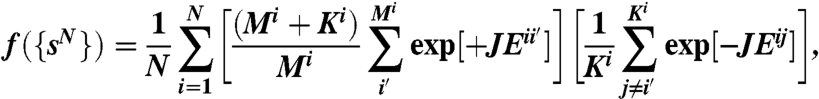 |
averaged over all interfaces i, with J as a positive free parameter. This fitness function favors low (strong) specific binding energies and high (weak) nonspecific binding energies, and therefore a large ΔE.
For each sequence set, we compute the amino acid frequencies 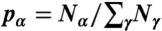 , where Nα is the number of residues of type α within the entire set. To ensure that these amino acid frequencies are close to the distributions
  observed in actual protein interfaces (28), we add a relative entropy term
  to the fitness function (where S = 0 implies perfect agreement with the experimental distribution, and S < 0 implies deviations). The total fitness is defined as F({sN}) = -f({sN}) + λS({sN}), where λ is a free parameter chosen empirically between 0.05 and 0.3. To create sets of N sequences {sN} with large fitness F({sN}) we use MC sampling with Hamiltonian replica exchange and simulated annealing (33) for couplings J ranging from 0.1 to 1.1. From the resulting ensemble we then select the sequence set with the largest gap ΔE, ensuring realistic amino acid distributions by requiring S > -0.3.
Equilibrium Calculations.
Once a set of sequences has been optimized, the resulting binding energies Eij between interfaces i and j are transformed into equilibrium dissociation constants  . To do so we use the definition
  , where kB is Boltzmann’s constant and T is the temperature. We choose the reference K0 such that the Kd for the average specific binding partners is equal to 1 nM, a biologically realistic value. As a result, the Kd for each specific binding reaction is ∼1 nM, with larger Kd for nonspecific binding. From the dissociation constants, we determine the equilibrium concentrations of all proteins and their complexes using both perturbation theory and the Gillespie algorithm (with binding and dissociation rates of kd = 1/s and kb = kd/Kd ensuring proper equilibria). Further details on all methods are provided in SI Text.
Supplementary Material
Acknowledgments.
This work was supported by the Intramural Research Program of the National Institute of Diabetes and Digestive and Kidney Diseases, National Institutes of Health (NIH). The research used the Biowulf Linux cluster at the NIH.
Footnotes
The authors declare no conflict of interest.
*This Direct Submission article had a prearranged editor.
This article contains supporting information online at www.pnas.org/lookup/suppl/doi:10.1073/pnas.1010954108/-/DCSupplemental.
References
- 1.Clamp M, et al. Distinguishing protein-coding and noncoding genes in the human genome. Proc Natl Acad Sci USA. 2007;104:19428–19433. doi: 10.1073/pnas.0709013104. [DOI] [PMC free article] [PubMed] [Google Scholar]
- 2.Claverie J-M. What if there are only 30,000 human genes? Science. 2001;291:1255–1257. doi: 10.1126/science.1058969. [DOI] [PubMed] [Google Scholar]
- 3.Huang LL, Guan RJ, Pardee AB. Evolution of transcriptional control from prokaryotic beginnings to eukaryotic complexities. Crit Rev Eukaryotic Gene Expression. 1999;9:175–182. doi: 10.1615/critreveukargeneexpr.v9.i3-4.20. [DOI] [PubMed] [Google Scholar]
- 4.Bird AP. Gene number, noise reduction and biological complexity. Trends Genet. 1995;11:94–100. doi: 10.1016/S0168-9525(00)89009-5. [DOI] [PubMed] [Google Scholar]
- 5.Nilsen TW, Graveley BR. Expansion of the eukaryotic proteome by alternative splicing. Nature. 2010;463:457–463. doi: 10.1038/nature08909. [DOI] [PMC free article] [PubMed] [Google Scholar]
- 6.Rual JF, et al. Towards a proteome-scale map of the human protein-protein interaction network. Nature. 2005;437:1173–1178. doi: 10.1038/nature04209. [DOI] [PubMed] [Google Scholar]
- 7.Yu H, et al. High-Quality binary protein interaction map of the yeast interactome network. Science. 2008;322:104–110. doi: 10.1126/science.1158684. [DOI] [PMC free article] [PubMed] [Google Scholar]
- 8.Gavin A-C, et al. Proteome survey reveals modularity of the yeast cell machinery. Nature. 2006;440:631–636. doi: 10.1038/nature04532. [DOI] [PubMed] [Google Scholar]
- 9.Krogan NJ, et al. Global landscape of protein complexes in the yeast Saccharomyces cerevisiae. Nature. 2006;440:637–643. doi: 10.1038/nature04670. [DOI] [PubMed] [Google Scholar]
- 10.Yook SH, Oltvai ZN, Barabasi A-L. Functional and topological characterization of protein interaction networks. Proteomics. 2004;4:928–942. doi: 10.1002/pmic.200300636. [DOI] [PubMed] [Google Scholar]
- 11.Kim PM, Korbel JO, Gerstein MB. Positive selection at the protein network periphery: Evaluation in terms of structural constrains and cellular context. Proc Natl Acad Sci USA. 2007;104:20274–20279. doi: 10.1073/pnas.0710183104. [DOI] [PMC free article] [PubMed] [Google Scholar]
- 12.Maslov S, Sneppen K. Specificity and stability in topology of proteins networks. Science. 2002;296:910–913. doi: 10.1126/science.1065103. [DOI] [PubMed] [Google Scholar]
- 13.Gursoy A, Keskin O, Nussinov R. Topological properties of protein interaction networks from a structural perspective. Biochem Soc Trans. 2008;36:1398–1403. doi: 10.1042/BST0361398. [DOI] [PMC free article] [PubMed] [Google Scholar]
- 14.Kim PM, Lu LJ, Xia Y, Gerstein MB. Relating three-dimensional structures to protein networks provides evolutionary insights. Science. 2006;314:1938–1941. doi: 10.1126/science.1136174. [DOI] [PubMed] [Google Scholar]
- 15.Han JDJ, et al. Evidence for dynamically organized modularity in the yeast protein-protein interaction network. Nature. 2004;430:88–93. doi: 10.1038/nature02555. [DOI] [PubMed] [Google Scholar]
- 16.Jeong H, Mason SP, Barabasi A-L, Oltvai ZN. Lethality and centrality in protein networks. Nature. 2001;411:41–42. doi: 10.1038/35075138. [DOI] [PubMed] [Google Scholar]
- 17.Chakrabarti O, Hegde RS. Functional depletion of mahogunin by cytosolically exposed prion protein contributes to neurodegeneration. Cell. 2009;137:1136–1147. doi: 10.1016/j.cell.2009.03.042. [DOI] [PMC free article] [PubMed] [Google Scholar]
- 18.Dobson CM. Protein folding and misfolding. Nature. 2003;426:884–890. doi: 10.1038/nature02261. [DOI] [PubMed] [Google Scholar]
- 19.Kosmrlj A, et al. Effects of thymic selection of the T-cell repertoire on HLA class I-associated control of HIV infection. Nature. 2010;465:350–354. doi: 10.1038/nature08997. [DOI] [PMC free article] [PubMed] [Google Scholar]
- 20.Zhang J, Maslov S, Shakhnovich EI. Constraints imposed by non-functional protein-protein interactions on gene expression and proteome size. Mol Syst Biol. 2008;4:210. doi: 10.1038/msb.2008.48. [DOI] [PMC free article] [PubMed] [Google Scholar]
- 21.Deeds EJ, Ashenberg O, Gerardin J, Shakhnovich EI. Robust protein-protein interactions in crowded cellular environments. Proc Natl Acad Sci USA. 2007;104:14952–14957. doi: 10.1073/pnas.0702766104. [DOI] [PMC free article] [PubMed] [Google Scholar]
- 22.Bussemaker HJ, Thirumalai D, Bhattacharjee JK. Thermodynamic stability of folded proteins against mutations. Phys Rev Lett. 1997;79:3530–3533. [Google Scholar]
- 23.Jones S, Thornton JM. Principles of protein-protein interactions. Proc Natl Acad Sci USA. 1996;93:13–20. doi: 10.1073/pnas.93.1.13. [DOI] [PMC free article] [PubMed] [Google Scholar]
- 24.Kim YC, Tang C, Clore GM, Hummer G. Replica exchange simulations of transient encounter complexes in protein-protein association. Proc Natl Acad Sci USA. 2008;105:12855–12860. doi: 10.1073/pnas.0802460105. [DOI] [PMC free article] [PubMed] [Google Scholar]
- 25.Kim YC, Hummer G. Coarse-grained models for simulations of multiprotein complexes: Application to ubiquitin binding. J Mol Biol. 2008;375:1416–1433. doi: 10.1016/j.jmb.2007.11.063. [DOI] [PMC free article] [PubMed] [Google Scholar]
- 26.Miyazawa S, Jernigan RL. Residue-residue potentials with a favorable contact pair term and an unfavorable high packing density term, for simulation and threading. J Mol Biol. 1996;256:623–644. doi: 10.1006/jmbi.1996.0114. [DOI] [PubMed] [Google Scholar]
- 27.Kosmrlj A, Jha AK, Huseby ES, Kardar M, Chakraborty AK. How the thymus designs antigen-specific and self-tolerant T cell receptor sequences. Proc Natl Acad Sci USA. 2008;105:16671–16676. doi: 10.1073/pnas.0808081105. [DOI] [PMC free article] [PubMed] [Google Scholar]
- 28.Glaser F, Steinberg DM, Vakser IA, Ben-Tal N. Residue frequencies and pairing preferences at protein-protein interfaces. Proteins. 2001;43:89–102. [PubMed] [Google Scholar]
- 29.Skolnick J, Jaroszewski L, Kolinski A, Godzik A. Derivation and testing of pair potentials for protein folding. When is the quasichemical approximation correct? Protein Sci. 1997;6:676–688. doi: 10.1002/pro.5560060317. [DOI] [PMC free article] [PubMed] [Google Scholar]
- 30.Betancourt MR, Thirumalai D. Pair potentials for protein folding: Choice of reference states and sensitivity of predicted native states to variations in the interaction schemes. Protein Sci. 1999;8:361–369. doi: 10.1110/ps.8.2.361. [DOI] [PMC free article] [PubMed] [Google Scholar]
- 31.Li H, Tang C, Wingreen NS. Nature of driving force for proteins folding: A result from analyzing the statistical potential. Phys Rev Lett. 1997;79:765–768. [Google Scholar]
- 32.Jansen R, Gerstein M. Analyzing protein function on a genomic scale: The importance of gold-standard positives and negatives for network prediction. Curr Opin Microbiol. 2004;7:535–545. doi: 10.1016/j.mib.2004.08.012. [DOI] [PubMed] [Google Scholar]
- 33.Frenkel D, Smit B. Understanding Molecular Simulation. San Diego: Academic; 2002. [Google Scholar]
- 34.MacWilliams FJ, Sloane NJA. The Theory of Error-Correcting Codes. Amsterdam: Elsevier; 1977. [Google Scholar]
Associated Data
This section collects any data citations, data availability statements, or supplementary materials included in this article.