Abstract
Purpose: This article presents a general procedural framework to assess the point-by-point precision in mapped dose associated with the intrinsic uncertainty of a deformable image registration (DIR) for any arbitrary patient.
Methods: Dose uncertainty is obtained via a three-step process. In the first step, for each voxel in an imaging pair, a cluster of points is obtained by an iterative DIR procedure. In the second step, the dispersion of the points due to the imprecision of the DIR method is used to compute the spatial uncertainty. Two different ways to quantify the spatial uncertainty are presented in this work. Method A consists of a one-dimensional analysis of the modules of the position vectors, whereas method B performs a more detailed 3D analysis of the coordinates of the points. In the third step, the resulting spatial uncertainty estimates are used in combination with the mapped dose distribution to compute the point-by-point dose standard deviation. The process is demonstrated to estimate the dose uncertainty induced by mapping a 62.6 Gy dose delivered on maximum exhale to maximum inhale of a ten-phase four-dimensional lung CT.
Results: For the demonstration lung image pair, the standard deviation of inconsistency vectors is found to be up to 9.2 mm with a mean σ of 1.3 mm. This uncertainty results in a maximum estimated dose uncertainty of 29.65 Gy if method A is used and 21.81 Gy for method B. The calculated volume with dose uncertainty above 10.00 Gy is 602 cm3 for method A and 1422 cm3 for method B.
Conclusions: This procedure represents a useful tool to evaluate the precision of a mapped dose distribution due to the intrinsic DIR uncertainty in a patient. The procedure is flexible, allowing incorporation of alternative intrinsic error models.
Keywords: dose uncertainty, dose mapping, 4D treatment
INTRODUCTION
Deformable image registration (DIR) algorithms allow consideration of physiologic changes in patient anatomy during treatment, making techniques such as image guided adaptive radiation therapy and image guided radiation therapy,1, 2 among others, possible. DIR algorithms estimate the vectors between corresponding voxels in images that differ due to morphological changes. There are numerous algorithms that use various approaches to calculate the displacement vector field (DVF) that matches points in one image with points in another.3, 4, 5, 6, 7 Although several different basis functions have been utilized by DIR algorithms, no known algorithm provides a DVF that maps tissue elements from between anatomic instances without error.8, 9, 10 The lack of a gold standard makes it difficult to assess the DVF accuracy for arbitrary patient images; similarly, there is no universal or widely accepted method to evaluate the uncertainty of an individual patient’s DVF.
Several approaches have been proposed to evaluate the accuracy of DIR algorithms. Some authors have used real or simulated deformable phantoms where the displacements are known.11, 12, 13 Other tests include comparison between DIR mapped and physician-drawn contours,14, 15 landmark tracking,15, 16, 17 energy conservation analysis,18 or self-consistency evaluation.19 Unfortunately, it is impractical to implement these tests in a clinical practice routine and the information provided by these methods is not complete.19 For example, a deformable phantom does not provide any information about the actual errors made in a real patient and it is impractical to identify a multitude of point-based landmarks for accuracy evaluation. Even when limited automatic landmarks can be identified, they are limited in that they provide no information distant to the landmarks. Furthermore, none of these methods are intended to give the precision of the mapped doses, i.e., the reproducibility of the dose mapping process. Accuracy is not the only measure that can be used to assess the confidence in a DVF. Any physical measurement is also characterized by the precision, i.e., the degree to which repeated measurements under the same conditions will show the same results. Precision does not measure the true error of the measurement, but it gives a value of the spread of possible values around a mean value. However, a precise algorithm is not necessarily accurate, so systematic errors must be evaluated before relying in a precise DVF.
Although precision is not necessarily correlated with accuracy, errors reported in the literature can be useful to estimate the order of magnitude of the expected precision of a DIR algorithm. Published errors vary with the algorithm and evaluation method, with mean values generally in the range of 2–4 mm and maximum errors larger than 15 mm.15, 16, 20 Such large errors can lead to unacceptable dose inaccuracies, limiting the applicability of 4D treatments.
A general DIR process has several sources of intrinsic errors. One specific intrinsic error source is the lack of self-consistency in generating the DVF.19, 21 In simple terms, this causes composite transitive transformations, such as f⋅f−1 and fAB⋅fBC⋅fCA, to be not equal to the identity transformation, with f−1 being the inverse of f and fAB, fBC, and fCA the transformations from image A to B, from B to C, and from C to A, respectively. Self-consistency is a necessary but not sufficient requirement for a precise DIR algorithm.
The clinical impact of DVF errors is not only related to the magnitude of such errors, but also to their spatial location. Dosimetrically, a large displacement error may be of small importance if it is located in a volume with homogeneous dose or with no dose at all. On the other hand, a small DVF error may lead to a large dose error if it is located in a high dose gradient region. One purpose of DIRs for a 4D treatment is to map the dose delivered on an image set to one or several other sets and reconstruct the composite (total) delivered dose over all image sets.2, 22, 23 Errors in dose mapping may or may not be consequential depending on whether they are located within an important structure or not.
In this paper, a computational framework is presented to estimate the dose uncertainty in a 4D treatment due to the intrinsic DVF uncertainty in a patient-per-patient basis. This procedure obtains a set of mapped points for each voxel. The dispersion of these points is used to model the uncertainty of the mapped point coordinates due to the inherent imprecision of DIR algorithms by an iterative procedure. Dose standard deviation is then calculated for each imaging voxel from the standard deviation of the modules of inconsistency vectors (method A) or from the covariance matrix of the coordinate of inconsistency vectors (method B).
This scheme provides an estimation of the precision for DIR mapped doses. A simplistic DVF error model is used. It is not the aim of this work to propose a comprehensive DVF error model but to present a method that, given any DVF error model, provides a dose uncertainty estimation. In the form presented in this paper, random errors due to the intrinsic functioning of the DIR algorithm are considered and, therefore, the method is insensitive to systematic errors.
The intrinsic uncertainty algorithm takes advantage of the lack of self-consistency of the DIR to obtain a set of similar images where each point in an image can be traced to the other ones. By doing so, statistical dispersion due to intrinsic inconsistency can be calculated at each voxel. Adaptation of this method for use with inverse consistent DIR algorithms is covered Sec. 4.
MATERIALS AND METHOD
The procedure consists of three steps: An iterative registration method is used to obtain a cluster of points associated with each voxel; the dispersion of the cluster is used to compute point-by-point DIR uncertainties; and from the DIR uncertainties, dose error is evaluated.
Importantly, the process used in the first step to obtain the cluster of points is a simple first order estimate of the point dispersion. Alternative processes to estimate DIR process point dispersion can be simply substituted in this process. Ideally, the selected method should assess all sources of intrinsic uncertainty of the whole registration procedure. The last two steps are general and can be applied given any source or subsource of intrinsic DIR errors.
Notation and terminology
DIR algorithms map information (typically image intensity, but possibly contours) from a source image to a target image. In this paper, the original source and target images are noted S0 and T0. The uncertainty evaluation algorithm presented here generates a set of source and target images in an iterative scheme. The generated images in step n are noted Sn and Tn and are referred as mapped source and mapped target images. Every point in images Sn is the result of composite mappings Sn=fSn−1T0⋅fTnS0, with fSn−1T0 being the DIR transformation from Sn−1 to T0 and fTnS0 the transformation from the resulting Tn to S0. The vector that goes from a point in S0 to the corresponding point in Sn is noted the nth inconsistency vector or vn.
Two uncertainty analyses are used in this work. The first is the variance of the modules of inconsistency vectors. For a given voxel, the standard deviation of the module of the inconsistency vector in step n is noted σn, while the standard deviation of the whole set of vectors and the reconstructed initial standard deviation (the inferred standard deviation of the initial transformation) are noted σT and σ0, respectively. The second analysis is a generalization of the first where the subscript notation remains but, instead of using the standard deviation σ of the modules of vectors, the covariance matrix
of the vector coordinates is used, where σx2, σy2, and σz2 are the variances of the x, y, and z coordinates and σxy, σxz, and σyz are the covariances. In all figures and the text, values of σ and |∑|1∕2 are given in mm.
Set of points
The procedures to model the intrinsic DVF uncertainty in a first stage, determine σ0 and ∑0 in a second stage and then determine dose uncertainty in a third stage, are independent of one another. The output of one stage is used as input for the next one, so the method to obtain the cluster of points can be changed without modifying the other two stages or the error model can be replaced by an alternative model, either a more general model or one specific for a DIR algorithm or anatomic region. The only link between the first and the second stage are the point coordinates and the only link between the second and the third phase are σ0 or ∑0.
In this paper, DVF intrinsic errors are assumed to be Gaussian distributed. That is, the mapped coordinates of each point are assumed to be Gaussian distributed around a mean value. This assumption is not proven in this work and may be simplistic, although it is a reasonable a priori assumption because the total DVF uncertainty is due to the sum of several sources of errors, so their overall effect is expected to be nearly Gaussian.
To determine the precision of the DVF, the repeatability of the results must be assessed. However, DIR algorithms are deterministic, so some “artificial” perturbation must be introduced. This perturbation must be large enough to cause the algorithm to provide a different solution, but small enough for the differences to be due mainly to the intrinsic uncertainty of the algorithm. This paper uses the inherent differences between the mapped image and the target image in a DIR procedure.
Mapping a source image S0 into a target image T0 with a DIR algorithm implies determination, for each point in S0, of the associated position of the point in T0. Generally, this calculation is not exact and thus, some uncertainty in the mapped position of the point is introduced by the DIR algorithm. There are several sources of uncertainty, each of which contributes to the total uncertainty. In the absence of systematic errors, the true value of the mapped position is located in the neighborhood of the calculated point. As the total uncertainty arises from several causes, the positional error of the mapped point can be assumed to follow a Gaussian probability density function (PDF). Because of this uncertainty, the resulting mapped image T1 is not exactly the same than T0.
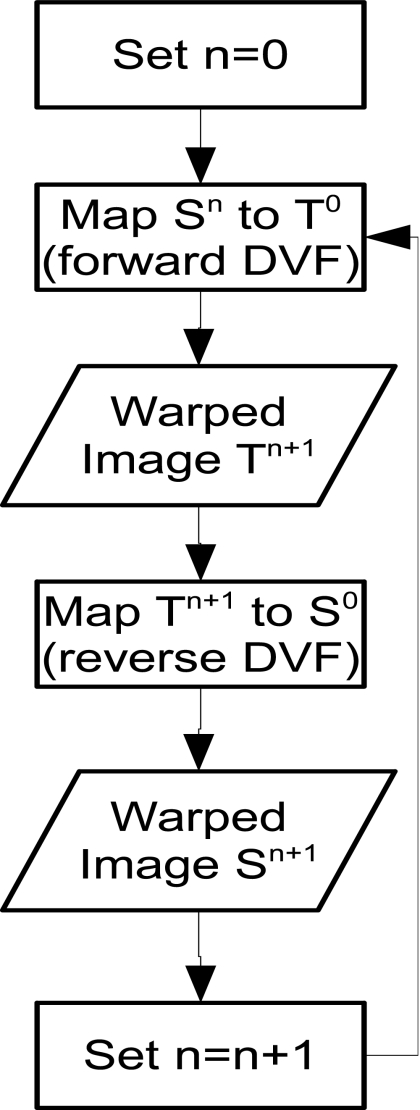
The overall procedure utilized is shown schematically in Fig. 1. After the initial mapping from S0 to T0 and computation of T1, T1 is mapped back to S0. The coordinates of a point of the new image S1 to the original point in S0 have a PDF that is the convolution of the forward and the backward mapping uncertainties. Since the images are similar and the algorithm did not change, we assume that the intrinsic uncertainty due to the DIR algorithm does not change. In this case, the PDFs of the new point’s coordinates are the convolution of two identical Gaussian distributions which is another Gaussian distribution with σ1,i2 = 2σ0,i2, where σ1,i and σ0,i are the standard deviation of the coordinate xi. In the second step, image S1 is mapped to T0 (resulting in T2). However, the backward transformation is not from T2 to S1 but from T2 to S0. This assures that the resulting images S1,S2,S3,… do not diverge but tend to be similar to S0. In general, for any n, the nth iteration consists of mapping Sn−1 to T0 and then Tn is mapped back to S0. The variance of a coordinate of a point in Sn to the analogous point in S0 is 2nσ0,i2.
Figure 1.
Flowchart of the procedure to obtain a set of variant images as a first step to estimate the DVF uncertainty. In every loop, the image resulting from the previous loop is warped toward the original target image T0. The image obtained is warped back to the original source image S0 and the resulting image will be used as input for the next loop.
After N iterations, each point in S0 can be related to a cluster of N points. The total distribution of this cluster is the sum of the PDFs of every point. The superposition of Gaussian distributions is not in general a Gaussian, but if they have the same mean value, the variance of each coordinate is given by
| (1) |
where we have taken into account that and chosen the origin of the coordinate system so that ⟨xn,i⟩=0,∀n∊[1,N].
Accordingly, from the variance of the positions of an iteratively mapped point, it is possible to infer the expected variance in the first mapping, which enables estimation of the uncertainty effects on clinically used DIR mappings.
DVF Uncertainty
Method A (variance of vector modules)
The module of the inconsistency vector vn is given by , with x, y, and z being random variables with Gaussian PDFs. For the case of σ=1 and μ=0 (being σ the standard deviation of and μ the mean), the PDF of |vn| tends to the χ distribution with three degrees of freedom. For the sake of simplicity, we can approximate the distribution of vn to a Gaussian distribution with a good degree of accuracy. In this case, Eq. 1 can be applied to the module of vn and we can approximate the uncertainty of the module of vn via σ02 = σT2∕(N+1). This approximation is more accurate with larger values of the standard deviations of each coordinate, σx, σy, and σz. The standard deviation of this Gaussian distribution will be named σ0.
Method B (coordinates variance)
The analysis of the vector module variances has some drawbacks. The first problem is that it lacks of directional information. For a point in S0, the variance of positions of the related cluster of points in S1,S2,… may have a predominant direction. Losing the directionality of variance makes the estimation less accurate and ignores possible correlations between uncertainties in coordinates. The second problem of the module analysis is related to the impact of DVF uncertainty in the mapped dose precision.
Related to the previous drawbacks, dose uncertainty estimation can be improved if the interaction between the directionality of the DVF uncertainty and the dose gradient is considered. If dose gradient is perpendicular to the largest component of the DVF uncertainty, the effect of the latter would be diminished.
To overcome these limitations, a generalization of the previous method is developed. The same set of images S1,S2,… are used as in method A. However, instead of looking at the modules of the inconsistency vectors, the coordinates of the mapped points are analyzed. Taking the position of the original point as origin of the reference system, the covariance matrix of the coordinates of the associated cluster of points is calculated.
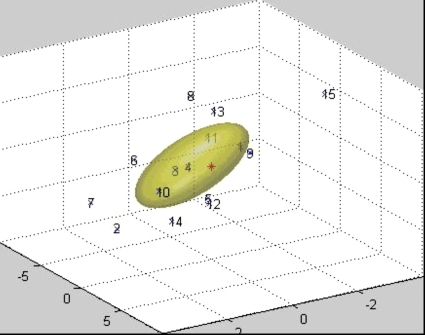
The covariance matrix of the coordinates retains information about the anisotropy of the cluster of points. The probability that a point in S0 is mapped to a point in T0 can be evaluated by the 3D Gaussian distribution (Fig. 2), where ∑0 is the covariance matrix, is the coordinate column vector of the point, and is the transpose coordinate vector. This 3D distribution can be viewed as the PDF that the mapped image of the point in S0 (the point where is calculated) is .
Figure 2.
Cluster of points generated by iteratively mapping a point in the source image. Numbers show the iteration at which each point was obtained. The numberless point represents the original point. The ellipsoid represents the 50% isosurface of the initial 3D Gaussian distribution calculated from the cluster.
Dose uncertainty
After the variance for each point is computed, the impact of it on dose can be assessed. To first order, dose uncertainty may be estimated by considering a sphere centered at a point with diameter kσ0, k being a dimensionless parameter that depends on the desired degree of confidence and σ0 the estimated standard variation of the DVF at each point. The variance of dose values within this sphere can be used to estimate the dosimetric impact of the DIR inaccuracies in this point. This procedure is the only suitable when obtaining σ0 by method A.
This simplistic process has several weaknesses. It is obvious that not every value within the sphere has the same probability. The further the dose point is from the center, the less probable it is. Furthermore, the dose uncertainty estimation depends on the arbitrary parameter k, the diameter of the sphere to evaluate the dose uncertainty in. Changing k changes the calculated variance. Increasing the value of k implies, in most cases, increasing the calculated dose uncertainty and no convergence is obtained for any value of k. This problem can be partially overcome by weighting the dose points with a function that takes into account the radial distance; however, there is no universal appropriate function to use. Regardless, the fact that DIR uncertainty may not be isotropic will result in misestimating the dose uncertainty within the sphere. Furthermore, if the radius of the sphere is smaller than the size of the dose grid and nearest-neighbor interpolation is used to estimate dose values within the sphere, the estimated uncertainty will be exactly 0 since only one dose value will be considered. This can be overcome by trilinear interpolation of doses on the 3D dose matrix. Due to the fact that method A is merely a first order estimate and that trilinear interpolation is computationally expensive, only nearest-neighbor interpolation is used in this work with method A.
The problems related to the loss of directionality and sphere size inherent to method A can be avoided by using the more detailed information provided by method B. The covariance matrix ∑0 provides information not only about the magnitude but also about the directionality of the uncertainty. In a DVF analysis, |∑0|1∕2 can be assimilated to σ0 but by doing so the advantages of knowledge of DVF uncertainty directionality are lost. Furthermore, if the Gaussian PDF is highly directional, |∑0|1∕2 can be very small even though some individual components are large.
The PDF calculated by method B can be used to calculate a weighted dose variance. Each dose value is weighted by the value of the PDF at its position. In practice, for computational reasons, only dose values whose statistical weight is above a threshold are considered for the calculation. The dose uncertainty calculated in this way preserves the anisotropy of DIR errors, takes into account the direction of the dose gradient, and does not relay in an arbitrary parameter like k in the previous procedure. The only selectable parameter is the Gaussian function threshold to consider the dose point in the calculation. Importantly, the calculated dose variance converges as the threshold value decreases, so if the chosen value is low enough, the calculated dose variance will be accurate.
This approach has a further advantage when using nearest-neighbor interpolation in regions with low spatial uncertainties. Unlike method A which yields zero dose uncertainty when kσ0 is less than the size of the dose grid, in method B the 3D Gaussian spatial uncertainty distribution covers the whole patient volume. By setting a suitably low threshold for the minimum statistical weight considered, multiple voxels are sampled in 3D, resulting in a sufficiently accurate estimate of the dose uncertainty estimation without the need to resort to trilinear interpolation. To validate that the threshold was set sufficiently low, a comparison of nearest-neighbor and trilinear dose estimates is presented.
In order to offer some insight to the differences between both methods and their accuracy, three representative points are studied in detail. The points are chosen to be representative of voxels where both methods show small, medium, and large discrepancies. Specifically, the evolution of the dose uncertainty in each point with the number of iterations used to determine σ0 and ∑0 are analyzed and the Kolmogorov–Smirnov test is performed on the points coordinates to evaluate normality. Results for these three points do not try to probe the accuracy of the DVF uncertainty model used, but to show that it is a feasible model and may provide reasonable results.
Clinical demonstration case
A 4D CT of a lung case is used to demonstrate the procedures given above. The patient was diagnosed as having a malignant neoplasm of right bronchus and lung. Treatment consisted of an IMRT plan to deliver 50 Gy in 25 sessions, plus a boost of 12.6 Gy in 7 sessions with 6 and 18 MV beams. The main plan consisted of seven equispaced beams with 50° steps. The boost plan consisted of seven beams at angles of 15°, 90°, 130°, 180°, 230°, 280°, and 330°. For simplicity, only two breathing phase images (full inhale and full exhale) are used. The general method is easily extendable to mapping multiple image phases with the total dose uncertainty being the sum of the individual phase dose uncertainties added in quadrature. For this demonstration, we compute the full 62.6 Gy delivery to the exhale phase and then map the dose into the inhale phase using the point-based thin plate spline (TPS) algorithm implemented in a research version of Pinnacle planning system.7 Volumes used as input by the TPS algorithm were lungs, heart, cord, superior mediastinal lymphatic nodes, esophagus, PTV, and GTV. The number of vertices to create the volume meshes and the number of sample points for the TPS algorithm are left at their default values. Fifteen iterative mappings are performed to estimate the DIR induced point dispersion. The CT image voxel size is 0.976 56×0.976 56×2.999 95 mm and the dose calculation grid size is 2×2×2 mm. Both variance methods are applied in order to illustrate the similarities and differences between them. Additional calculations with method B are performed with a 1.5×1.5×1.5 mm dose resolution to show the insensitivity of the results to sufficiently fine dose grid resolutions.
RESULTS
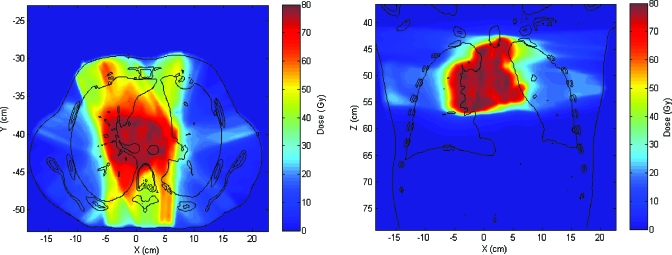
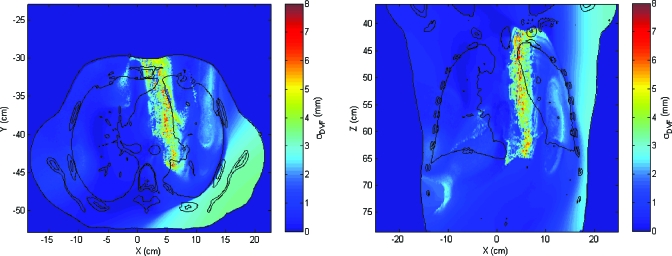
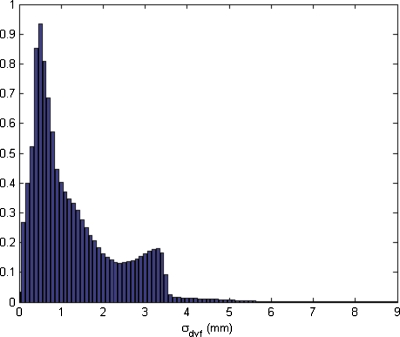
The dose distribution is calculated on the exhale breathing phase and then mapped to the inhale phase (Fig. 3). Fifteen mapping iterations are performed, resulting in 15 mapped source images and 15 evaluations of inconsistency vector vn in order to calculate uncertainty. In Fig. 4, the spatial distribution of the inconsistency vectors is shown. Displacement uncertainties are mainly clustered within a narrow band between the mediastinum and the left lung. Although not shown here, this feature did not appear when a different set of DIR parameters were used. The DIR set with the feature is used in this demonstration since it clearly shows the utility of the method developed. For the case shown in Fig. 4, the maximum σDVF is 9.2 mm and the mean value within the patient’s body is 1.3 mm. The histogram of σDVF values is shown in Fig. 5.
Figure 3.
Axial and coronal slices of the treatment case dose distribution mapped into the inhale phase.
Figure 4.
Distribution of standard deviations of the modules of inconsistency vectors by using method A. σ is given in mm.
Figure 5.
Histogram of DVF standard deviations for the test case. Frequency is given in arbitrary units.
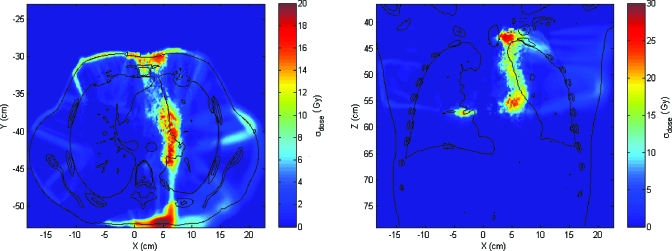
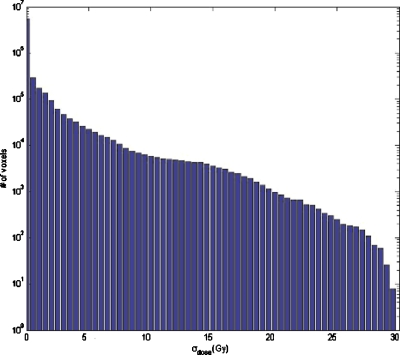
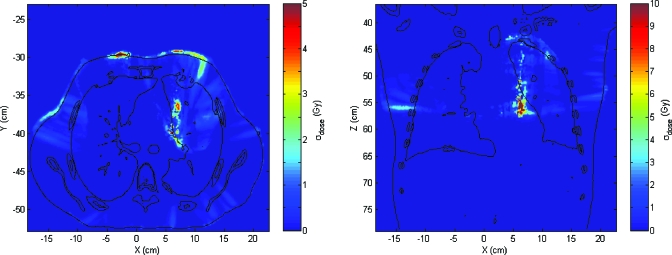
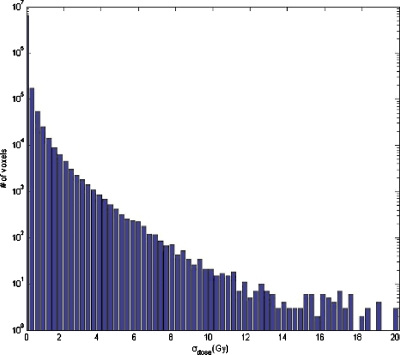
The dose uncertainty, computed with k=1, shows that large dose uncertainty values exist where large σDVF values matches up to high dose gradient regions, as was expected. In Fig. 6, the distribution of dose standard deviation is shown. Note that there are some regions (one of them clearly visible in the axial slice, in the lower part of the right lung) where σdose is exactly 0 and there is a discontinuity between voxels where σdose>0 and voxels with σdose=0. Because of using nearest-neighbor interpolation, this discontinuity marks the point where σDVF value goes from higher than twice the dose grid size to a lower value. If there is only one dose value within the kσ sphere, the dose variance is exactly 0. As soon as the sphere is large enough to encompass more points, the variance changes sharply from zero to a nonzero value in neighbor voxels. The maximum value of σdose is 29.66 Gy and the mean is 0.96 Gy. The volume where σdose is larger than 10.00 Gy is V(σdose>10.00)=602.3 cm3, whereas V(σdose>1.00)=5740.1 cm3 and V(σdose>0.10)=11 084.2 cm3 (Fig. 7).
Figure 6.
Axial and coronal slices showing the spatial distribution of the dose standard deviation obtained by the method A. σ is given in Gy.
Figure 7.
Dose standard deviation histogram obtained by the method A. Standard deviation is given in Gy.
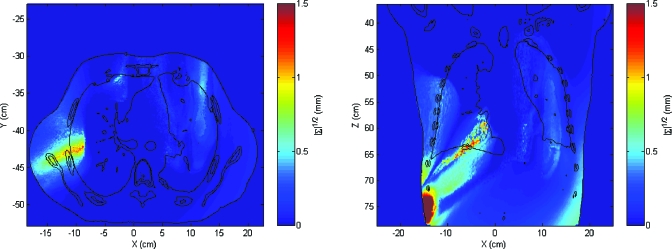
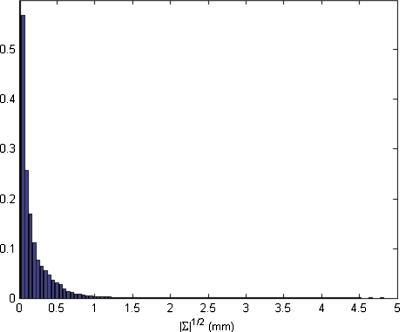
The spatial obtained by method B (|∑|1∕2) differs significantly from that obtained by method A (Fig. 8). The uncertainty region between the mediastinum and the lung still exists but the relative intensity of this region is much lower. The maximum |∑|1∕2 was 5.5 mm and the mean value was 0.1 mm. The histogram of values of |∑|1∕2 is shown in Fig. 9. Although |∑|1∕2 can be viewed as a generalization of the standard deviation, its value is less meaningful since a small value of |∑| may hide a large variance in a dosimetrically important spatial direction.
Figure 8.
Square root of the determinant of the covariance matrices of coordinates by using method B. |∑|1∕2 is given in mm.
Figure 9.
Histogram of square root of the determinant of the coordinate covariance matrices for the test case. Frequency is given in arbitrary units.
Despite the differences between the distributions of σDVF and |∑|1∕2, the distribution of dose uncertainties calculated by the method B (Fig. 10) resembles roughly the distribution obtained by the first procedure but magnitudes are much different. The largest uncertainties are located in the same region; however, the overall region is much smaller with method B and there is a difference of an order of magnitude in the mean dose uncertainty. The maximum σdose found with method B is 21.81 Gy and the mean is 0.07 Gy. The volume with σdose>10 Gy is V(σdose>10.00)=1422.2 cm3, whereas V(σdose>1.00)=3035.7 cm3 and V(σdose>0.10)=5094.0 cm3 (Fig. 11). For computational efficiency, voxels with cumulative statistical weight under 0.02% were not taken into account, that is, voxels that are at 3.72σ from the Gaussian mean value. Use of trilinear interpolation in place of nearest-neighbor interpolation to evaluate dose uncertainty was found to not significantly change the results. Using trilinear interpolation, maximum σdose was 21.81 Gy and mean σdose was 0.12 Gy. Estimation of V(σdose) agreed within 3% for values of σdose lower than 3.50 Gy; however, difference increases for low values of σdose being V(σdose>2.00 Gy) 20% larger if trilinear interpolation was used. Use of trilinear interpolation increased the computation time fourfold. Using a 1.5×1.5×1.5 mm3 dose grid showed little differences in uncertainty distributions.
Figure 10.
Axial and coronal slices showing the spatial distribution of the dose standard deviation obtained by the method B. σ is given in Gy.
Figure 11.
Dose standard deviation histogram obtained by the method B. Standard deviation is given in Gy.
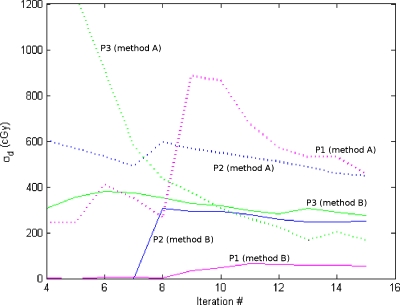
The propagation of the estimated uncertainty for three points is shown in Fig. 12 to illustrate the differences between the methods. For each point, the calculated dose standard deviation is shown after 4–15 iterations. Method A tends to be more unstable and to provide larger estimations of the dose standard deviation. This is likely due to the fact that method A does not take into account the directionality of spatial uncertainty, thus leading to an overestimation in volumes where the largest component of the spatial uncertainty is perpendicular to the dose gradient. Also, the assumption that the distribution of modules of inconsistency vectors can be approximated to a Gaussian distribution is not always true and may lead to some errors. For these three points, the Kolmogorov–Smirnov test was applied to compare the distribution of each coordinate to the superposition of Gaussian distributions that was assumed in this work. All the coordinates of the three points passed the test. In Table 1, the significance values for each coordinate and point are shown.
Figure 12.
Dose standard deviation in three representative points as a function of the number of iterations. Dashed lines represent calculations made with method A and solid lines with method B.
Table 1.
P-values resulting from applying the Kolmogorov–Smirnov test to the spread of the values of each coordinate for the three sample points. The null hypothesis was that the distribution of the coordinates comes from the superposition of 15 Gaussian distributions.
| x Coordinate (%) | y Coordinate (%) | z Coordinate (%) | |
|---|---|---|---|
| Point 1 | 20.59 | 75.59 | 26.14 |
| Point 2 | 86.18 | 41.30 | 45.08 |
| Point 3 | 64.68 | 43.81 | 37.73 |
DISCUSSION
The procedural framework presented in this work provides a dose uncertainty distribution that may be useful to assess the quality of 4D dose mapping and hence, also of a 4D treatment. The system is flexible enough to be used with different error models. However, the results may be highly dependent on the specific error analysis performed.
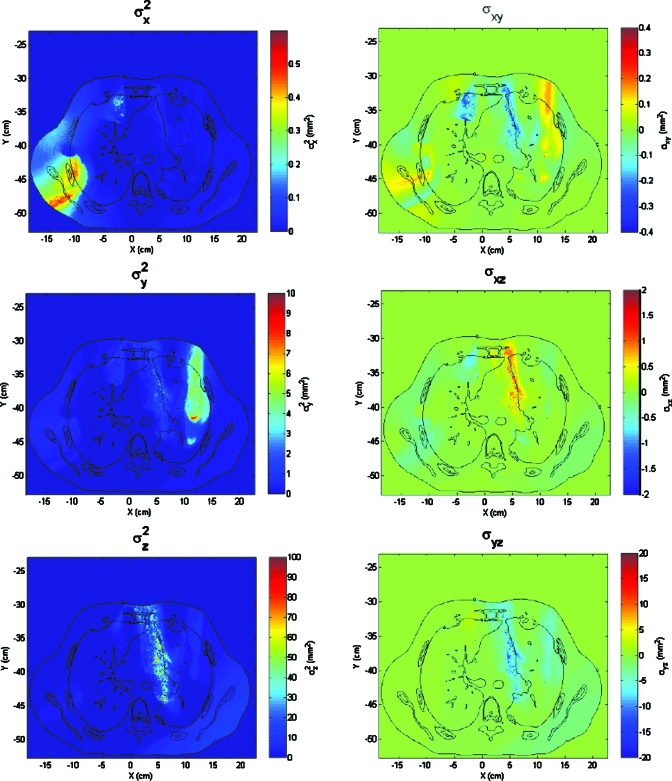
The results obtained with the two error analyses presented in this paper show significant differences. Although some structures are identifiable with both methods, the magnitudes of displacement uncertainties are very different. For example, the band-shaped feature between the mediastinum and the left lung is clearly the most prominent feature of the variance mapping obtained by the first procedure (Fig. 4), whereas it seems a much less prominent feature if we look at the values of |∑0|1∕2. The reason for such differences is related with the directionality of the DIR uncertainties. It is possible that inconsistency vectors of a point tend to be aligned along a direction. If that happens, the variance of modules of vn may be large, but the determinant of ∑0 will be small, since there is a coordinate system where all the elements of ∑0 but one are very small. Analyzing the elements of ∑0 (Fig. 13), it can be seen that the region between the mediastinum and the lung shows a strong directionality near the z direction, which would explain why the first procedure gives large deviations there but the second one does not. Note that although |∑0| may be very small, the information about the variances and covariances in each direction is not lost and it is used when calculating the 3D Gaussian distribution of each point.
Figure 13.
Mapping of the values of the independent elements of the covariance matrices obtained in the test case. Note that each image has a different color scale. Predominance of one component in some regions indicates that variance have a strong directionality.
The effect of not considering the directionality of displacement uncertainty to calculate the dose in method A are evident in comparing results to method B. Although the order of magnitude of the maximum dose variances and the location of inaccurate regions are similar, the amount of volume involved and the mean dose variance are very different. When dose variance is estimated in method A from the unweighted variance of doses within a sphere, the directionality of dose gradient is not taken into account. However, in method B, since the anisotropy of the DVF variance is taken into account, not only are the dose values accounted for, but the spatial distribution of doses have an influence on the dose uncertainty estimation.
In general, method B provides a more accurate estimation of the dose uncertainty associated with the DVF uncertainty because it takes into account the directionality of displacement uncertainties and it weights dose values around each point. However, if one is interested only in the DVF uncertainty, method A provides a simple index that can highlight potential inaccurate regions. Method B does not provide such a simple insight of the spatial uncertainty and a more complex and less intuitive analysis of the covariance matrix for each point would be necessary.
With both methods, the procedure can estimate the impact on dose distribution of DIR intrinsic inaccuracies. However, they do not address the impact of systematic DIR errors due to contouring errors, CT image artifacts, or other errors. In general, systematic errors do not result in a dispersion of points and thus will not be detected by these algorithms. A low dose uncertainty does not mean a correct dose, but that the DIR algorithm consistently maps the dose and that the mapping shows little variability. The specific sources of errors to which these procedures are not sensitive should be studied.
Intuitively, one might expect dose uncertainties to be largest in dose gradient or penumbral regions; however, this is not true in general. Relatively small spatial uncertainties in high gradient dose regions can result in large uncertainties; however, the largest dose gradient region is not necessarily the location with the largest dose uncertainty. Spatial uncertainties in high gradient dose regions may be small, resulting in small dose uncertainties. Similarly, low dose gradient regions with high spatial uncertainty can result in large dose uncertainties. Furthermore, even large spatial uncertainties can result in low dose uncertainties in a large gradient region if the spatial uncertainty is highly directional and normal to the gradient vector. The relationship between the dose gradient and the sensitivity of the dose distribution to DVF errors is under study.24 In the case presented in this paper, the correlation coefficient between dose gradient and dose uncertainty was 0.32, meaning a very weak correlation.
The presented algorithm takes advantage of the lack of self-consistency of most DIR algorithms. Nonetheless, it is still usable on DIR algorithms designed to be self-consistent.21, 25, 26 Such algorithms aim to minimize the lack of consistency but they do not eliminate it. Importantly, computing the composite mappings Sn=fSn−1T0⋅fTnS0 results in an image Sn≠S, thus allowing the evaluation of vn and application of the method.
This procedure also has the advantage of estimating the DVF and dose uncertainty in three separable phases. Thus, more general methods to estimate the DIR induced point dispersion can readily be used within this framework with little modification. Similarly, cause specific point dispersion models can be used to investigate dose uncertainty induced by subcomponents of an DIR uncertainty.
CONCLUSION
A procedural framework to assess point-by-point dose precision in dose mapping is presented. The procedure is conceived in a modular way so that different error models and analysis can be used within it. In this work, two different analyses are used.
Although the second analysis is more complete and more reliable, the first method, based on the variance of the modules of inconsistency vectors, may be useful for a more simple analysis when dose uncertainty accuracy is not a concern. The second alternative, a more accurate generalization of the first method, takes into account more complex details of the impact of the DVF uncertainty in the dose precision.
The clinical impact of dose uncertainties resulting from intrinsic DIR uncertainties should not be inferred from the single case presented in this work. The methods can be a useful tool to assess the precision of dose mapping in 4D treatments or the potential impact of DIR uncertainties on dose conformation within planning volumes and the clinical impact of such imprecision on a per-patient basis. Such evaluations are ripe topics for future study.
ACKNOWLEDGMENTS
This work was supported by funding from National Institutes of Health (Grant No. NIH-P01-CA116602) and in part by a research contract with Philips Medical Systems.
References
- Xing L. et al. , “Overview of image-guided radiation therapy,” Med. Dosim. 31(2), 91–112 (2006). 10.1016/j.meddos.2005.12.004 [DOI] [PubMed] [Google Scholar]
- Mackie T. R. et al. , “Image guidance for precise conformal radiotherapy,” Int. J. Radiat. Oncol., Biol., Phys. 56(1), 89–105 (2003). 10.1016/S0360-3016(03)00090-7 [DOI] [PubMed] [Google Scholar]
- Christensen G. E., Rabbitt R. D., and Miller M. I., “Deformable templates using large deformation kinematics,” IEEE Trans. Image Process. 5(10), 1435–1447 (1996). 10.1109/83.536892 [DOI] [PubMed] [Google Scholar]
- Johnson H. J. and Christensen G. E., “Consistent landmark and intensity-based image registration,” IEEE Trans. Med. Imaging 21(5), 450–461 (2002). 10.1109/TMI.2002.1009381 [DOI] [PubMed] [Google Scholar]
- Lu W. G. et al. , “Fast free-form deformable registration via calculus of variations,” Phys. Med. Biol. 49(14), 3067–3087 (2004). 10.1088/0031-9155/49/14/003 [DOI] [PubMed] [Google Scholar]
- Yan C. et al. , “A pseudoinverse deformation vector field generator and its applications,” Med. Phys. 37(3), 1117–1128 (2010). 10.1118/1.3301594 [DOI] [PMC free article] [PubMed] [Google Scholar]
- Kaus M. R. et al. , “Assessment of a model-based deformable image registration approach for radiation therapy planning,” Int. J. Radiat. Oncol., Biol., Phys. 68(2), 572–580 (2007). 10.1016/j.ijrobp.2007.01.056 [DOI] [PubMed] [Google Scholar]
- Wang H. et al. , “Validation of an accelerated ‘demons’ algorithm for deformable image registration in radiation therapy,” Phys. Med. Biol. 50(12), 2887–2905 (2005). 10.1088/0031-9155/50/12/011 [DOI] [PubMed] [Google Scholar]
- Foskey M. et al. , “Large deformation three-dimensional image registration in image-guided radiation therapy,” Phys. Med. Biol. 50(24), 5869–5892 (2005). 10.1088/0031-9155/50/24/008 [DOI] [PubMed] [Google Scholar]
- Webb S., “Does elastic tissue intrafraction motion with density changes forbid motion-compensated radiotherapy?,” Phys. Med. Biol. 51(6), 1449–1462 (2006). 10.1088/0031-9155/51/6/006 [DOI] [PubMed] [Google Scholar]
- Serban M. et al. , “A deformable phantom for 4D radiotherapy verification: Design and image registration evaluation,” Med. Phys. 35(3), 1094–1102 (2008). 10.1118/1.2836417 [DOI] [PubMed] [Google Scholar]
- Kerdok A. E. et al. , “Truth cube: Establishing physical standards for soft tissue simulation,” Med. Image Anal. 7(3), 283–291 (2003). 10.1016/S1361-8415(03)00008-2 [DOI] [PubMed] [Google Scholar]
- Kashani R. et al. , “Technical note: A physical phantom for assessment of accuracy of deformable alignment algorithms,” Med. Phys. 34(7), 2785–2788 (2007). 10.1118/1.2739812 [DOI] [PubMed] [Google Scholar]
- Pevsner A. et al. , “Evaluation of an automated deformable image matching method for quantifying lung motion in respiration-correlated CT images,” Med. Phys. 33(2), 369–376 (2006). 10.1118/1.2161408 [DOI] [PubMed] [Google Scholar]
- Brock K. K. and Deformable Registration Accuracy Consortium, “Results of a multi-institution deformable registration accuracy study (MIDRAS),” Int. J. Radiat. Oncol., Biol., Phys. 76(2), 583–596 (2010). 10.1016/j.ijrobp.2009.06.031 [DOI] [PubMed] [Google Scholar]
- Castillo R. et al. , “A framework for evaluation of deformable image registration spatial accuracy using large landmark point sets,” Phys. Med. Biol. 54(7), 1849–1870 (2009). 10.1088/0031-9155/54/7/001 [DOI] [PubMed] [Google Scholar]
- Gu X. J. et al. , “Implementation and evaluation of various demons deformable image registration algorithms on a GPU,” Phys. Med. Biol. 55(1), 207–219 (2010). 10.1088/0031-9155/55/1/012 [DOI] [PMC free article] [PubMed] [Google Scholar]
- Zhong H. L., Peters T., and Siebers J. V., “FEM-based evaluation of deformable image registration for radiation therapy,” Phys. Med. Biol. 52(16), 4721–4738 (2007). 10.1088/0031-9155/52/16/001 [DOI] [PubMed] [Google Scholar]
- Bender E. T. and Tome W. A., “The utilization of consistency metrics for error analysis in deformable image registration,” Phys. Med. Biol. 54(18), 5561–5577 (2009). 10.1088/0031-9155/54/18/014 [DOI] [PMC free article] [PubMed] [Google Scholar]
- Kashani R. et al. , “Objective assessment of deformable image registration in radiotherapy: A multi-institution study,” Med. Phys. 35(12), 5944–5953 (2008). 10.1118/1.3013563 [DOI] [PMC free article] [PubMed] [Google Scholar]
- Christensen G. E. and Johnson H. J., “Consistent image registration,” IEEE Trans. Med. Imaging 20(7), 568–582 (2001). 10.1109/42.932742 [DOI] [PubMed] [Google Scholar]
- Keall P. J. et al. , “Monte Carlo as a four-dimensional radiotherapy treatment-planning tool to account for respiratory motion,” Phys. Med. Biol. 49(16), 3639–3648 (2004). 10.1088/0031-9155/49/16/011 [DOI] [PubMed] [Google Scholar]
- Heath E. and Seuntjens J., “A direct voxel tracking method for four-dimensional Monte Carlo dose calculations in deforming anatomy,” Med. Phys. 33(2), 434–445 (2006). 10.1118/1.2163252 [DOI] [PubMed] [Google Scholar]
- Saleh-Sayah N. K. et al. , “SU-GG-T-03: A distance to dose difference tool for estimating the required spatial accuracy of a displacement vector field,” Med. Phys. 37, 3183–3183 (2010). 10.1118/1.3468388 [DOI] [PMC free article] [PubMed] [Google Scholar]
- Shi Y. G., Morra J. H., Thompson P. M., and Toga A. W., “Inverse-consistent surface mapping with Laplace–Beltrami eigen-features,” Information Processing in Medical Imaging, Proceedings, Vol. 5636, pp. 467–478, 2009. [DOI] [PMC free article] [PubMed]
- Tao G. et al. , “Symmetric inverse consistent nonlinear registration driven by mutual information,” Comput. Methods Programs Biomed. 95(2), 105–115 (2009). 10.1016/j.cmpb.2009.01.011 [DOI] [PMC free article] [PubMed] [Google Scholar]


