

Abstract
In sinoatrial node cells of the heart, beating rate is controlled, in part, by local Ca2+ releases (LCRs) from the sarcoplasmic reticulum, which couple to the action potential via electrogenic Na+/Ca2+ exchange. We observed persisting, roughly periodic LCRs in depolarized rabbit sinoatrial node cells (SANCs). The features of these LCRs were reproduced by a numerical model consisting of a two-dimensional array of stochastic, diffusively coupled Ca2+ release units (CRUs) with fixed refractory period. Because previous experimental studies showed that β-adrenergic receptor stimulation increases the rate of Ca2+ release through each CRU (dubbed Ispark), we explored the link between LCRs and Ispark in our model. Increasing the CRU release current Ispark facilitated Ca2+-induced-Ca2+ release and local recruitment of neighboring CRUs to fire more synchronously. This resulted in a progression in simulated LCR size (from sparks to wavelets to global waves), LCR rhythmicity, and decrease of LCR period that parallels the changes observed experimentally with β-adrenergic receptor stimulation. The transition in LCR characteristics was steeply nonlinear over a narrow range of Ispark, resembling a phase transition. We conclude that the (partial) periodicity and rate regulation of the “Calcium clock” in SANCs are emergent properties of the diffusive coupling of an ensemble of interacting stochastic CRUs. The variation in LCR period and size with Ispark is sufficient to account for β-adrenergic regulation of SANC beating rate.
Introduction
A recent concept of cardiac pacemaker function considers sinoatrial node cells (SANCs) to be a system (1,2) of two interacting oscillators: the Ca2+ clock and the classic membrane voltage oscillator (Membrane voltage clock, or M clock, for short) (3). SANCs exhibit spontaneous local Ca2+ releases (LCRs) in the subsarcolemmal space that appear during late diastolic depolarization under normal physiological conditions (4,5) and propagate 4–12 μm (for a detail review of LCR characteristics see (2)).
LCRs are generated by ryanodine receptors (RyRs). These release channels are found in the membrane of the sarcoplasmic reticulum (SR), a major Ca2+ store in the pacemaker cells. The LCRs are spontaneous, and, in particular, they do not require membrane depolarization (6). Because spontaneous activation of rhythmic LCRs persists in chemically skinned and voltage-clamped SANCs (6), the LCRs have been referred to as the Ca2+ clock (2,7). The simultaneous occurrence of multiple LCRs activates the forward mode of the Na+/Ca2+ exchanger, generating an inward current. This current accelerates the diastolic depolarization, which activates the L-type Ca2+ current and ignites a new action potential (AP) (experimental studies (4,5,8), numerical studies (9,10), and a recent review (2)). The chronotropic state of SANCs is controlled by concomitant changes in LCR characteristics, i.e., size, rhythm, and period (see experimental studies (11–13) and recent reviews (1,2)), making LCRs crucial for pacemaker function. Despite the fundamental importance of LCRs, their mechanisms of activation and regulation remain largely unknown.
Here we examine the connection between the local behavior of RyRs and the characteristics of LCRs. Although individual RyRs can open spontaneously when the SR load becomes sufficiently high (14), RyRs are tightly packed in clusters which are normally coupled to L-type Ca2+ channels to form Ca2+ release units (CRUs). RyR opening can be activated by an increase in local [Ca2+] outside the SR, resulting in Ca2+-induced Ca2+ release (CICR) (15). Each CRU can generate a small temporary local Ca2+ increase called a Ca2+ spark (16) of ∼1.5 μm in radius. Therefore, a 4–12 μm LCR likely involves several Ca2+ sparks fired by neighboring CRU via fire-diffuse-fire propagation (17). Sparks' characteristics, such as size and amplitude, are not fixed but can be modulated by β-adrenergic receptor (β-AR) stimulation via variations of the single CRU Ca2+ current (Ispark) (18). We investigate how a change in Ispark affects the period, size, and rhythmicity of LCRs, and we suggest a novel mechanism based on CRU synchronizations to explain several known phenomena.
We use two-dimensional Ca2+ measurements and numerical modeling of diffusively-coupled stochastic CRUs. Our numerical model of local Ca2+ dynamics within SANCs not only reproduces the emergence of almost periodic LCRs observed experimentally, but also makes an important nontrivial prediction: Increasing Ispark amplitude automatically results in local synchronization of CRU firing that increases LCR size, rhythmicity, and rate of LCR occurrence. Thus, our model offers a new Ispark -mediated mechanism of regulation of LCR characteristics (size, rhythm, and period), which ultimately control SANC beating rate.
Experimental Procedures and Data Analysis
SANC isolation
Single spontaneously beating SANCs were isolated from the rabbit hearts, using protocols approved by the Animal Care and Use Committee of our institution, as previously described (19) (animal protocol No. 034LCS2010).
Two-dimensional Ca2+ dynamics measurement in single SANCs
Ca2+ dynamics within a SANC was measured by two-dimensional imaging of fluo-4 fluorescence with a high-speed model No. C9100-0212 charge-coupled device camera (Hamamatsu, Hamamatsu City, Japan) mounted on an Axiovert 100 inverted microscope (Carl Zeiss, Jena, Germany) with a ×63 oil emersion lens and a fluorescence excitation light source (LB-LS/Q17; Sutter Instrument, Novato, CA). Cells were loaded with 1.5 μM fluo-4AM for 10 min at a room temperature. Then fluo-4AM was washed out, and all measurements were performed at a physiological temperature of 35 ± 0.1°C (500 μL chamber volume).
Temperature was controlled by an Analog TC2BIP 2/3Ch Bipolar Temperature controller from Cell MicroControls (Norfolk, VA) that heated the bottom glass of the perfusion chamber and the solution coming to the chamber (via a preheater). The normal physiological solution contained: NaCl 140 mM; KCl 5.4 mM; MgCl2 2 mM; HEPES 5 mM; and CaCl2 1.8 mM, pH 7.3. We also performed experiments in which the cell membrane was depolarized with a high [K+] bath solution contained: NaCl 15 mM; KCl 140 mM; MgCl2 2 mM; HEPES 5 mM; and CaCl2 1.8 mM, pH 7.3. Under this condition, K+ gradient across the cell membrane is presumed to be eliminated, resulting in cell membrane depolarization. Recording was performed for 30–120 s with a frame rate of 10 ms.
Measurement of RyR distribution in SANCs
RyR2 was visualized by antibody staining using anti-RyR (IgG1, clone C3-33; Affinity BioReagents, Golden, CO). For staining methods, please refer to our previous article (20).
Data analysis
Analysis of rhythmicity of local [Ca2+] changes within SANCs (the spot analysis) was performed off-line using sequences of experimentally measured or simulated two-dimensional images of Ca2+ signals. The time sequences of local Ca2+ signals were derived from the images by spatially averaging Ca2+ signals in active SANC image spots (i.e., generating LCRs) of ∼50 μm2 that covers approximately the area of one LCR. The active spots (regions of interest in experimental data sets) were selected within SANCs along the cell's outer border to assess activity mainly in the submembrane space rather than in the cytoplasm (within the resolution of conventional microscopy). We excited Fluo-4 by a relatively low light intensity to avoid cell photodamage and minimize indicator bleaching. The slow decay of the fluorescence signal due to bleaching was excluded by a high-pass filtering of the original signal (0.3 Hz Gaussian-type filter). Our analysis of simulated local Ca2+ dynamics was performed for submembrane spots of 7 × 7 μm2 (i.e., ∼1.9% of the entire submembrane space in our model).
The problem of how to assess signal rhythmicity has been thoroughly investigated in the field of circadian rhythms. Levine et al. (21) show that signal rhythmicity can be easily quantified using autocorrelation analysis. One takes a correlation integral of the signal with itself to estimate how closely the signal repeats itself after a time shift. The Rhythmicity Index is defined as the amplitude of the third peak (the peak at 0 shift is referred as the first peak) of the autocorrelation function.
We simulated three signal time series in which the signal period fluctuated around the basal period (normally distributed fluctuations with a given standard deviation (SD) for each series) and compared this method with the often-used Fourier analysis (Fig. 1). The autocorrelation analysis accurately reveals the basal period and the degree of noise (assessed by Rhythmicity Index) in all three series, even a very noisy one. In contrast, the Fourier power spectrum shows numerous harmonics that make interpretation ambiguous.
Figure 1.
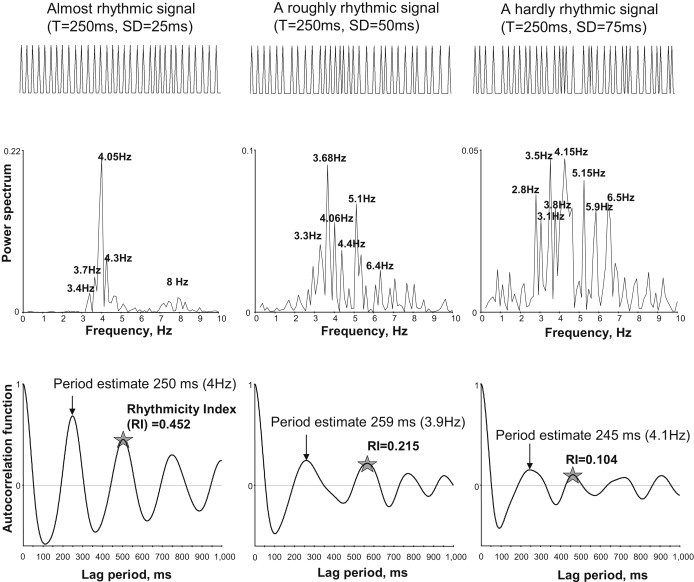
The Rhythmicity Index (stars) is superior versus Fourier analysis (power spectrum) for assessing average period and the degree of rhythmicity of nonperfectly periodic signals. Compared are the results of analyses of three simulated time series of pseudoperiodic signals of different degree of rhythmicity. Simulated periods are normally distributed with mean = 250 ms, SD = 25, 50, and 75 ms. Time series (spike-shaped signals): min = 1, max = 2, duration = 8192 ms, sampling rate = 1 ms.
Autocorrelation analysis of signal time series was performed by the ClampFit-8 program. We used autocorrelation analysis to determine the signal's average rhythmicity (i.e., whether or not the signal is periodic) and, when possible, the period. We also measured interspike intervals between signal fluctuations that crossed a threshold line that was set as minimum + 2 × SD.
Numerical modeling
We developed our model partially based on our new experimental results, and therefore we describe our model, in part, in Results. Full model details (all formulations, parameters, and computational aspects) are provided in the Supporting Material.
Results
Roughly periodic two-dimensional LCR signals in SANCs
Two-dimensional Ca2+ dynamics were measured by a fast two-dimensional camera in SANCs under normal conditions and in SANCs depolarized by KCl. Under normal conditions, the Ca2+ signals exhibit two phases within each cycle (see example in Movie S1 in the Supporting Material). The first (diastolic) phase consists of multiple LCRs which appear relatively synchronously in different locations within the cell and begin to propagate. However, propagation of LCRs does not traverse the whole cell; rather, LCRs propagate locally and then terminate. Later during diastole, LCR merge into the second (systolic) phase of the release, observed as the strong, high-amplitude AP-induced Ca2+ transient. Thus, the diastolic phase of LCRs is not steady but interrupted by the systolic Ca2+ transient. In turn, the AP-induced transient decays and after a short period of inactivity LCRs emerge again, etc., as described previously in confocal microscopy studies (4,5).
In KCl-depolarized SANCs, activation of voltage-gated ion currents is prevented and LCR activity is sustained, although individual LCRs often propagate over a limited region. These persistent LCRs resemble those previously described in SANCs under voltage-clamp, or in skinned cells (6,12). Our autocorrelation analysis of the time series of Ca2+ signal in active spots reveals that waveletlike LCRs are roughly periodic in each spontaneously active cell location with Rhythmicity Index = 0.158 ± 0.019, n = 29 cells, Mean ± SE (see Fig. 1 for comparison with simulated signals). Prior studies in rabbit SANCs demonstrated great cell-to-cell variability of many key characteristics of these cells (22,23). Accordingly, it is not surprising that LCR in SANCs also exhibited cell-to-cell variability in Rhythmicity Index (ranging from 0.03 to 0.464), implying that LCRs range from hardly periodic to almost periodic (see two typical examples in Fig. 2, A and B, and their respective Movie S2 and Movie S3).
Figure 2.
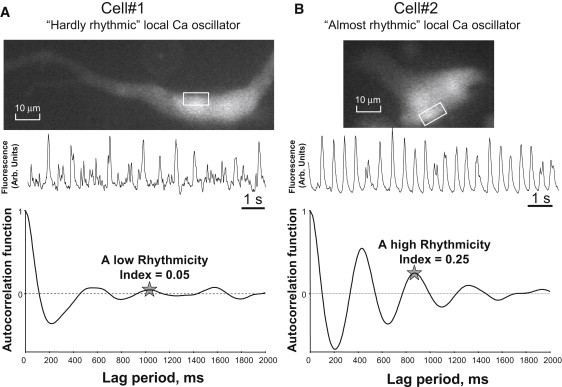
Examples of time series and autocorrelation analysis of local Ca2+ signals of different rhythmicity in SANCs: cell 1 exhibited LCRs of low rhythmicity (A) and cell 2 exhibited LCRs of high rhythmicity (B). The fluorescence time series were measured (middle panels) within active spots generating rhythmic LCRs (within white contours on cell fluorescence images, top panels). (Bottom panels) Autocorrelation function estimates calculated for 42 s and 87 s of LCRs activity in cells 1 and 2, respectively.
Model Development
General
RyRs are localized under the cell surface membrane in SANCs (20,24) and form clusters, calcium release units (CRUs), which are clearly seen in an example of RyR immunofluorescence staining in Fig. 3 A. The average distance between CRUs under the sarcolemma was ∼1.3 μm. Thus, our numerical model of local Ca2+ dynamics of SANCs consists of a two-dimensional array of CRUs (Fig. 3 B) separated by the distance of 1.3 μm mimicking the CRU distribution under the sarcolemma in SANCs. CRUs open stochastically at an average rate controlled by extra-SR [Ca2+] (Casub) (i.e., CICR) to release Ca2+ at a fixed rate Ispark (0.5–2 pA) for a fixed time period of 10 ms (we do not explore the Ca2+ release termination problem here). After release, the CRU remains refractory for a fixed time period (Fig. 4 A). We do not consider here whether the effective refractory period of a CRU is due to inactivation of RyRs, local depletion of SR release terminal Ca2+, or both. The released Ca2+ diffuses within the submembrane space containing the CRUs, and can also diffuse into the body of the cytosol to be taken up (pumped) back by SR Ca2+ ATPase (SERCA) into the SR lumen; Ca2+ can also diffuse within SR lumen (Fig. 3 B, details of model formulations and algorithms are presented in the Supporting Material).
Figure 3.
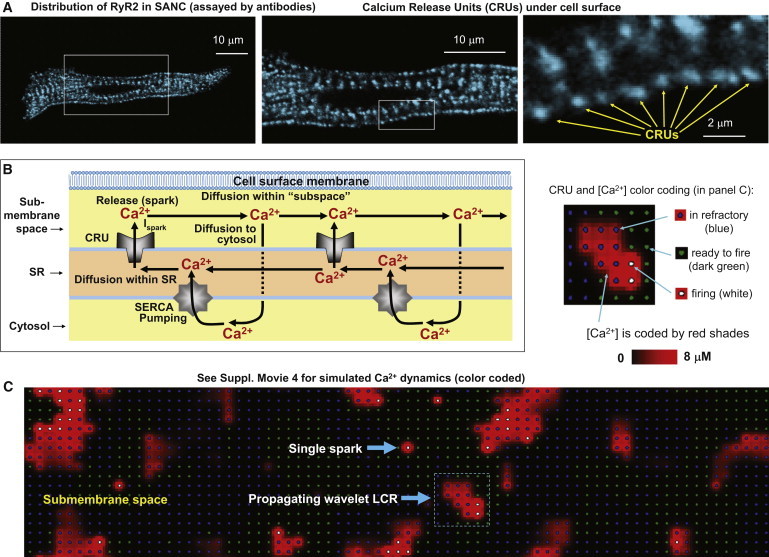
Development of the numerical model of local Ca2+ dynamics in rabbit SANCs: Ca2+ release units (CRUs) and Ca2+ cycling. (A) RyR clusters, i.e., CRUs, are observed in confocal images of immuno-fluorescence in rabbit SANCs under cell surface membrane. (B) Schematic illustration of local Ca2+ cycling through cell compartments (submembrane space, SR, and cytosol). (Arrows) Local Ca2+ fluxes in our model. Ca2+ wave travels from left to right. (C) Instantaneous distributions of local [Ca2+] in the submembrane space predicted by the model: single Ca2+ spark and a wavelet LCRs (propagating from left to right). (Inset) Illustration of color-coding for CRU states and [Ca2+] in the online version of the article and in Movie S4.
Figure 4.
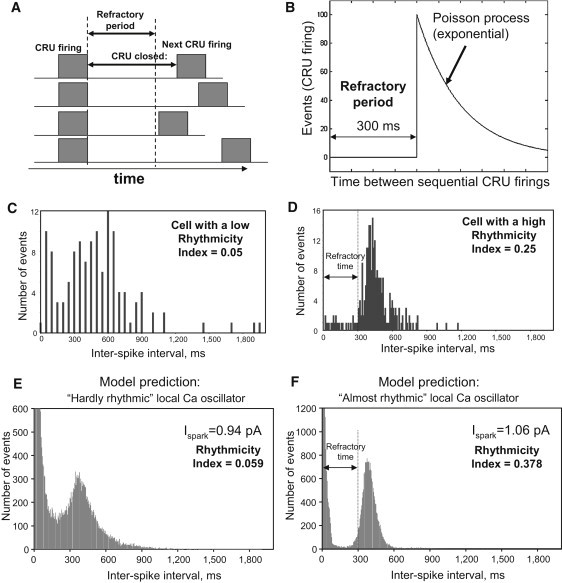
(A) Schematic illustration of the refractory period. (B) Illustration of CRU stochastic firing as a Poisson process after the refractory period, at a given submembrane [Ca2+] level in our model: CRU firing events have a shifted, exponentially distributed interevent time-distribution (times to next opening). (C and D) Experimental interevent time-distributions of LCRs in cells with different Rhythmicity Index. The distribution exhibits a clear time lag with almost no firing, followed by a peak with an abrupt rise and a gradual exponential-like decay in SANCs exhibiting LCRs with high Rhythmicity Index (panel D). This pattern was obscure in cells with LCRs of low rhythmicity (panel C). Results in panels C and D are from same cells shown in Fig. 2, A and B, respectively. (E and F) Numerical model simulations reproduce this experimental result.
Ca2+ release
As an approximation to the distribution of CRU firing intervals, we measured interspike intervals (LCR onset-to-next-LCR onset times) in active cell locations (spots, Fig. 4, C and D). The distribution of the interspike intervals exhibited a time lag during which there was almost no firing, followed by a peak with an abrupt rise and a gradual exponential-like decay. Such a pattern was clearly observed in SANCs exhibiting LCRs with a high Rhythmicity Index (Fig. 4 D), but it was quite obscure in cells with LCRs of low rhythmicity (Fig. 4 C).
Based on these data, we modeled CRU activation as a Poisson process with a fixed refractory period. A Poisson process is defined as a stochastic process in which events happen with a constant probability per unit time. A process is a Poisson process if, and only if, the interevent distribution is exponential. In our model the CRU, outside of its refractory period, operates as a Poisson process (Fig. 4 B) at any given local calcium concentration. We set the probability p for a CRU firing at location (x,y) during the model TimeTick (TimeTick = 0.05 ms) as a nonlinear (power) function of the local submembrane [Ca2+],
| (1) |
where
Our assumptions of the Poisson process for CRU firing and the existence of refractory period are reasonable and based on known properties of RyRs in ventricular myocytes. For example, the gating transition of RyRs to return to a reactivated state (i.e., ready to open state) will contribute to the refractory period (25). Additionally, the activation of a RyR is modulated by SR luminal [Ca2+], which will also contribute to the refractory period (26). When a RyR releases Ca2+, the SR will be locally and, possibly, globally depleted, so the RyR will have to wait for Ca2+ to diffuse within SR and for submembrane Ca2+ to be pumped back into the SR (27). We did not attempt to model the details of these processes.
Experimental and model distributions for the collective behavior of CRUs in Fig. 4, C–F, were similar, allowing us to read off the length of the refractory period of ∼300 ms from the experimental distribution. Of note, the spike between 0 and 100 ms in histogram in Fig. 4, E and F, is caused by [Ca2+] fluctuations/noise (due to stochastic opening/closing of individual CRUs) at the threshold level of event detection when the time course of local [Ca2+] crosses the threshold. This spike is also present in experimental recordings (Fig. 4 C). The scales of the y axis are different in theoretical and experimental studies for the obvious reason that the number of events gathered from a single cell is limited by the duration of fluorescence measurement (120 s maximum).
In cells with relatively higher rhythmicity of LCRs, the CRU firing within LCRs is highly synchronized and, therefore, their refractory periods (if any) must be also highly synchronized. Therefore, we can read off the refractory period from the histogram of interspike firing. It will equal the length of the substantial gap immediately after 0 (Fig. 4 D). In contrast, in cells with less rhythmic LCRs, firing and refractory period of different CRUs are not strongly synchronized. The result in this case is a lack of clear refractory period in interspike histograms (Fig. 4 C). The interspike interval histogram in Fig. 4 D was further interpreted in terms of the theory of stochastic processes. The gradual decay phase after the peak in the histogram is close to exponential, and hence supports our model assumption that each CRU operates approximately as a Poisson process after the refractory period, i.e., fires with a roughly constant probability per unit time (Eq. 1). The combined effect of our two assumptions is that, in the absence of interactions, the times between CRU firings in our model are distributed as an exponential shifted to the right by the length of the refractory period (see Fig. 4 B).
SR Ca2+ cycling
Our model of the cell structure was based on Kurata et al. (28) and our previous rabbit SANC model (10). The sarcolemmal ion currents were not modeled here and were set to zero. To avoid boundary issues, we treated the cell surface as a torus, modeled by a two-dimensional rectangle with periodic boundary conditions. Because a SANC does not have t-tubules and its SR is mainly located under the cell membrane, we introduced three torus-shaped intracellular compartments: the submembrane space (i.e., subspace), the SR, and cytosol (Fig. 3 B).
Each layer is characterized by the distribution of local Ca2+ concentration on a grid (for local accuracy) of 0.34 μm. The SR has two functional elements: the rectangular lattice of CRUs, for Ca2+ release into the subspace, and SERCA, for Ca2+ pumping from the cytosol (Fig. 3 B). Ca2+ released by a CRU can diffuse within the subspace and interact with its neighboring CRUs, if they are ready to fire (Fig. 3 C). Ca2+ can also diffuse within the SR (via the SR network, Fig. 3 B). The subspace has also a direct diffusive connection with cytosol (arrow indicating diffusion to cytosol, Fig. 3 B). All Ca2+ diffusion fluxes are balanced in the model and we can study LCR dynamics both at a steady state and during transitions. The practical implementation of our model was carried out using parallel processing on a cluster of 46 processors. All mathematical formulations (including diffusion, release, and pumping), model parameters, and computational aspects are provided in full detail in the Supporting Material.
Numerical simulations of LCRs at a steady-state: effect of Ispark
Our numerical model simulations of locally propagating, waveletlike LCRs in the subspace (Fig. 3 C, and Movie S4) appeared qualitatively similar to those observed experimentally (Movie S2 and Movie S3). The wavelets propagate in the model as firing CRUs recruit (via CICR) their neighbors at the border of the wavelet front (Fig. 3 C, inset). The wavelets terminate due to stochastic attrition or as a result of having reached a refractory wall (a region with CRUs in the refractory state) created by another previous wavelet.
Ispark increases when β-AR are stimulated, as recently shown by Zhou et al. (18) in ventricular myocytes. The signal from the L-type Ca2+ channel (called a sparklet) and the signal from the RyRs (spark) are separated in time, space, and by amplitude. As shown in Fig. 2 in Zhou et al., β-adrenergic stimulation increased the RyR contribution. Although the trigger for sparks is different in the study of Zhou et al. and in our article—Ca2+ arrives via the L-type Ca2+ channel current in one case, whereas Ca2+ arrives via diffusion from a neighboring CRU in the other—the mechanism of the release is the same: CICR. We therefore assumed that Ispark increases similarly in SANCs.
In the model, we found that Ispark variation had a substantial effect on Ca2+ release synchronicity and on the characteristics of LCRs in the SANC submembrane space. We varied Ispark from 0.5 pA to 1.5 pA and examined LCRs rhythmicity, size, and frequency of occurrence (Fig. 5). At a low Ispark values we observe mainly single sparks or rare couples of neighboring sparks. The frequency of coupled sparks increases as Ispark is increased from 0.5 pA to 0.875 pA. When Ispark reaches 0.875 pA, CRU synchronization begins to emerge and LCRs are in the form of multiple propagating wavelets that include multiple sparks (as described above). As Ispark is increased further (above 1 pA), the CRU firing becomes more synchronized and wavelets increased in size (larger wavelets, Fig. 5). When Ispark reaches ∼1.25 pA, the release pattern is global, periodic waves. The transition from sparks to global waves resembles a phase transition, as it is a drastic change in the behavior of the system occurring within a very small Ispark range.
Figure 5.
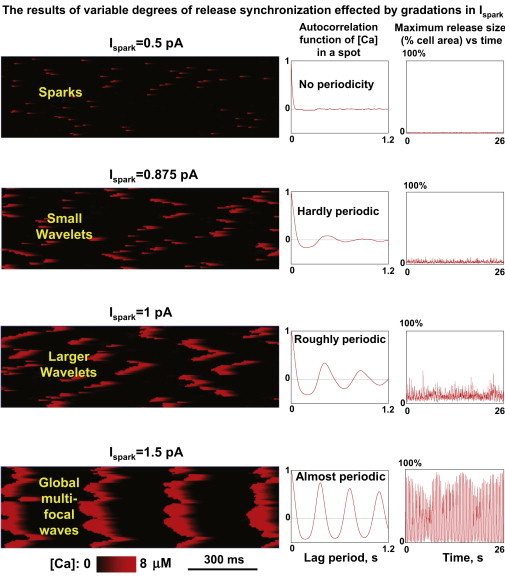
Results of numerical model simulations of local Ca2+ dynamics in the submembrane space at different Ispark. (Left panels) Variable degrees of local Ca2+ release synchronization in line scan images through entire cell length; transition from sparks to global waves. (Middle panels) Autocorrelation function estimate (for 50 s simulations). (Right panels) Instant maximum release size versus time.
The transition of release synchronization can be deduced from the plots of maximum release size in Fig. 5 and in plot of summarized data in Fig. 6 D (the narrow S-shaped curve of the transition sparks-wavelets-global waves). Because autocorrelation functions (Fig. 5, middle panels) assess simultaneously the average period and the Rhythmicity Index (Fig. 1), they reveal that increased synchronization of releases, caused by larger Ispark, results in an increase of rhythmicity and a concomitant shortening of the LCR period. As the CRU current becomes large, LCR period approaches the refractory period (see also Fig. 6 A for overlapped curves of more simulations, and Fig. 6, B and C, for respective summary plots).
Figure 6.
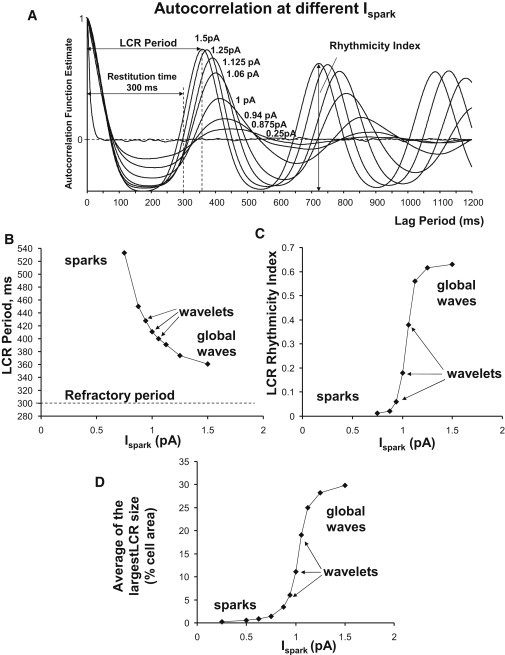
Predicted characteristics of LCRs at different Ispark. (A) Superimposed autocorrelation function estimates (for 50 s simulations). (B) LCR periods assessed from autocorrelation functions. (C) LCR Rhythmicity Index. (D) Time average of the largest LCR size.
Experimental effect of ISO in depolarized cells
We tested whether the effect of LCR rhythm enhancement at larger Ispark could be reproduced experimentally, using β-AR stimulation. To control for SANC cell-to-cell variability, each cell was used as its own control—before and 5 min after application of isoproterenol (ISO), a β-AR agonist. LCR time series measured in the presence of ISO indeed exhibit a higher rhythmicity. One can see the effect even by eye: the number of arrhythmic episodes is smaller (marked by bold lines in representative traces in Fig. 7, A and B). We tested the ISO effect in seven cells and performed autocorrelation analysis of LCR time series in each cell before ISO and in the presence of ISO. All seven cells tested exhibited increase in Rhythmicity Index (see Fig. 7 C for a typical example of ISO effect on autocorrelation function). The effect tended to be smaller in cells (two cells out of seven) with a high Rhythmicity Index in the basal state (before ISO). Mean Rhythmicity Index significantly increased (P < 0.025; paired t-test) in the presence of ISO (Fig. 7 C, inset).
Figure 7.
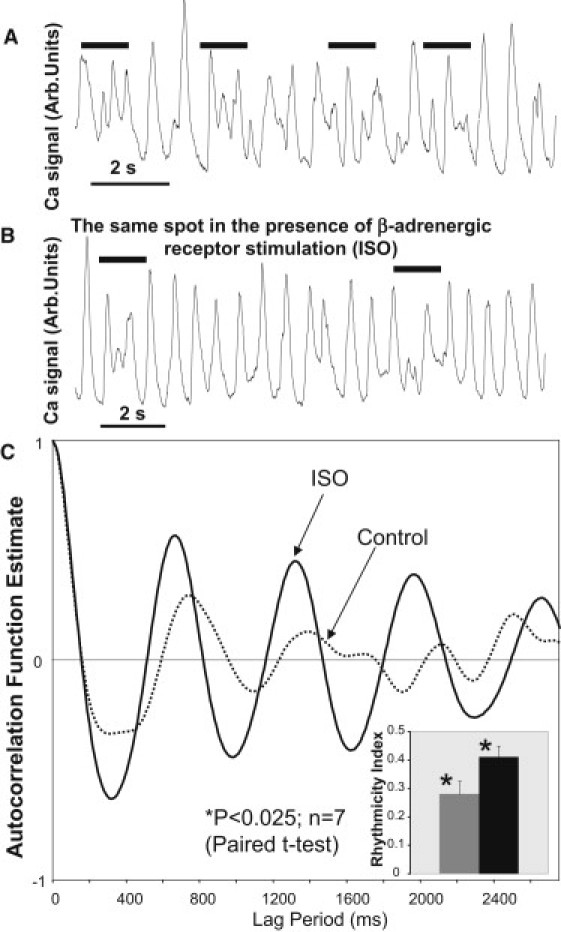
Rhythmicity Index of LCRs increases after β-AR stimulation (isoproterenol, 1 μM, ISO) of depolarized rabbit SANCs (experimental results). (A and B) An example of ISO effect in same cells (before and after ISO, respectively). (Black horizontal lines) Arrhythmic episodes. (C) An example of ISO effect on LCR autocorrelation function. (Inset) Average data show that Rhythmicity Index significantly increased (n = 7 cells).
Simulation of the effect of LCR synchronization by AP during normal beating
The above simulations provide us with crucial insight into the Ca2+ clock regulation in the absence of sarcolemmal currents. In nature, however, the Ca2+ clock will interact with the membrane clock to control pacemaker function. We therefore modeled the behavior of LCRs in a system that has been synchronized by a global action potential.
According to a recent cardiac pacemaker concept (2), L-type Ca2+ current (ICaL) during the AP upstroke triggers a global Ca2+ transient (vertical down pointed arrow in Fig. 8 A) rendering the entire SR in a relatively highly synchronized refractory state (reset in Fig. 8 A). However, after the expiration of the refractory period, the SR begins to spontaneously generate LCRs. These, in turn, contribute to ignition of the next AP by activating inward Na+/Ca2+ exchanger (NCX) current that accelerates the diastolic depolarization of the sarcolemma (vertical up-headed arrows in Fig. 8 A). Acceleration of the SANC pacemaker rate by β-AR stimulation in this new paradigm of “coupled clocks” has been experimentally studied in our laboratory. In particular, it has been shown that more and larger LCRs emerge during diastolic depolarization after β-AR stimulation (see Fig. 8 B for an example of ISO effect from Vinogradova et al. (11)). However, the mechanisms of these changes in LCR patters remain mainly unknown.
Figure 8.
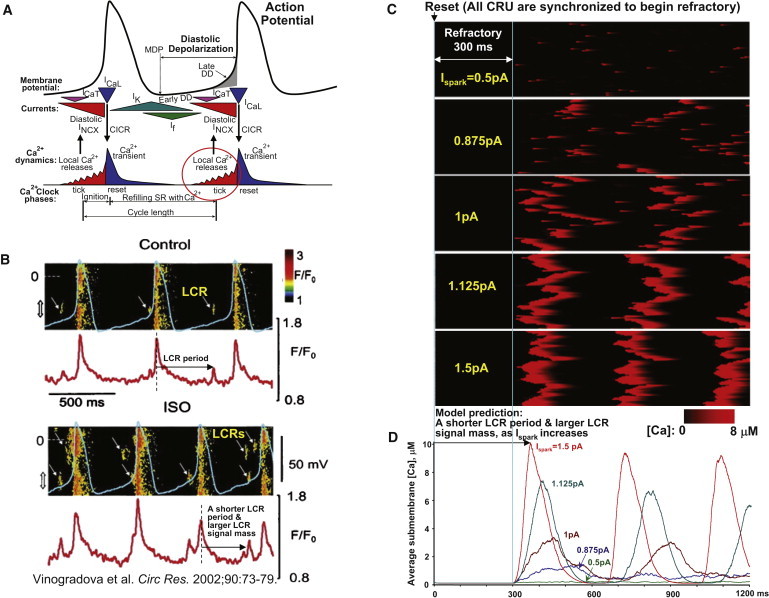
Modulation of cardiac pacemaker function by Ca2+ release synchronization and regulation of LCR period and LCR signal mass due to increasing Ispark. (A) An illustration of a modern cardiac cell pacemaker concept (modified from (2)). The degree of synchronization of LCRs (red circle) is an important factor (in addition to “Refilling SR with Ca2+”) in timely activation of the inward NCX current to prompt next action potential. (B) Previous experimental studies showed that more and larger LCRs emerge during diastolic depolarization in SANCs in the presence of β-AR stimulation. Shown is an example of experimental simultaneous recordings of submembrane Ca2+ signals (confocal line scan images) and membrane potentials before and after ISO. The panel is reproduced from Vinogradova et al. (11). (C and D) Similar to experimental results, our numerical model predicts a shorter LCR period and a larger LCR signal mass (average LCR signal) as Ispark increases in simulations of local [Ca2+] dynamics in submembrane space after all CRU were synchronized to begin refractory period (mimicking reset state in panel A).
Although we did not explicitly model the membrane voltage clock (M clock) here, we still want to get a mechanistic insight into the role of the Ca2+ clock function within the full coupled system, during the crucially important transition period of diastolic depolarization. We mimicked the effect of the M clock on the Ca2+ clock at the beginning of the diastolic depolarization by setting all CRU of our Ca2+ clock model to the beginning of the their refractory state, mimicking the resetting of the Ca2+ clock by ICaL-triggered CICR during the action potential. Technically, we assigned the respective Boolean array of variables to “begin refractory state.” Then we simulated the transition of the Ca2+ clock from the reset state to spontaneous release after the refractory period is over (Fig. 8, C and D, schematically illustrated in Fig. 4 A).
In accordance with the specific aim of this study (see Introduction), we fixed the refractory period, and varied only Ispark, which is reportedly changed by β-AR stimulation (18). Interestingly, our simulations show that the LCRs did not appear immediately after the completion of the refractory period, but with a delay. The pattern of CRU recruitment includes (e.g. Fig. 8 C, panel for Ispark = 1 pA) individual sparks and couples of sparks, followed by waveletlike LCRs. At a higher Ispark (>1.25 pA), the LCRs increase in size to global waves. Our simulations demonstrate that this recruitment delay is strongly regulated by Ispark. As shown in Fig. 8 D, the delay to the first release peak is rather short (66 ms) for large Ispark of 1.5 pA but substantial (219 ms) in the case of Ispark = 0.875 pA. When Ispark is small (such as 0.5 pA), only single or coupled sparks emerge after the refractory period, and the peak of the net spontaneous release is not even formed.
We found that the amplitude of the first spontaneous release after the refractory period is also strongly regulated by Ispark. The larger Ispark amplitudes not only shorten the recruitment delay of the spontaneous release, but concomitantly strongly increase the release amplitude (Fig. 8 D). For example, the amplitude of the spontaneous release increases from 1381 nM to 3400, 7446, and 10,158 nM, as Ispark increases from 0.875 pA to 1 pA, 1.125 pA, and 1.5 pA, respectively.
In summary, Ispark regulates both the time shift and the amplitude of the spontaneous release (Fig. 8, C and D). This could be the mechanism of the effect of β-AR stimulation on LCR characteristics in rabbit SANCs, previously observed with confocal microscopy and perforated patch-clamp recording in our laboratory (compare Fig. 8, B and D: LCR period and LCR signal mass change similarly).
Discussion
The LCR is a key concept in present cardiac pacemaker theory (2) (Fig. 8 A). LCRs control the SANC chronotropy (both acceleration and slowing) via the timing of their appearance during diastolic depolarization, and changes in their signal mass (a combined effect of LCR size, amplitude, and number per cell surface area). However, the mechanisms by which rhythmic LCRs emerge from stochastic RyR channel openings and are regulated by β-AR stimulation remain basically unknown. In our study we analyzed the steady-state distributions of timing for LCR activation (interspike intervals) in depolarized rabbit SANCs (Fig. 4), and, based on these data, we developed the first numerical model that simulates stochastic LCRs in SANCs (Fig. 5).
Ispark regulates LCR synchronization
Based on the recent experimental finding that β-AR stimulation increases Ispark (18), we explored, by means of our new model and measurements of local Ca2+ dynamics in SANCs, how specifically Ispark can regulate release synchronization and LCR characteristics (Figs. 5–8), and contribute to controlling the SANC chronotropy (Fig. 8). Our model predicts that increasing Ispark could explain the LCR rhythm enhancement in depolarized SANCs by ISO (this study, Fig. 7), ISO-induced LCR time shifts, and LCR signal increase during diastolic depolarization, previously shown experimentally in our laboratory (11) (compare Fig. 8, panels B and D).
Our model simulations reveal that the synchronization of RyR spontaneous activation via Ispark is indeed a rather powerful regulatory mechanism: the steady-state LCR period is regulated from ∼533 ms to 361 ms (Fig. 6 B) or in terms of rates from 1.88 to 2.77 Hz, and in simulations of transitions from reset to spontaneous release peak (Fig. 8, C and D), from 519 ms to 366 ms (including 300-ms refractory period).
Note that only Ispark was varied to represent the effect of β-AR stimulation; all other parameters, including restitution time and initial SR Ca2+ content were held constant. This result can be also interpreted to account for the effect on SANC spontaneous beating rate if one considers that LCRs prompt an AP and there is an almost 1-to-1 relation between LCR period and spontaneous cycle length (period) reported in numerous experimental studies with numerous type of interventions (summarized in a recent review (2)). Then the relative reduction in the LCR period predicted here (∼29.5%) with increased Ispark could account for the entire range of periods of spontaneous beating. This range of modulation by release synchronization alone is close to the experimentally observed chronotropic effect of β-AR stimulation in rabbit SANCs (∼20% cycle length reduction) (12), indicating a potential importance of this mechanism in autonomic rate control of pacemaker cells.
Given the predicted importance of Ispark for chronotropic regulation, it is important to consider the several mechanisms by which β-AR stimulation can increase Ispark (although we did not examine the details of these mechanisms in this study). The original publication (18) suggests that the mechanism of a larger Ispark is a result of synchronization of RyRs within each CRU. The authors showed that Ispark increases not only because of larger SR Ca2+ loading, but rather due to intrinsic properties of the RyRs. In turn, the intrinsic RyR function could be enhanced via RyR phosphorylation (e.g., by PKA and/or CaMKII). In rabbit SANCs, phosphorylation of RyRs is indeed increased by β-AR stimulation (12), indicating that this mechanism can indeed be functional in these cardiac pacemaker cells.
Furthermore, SR Ca2+ load is reportedly larger in ISO-stimulated rabbit SANCs, as revealed by caffeine-induced transients (11), which might also contribute to Ispark increase. The SR Ca2+ load, is, in turn, controlled by multiple processes including:
-
1.
The amount of Ca2+ that enters the cell each cycle by Ca2+ influx via L-type Ca2+channels (ICaL).
-
2.
The rate of the SR Ca2+ pump (SERCA), regulated by phospholamban (see details in review (2)).
Function of phospholamban and ICaL is enhanced by β-AR stimulation via PKA- and CaMKII- dependent phosphorylation. Thus, the parameter Ispark summarizes the net effect of multiple pathways of β-AR modulation of SANC beating rate.
The steep dependence of LCR synchronization on Ispark resembles a phase transition, which is plausible because it is based on the increasing cooperation of separate stochastic release units due to their coupling. This cooperativity may be a major underlying explanation for the previously observed steep dependence of SR Ca2+ release on intra-SR Ca2+ concentration in ventricular muscle (15). The latter may exert its principle action via its effect on Ispark rather than its regulatory effect on RyR function, which was not included in our model.
Other regulatory factors
Release synchronization (including regulation by Ispark) is one of the key factors that control LCR activation. Another important factor that was not directly studied here but is extensively discussed in the literature is the release refractory period (we kept the refractory period constant in our model). Indeed, as early as in 1979, a simple description of the intracellular Ca2+ oscillations in cardiac pacemaker cells was suggested as “cycles of Ca2+ uptake and release by the SR” (29), which is consistent with a more recent finding that SR Ca2+ loading has to reach a sufficient level to make spontaneous release possible (14). In addition to the requirement for sufficient SR Ca2+ loading, RyR also exhibits its own refractory period, i.e., a period of time that is required for RyR to move through certain gating states after each opening before it becomes again available to open and fire a new release.
Some studies indicate that the RyR refractory period is also regulated by polymerization/depolymerization kinetics of calsequestrin. Thus the SR oscillatory system possesses a complex refractory period that integrates RyR refractoriness (26), SR Ca2+ refilling kinetics (27), and perhaps other factors including Ca2+ buffering and diffusion (both intra-SR and cytosolic). Because the refractory period includes the requirement for sufficient SR Ca2+ loading, this variable also summarizes the effects of multiple mechanisms (e.g., via PKA and CaMKII signaling) of enhanced function of SANCs in the presence of β-AR stimulation. Because the details of CRU refractoriness are not well understood, we chose to treat it as a fixed constant. Therefore, our model demonstrates the minimal degree of autonomic control that can be expected independently of factors that accelerate CRU recovery.
Spontaneous Ca2+ oscillations in previous studies and this study: comparison
Almost 30 years ago, Fabiato and Fabiato (30,31) discovered Ca2+-induced Ca2+ release from the SR, an organelle that stores Ca2+ in cardiac cells. Having a positive feedback (Ca2+ release begets more Ca2+ release), the SR is an intrinsically unstable system and can produce spontaneous Ca2+ releases under a variety of experimental conditions (32,33). It is well known that those spontaneous Ca2+ releases in ventricular muscle cells are almost periodic and produced by locally propagating CICR in the form of Ca2+ waves but probably do not occur in diastole during normal beating in most species. In contrast, waveletlike LCRs in SANCs are observed under normal physiological conditions and play an important role in SANC function, as described above.
We have recently numerically described spontaneous Ca2+ oscillations in SANCs based on a simple two-compartment SR model (10). Although that lumped model accounted for the overall timing of the LCR-AP cycle, only our present model predicts the fine structure of the spontaneous release (i.e., recruitment pattern; see Results for details) including initial appearance of single sparks and couples of sparks, followed by waveletlike LCRs (recruiting more sparks) which increase in size. This recruitment pattern is similar to that described in our previous experimental report in rabbit SANCs with two-dimensional camera imaging of Ca2+ signals (17).
Study limitations and future perspective
We tuned Ca2+ release formulations based on our experimental results in rabbit SANCs. However, many other important parameters (such as Ca2+ pumping) came from previous SANC models, in which Ca2+ cycling was traditionally modeled based on data from ventricular myocytes. More detailed studies of SANC SR biophysical properties are required to update our model parameters with those specifically measured in SANCs. A next major step will be adding sarcolemmal currents to our model to allow a more precise numerical examination of the coupled system of Ca2+ and membrane clocks.
Although we mainly studied here the effect of CRU coupling, a more realistic treatment of the RyR dynamics underlying the release and refractory periods and the effects of varying SR load would also be appropriate, although that will demand a more thorough understanding of RyR kinetics and be very intensive computationally.
Acknowledgments
The authors thank Magdalena Juhaszova for providing data of RyR immunofluorescence in SANCs (Fig. 3 A).
This work is supported by the Intramural Research Program of the National Institute on Aging, National Institutes of Health, Bethesda, MD.
Supporting Material
References
- 1.Maltsev V.A., Lakatta E.G. Dynamic interactions of an intracellular Ca2+ clock and membrane ion channel clock underlie robust initiation and regulation of cardiac pacemaker function. Cardiovasc. Res. 2008;77:274–284. doi: 10.1093/cvr/cvm058. [DOI] [PubMed] [Google Scholar]
- 2.Lakatta E.G., Maltsev V.A., Vinogradova T.M. A coupled SYSTEM of intracellular Ca2+ clocks and surface membrane voltage clocks controls the timekeeping mechanism of the heart's pacemaker. Circ. Res. 2010;106:659–673. doi: 10.1161/CIRCRESAHA.109.206078. [DOI] [PMC free article] [PubMed] [Google Scholar]
- 3.Noble D. Cardiac action and pacemaker potentials based on the Hodgkin-Huxley equations. Nature. 1960;188:495–497. doi: 10.1038/188495b0. [DOI] [PubMed] [Google Scholar]
- 4.Hüser J., Blatter L.A., Lipsius S.L. Intracellular Ca2+ release contributes to automaticity in cat atrial pacemaker cells. J. Physiol. 2000;524:415–422. doi: 10.1111/j.1469-7793.2000.00415.x. [DOI] [PMC free article] [PubMed] [Google Scholar]
- 5.Bogdanov K.Y., Vinogradova T.M., Lakatta E.G. Sinoatrial nodal cell ryanodine receptor and Na+-Ca2+ exchanger: molecular partners in pacemaker regulation. Circ. Res. 2001;88:1254–1258. doi: 10.1161/hh1201.092095. [DOI] [PubMed] [Google Scholar]
- 6.Vinogradova T.M., Zhou Y.Y., Lakatta E.G. Rhythmic ryanodine receptor Ca2+ releases during diastolic depolarization of sinoatrial pacemaker cells do not require membrane depolarization. Circ. Res. 2004;94:802–809. doi: 10.1161/01.RES.0000122045.55331.0F. [DOI] [PubMed] [Google Scholar]
- 7.Maltsev V.A., Vinogradova T.M., Lakatta E.G. The emergence of a general theory of the initiation and strength of the heartbeat. J. Pharmacol. Sci. 2006;100:338–369. doi: 10.1254/jphs.cr0060018. [DOI] [PubMed] [Google Scholar]
- 8.Bogdanov K.Y., Maltsev V.A., Lakatta E.G. Membrane potential fluctuations resulting from submembrane Ca2+ releases in rabbit sinoatrial nodal cells impart an exponential phase to the late diastolic depolarization that controls their chronotropic state. Circ. Res. 2006;99:979–987. doi: 10.1161/01.RES.0000247933.66532.0b. [DOI] [PubMed] [Google Scholar]
- 9.Maltsev V.A., Vinogradova T.M., Stern M.D. Diastolic calcium release controls the beating rate of rabbit sinoatrial node cells: numerical modeling of the coupling process. Biophys. J. 2004;86:2596–2605. doi: 10.1016/S0006-3495(04)74314-3. [DOI] [PMC free article] [PubMed] [Google Scholar]
- 10.Maltsev V.A., Lakatta E.G. Synergism of coupled subsarcolemmal Ca2+ clocks and sarcolemmal voltage clocks confers robust and flexible pacemaker function in a novel pacemaker cell model. Am. J. Physiol. Heart Circ. Physiol. 2009;296:H594–H615. doi: 10.1152/ajpheart.01118.2008. [DOI] [PMC free article] [PubMed] [Google Scholar]
- 11.Vinogradova T.M., Bogdanov K.Y., Lakatta E.G. Beta-adrenergic stimulation modulates ryanodine receptor Ca2+ release during diastolic depolarization to accelerate pacemaker activity in rabbit sinoatrial nodal cells. Circ. Res. 2002;90:73–79. doi: 10.1161/hh0102.102271. [DOI] [PubMed] [Google Scholar]
- 12.Vinogradova T.M., Lyashkov A.E., Lakatta E.G. High basal protein kinase A-dependent phosphorylation drives rhythmic internal Ca2+ store oscillations and spontaneous beating of cardiac pacemaker cells. Circ. Res. 2006;98:505–514. doi: 10.1161/01.RES.0000204575.94040.d1. [DOI] [PubMed] [Google Scholar]
- 13.Lyashkov A.E., Vinogradova T.M., Lakatta E.G. Cholinergic receptor signaling modulates spontaneous firing of sinoatrial nodal cells via integrated effects on PKA-dependent Ca2+ cycling and I(KACh) Am. J. Physiol. Heart Circ. Physiol. 2009;297:H949–H959. doi: 10.1152/ajpheart.01340.2008. [DOI] [PMC free article] [PubMed] [Google Scholar]
- 14.Györke S., Györke I., Wiesner T.F. Regulation of sarcoplasmic reticulum calcium release by luminal calcium in cardiac muscle. Front. Biosci. 2002;7:d1454–d1463. doi: 10.2741/A852. [DOI] [PubMed] [Google Scholar]
- 15.Bers D.M. 2nd Ed. Kluwer Academic; Norwell, MA: 2001. Excitation-Contraction Coupling and Cardiac Contractile Force. [Google Scholar]
- 16.Cheng H., Lederer W.J., Cannell M.B. Calcium sparks: elementary events underlying excitation-contraction coupling in heart muscle. Science. 1993;262:740–744. doi: 10.1126/science.8235594. [DOI] [PubMed] [Google Scholar]
- 17.Parsons S.P., Vinogradova T.M., Maltsev V.A. Local Ca2+ waves rather than sparks boost the subplasmalemmal Ca2+ rise in late diastole of rabbit sinoatrial node cells: characterization in two dimensions. Biophys. J. 2007 (Supplement):76a (Abstract) [Google Scholar]
- 18.Zhou P., Zhao Y.T., Wang S.Q. Beta-adrenergic signaling accelerates and synchronizes cardiac ryanodine receptor response to a single L-type Ca2+ channel. Proc. Natl. Acad. Sci. USA. 2009;106:18028–18033. doi: 10.1073/pnas.0906560106. [DOI] [PMC free article] [PubMed] [Google Scholar]
- 19.Vinogradova T.M., Zhou Y.Y., Xiao R.P. Sinoatrial node pacemaker activity requires Ca2+/calmodulin-dependent protein kinase II activation. Circ. Res. 2000;87:760–767. doi: 10.1161/01.res.87.9.760. [DOI] [PubMed] [Google Scholar]
- 20.Lyashkov A.E., Juhaszova M., Lakatta E.G. Calcium cycling protein density and functional importance to automaticity of isolated sinoatrial nodal cells are independent of cell size. Circ. Res. 2007;100:1723–1731. doi: 10.1161/CIRCRESAHA.107.153676. [DOI] [PubMed] [Google Scholar]
- 21.Levine J.D., Funes P., Hall J.C. Signal analysis of behavioral and molecular cycles. BMC Neurosci. 2002;3:1–25. doi: 10.1186/1471-2202-3-1. [DOI] [PMC free article] [PubMed] [Google Scholar]
- 22.Honjo H., Boyett M.R., Toyama J. Correlation between electrical activity and the size of rabbit sino-atrial node cells. J. Physiol. 1996;496:795–808. doi: 10.1113/jphysiol.1996.sp021728. [DOI] [PMC free article] [PubMed] [Google Scholar]
- 23.Musa H., Lei M., Boyett M.R. Heterogeneous expression of Ca2+ handling proteins in rabbit sinoatrial node. J. Histochem. Cytochem. 2002;50:311–324. doi: 10.1177/002215540205000303. [DOI] [PubMed] [Google Scholar]
- 24.Rigg L., Heath B.M., Terrar D.A. Localisation and functional significance of ryanodine receptors during β-adrenoceptor stimulation in the guinea-pig sino-atrial node. Cardiovasc. Res. 2000;48:254–264. doi: 10.1016/s0008-6363(00)00153-x. [DOI] [PubMed] [Google Scholar]
- 25.Stern M.D., Song L.S., Ríos E. Local control models of cardiac excitation-contraction coupling. A possible role for allosteric interactions between ryanodine receptors. J. Gen. Physiol. 1999;113:469–489. doi: 10.1085/jgp.113.3.469. [DOI] [PMC free article] [PubMed] [Google Scholar]
- 26.Terentyev D., Viatchenko-Karpinski S., Györke S. Luminal Ca2+ controls termination and refractory behavior of Ca2+-induced Ca2+ release in cardiac myocytes. Circ. Res. 2002;91:414–420. doi: 10.1161/01.res.0000032490.04207.bd. [DOI] [PubMed] [Google Scholar]
- 27.Brochet D.X., Yang D., Cheng H. Ca2+ blinks: rapid nanoscopic store calcium signaling. Proc. Natl. Acad. Sci. USA. 2005;102:3099–3104. doi: 10.1073/pnas.0500059102. [DOI] [PMC free article] [PubMed] [Google Scholar]
- 28.Kurata Y., Hisatome I., Shibamoto T. Dynamical description of sinoatrial node pacemaking: improved mathematical model for primary pacemaker cell. Am. J. Physiol. Heart Circ. Physiol. 2002;283:H2074–H2101. doi: 10.1152/ajpheart.00900.2001. [DOI] [PubMed] [Google Scholar]
- 29.Tsien R.W., Kass R.S., Weingart R. Cellular and subcellular mechanisms of cardiac pacemaker oscillations. J. Exp. Biol. 1979;81:205–215. doi: 10.1242/jeb.81.1.205. [DOI] [PubMed] [Google Scholar]
- 30.Fabiato A., Fabiato F. Excitation-contraction coupling of isolated cardiac fibers with disrupted or closed sarcolemmas. Calcium-dependent cyclic and tonic contractions. Circ. Res. 1972;31:293–307. doi: 10.1161/01.res.31.3.293. [DOI] [PubMed] [Google Scholar]
- 31.Fabiato A., Fabiato F. Calcium-induced release of calcium from the sarcoplasmic reticulum of skinned cells from adult human, dog, cat, rabbit, rat, and frog hearts and from fetal and new-born rat ventricles. Ann. N. Y. Acad. Sci. 1978;307:491–522. doi: 10.1111/j.1749-6632.1978.tb41979.x. [DOI] [PubMed] [Google Scholar]
- 32.Lakatta E.G. Functional implications of spontaneous sarcoplasmic reticulum Ca2+ release in the heart. Cardiovasc. Res. 1992;26:193–214. doi: 10.1093/cvr/26.3.193. [DOI] [PubMed] [Google Scholar]
- 33.Ter Keurs H.E., Boyden P.A. Calcium and arrhythmogenesis. Physiol. Rev. 2007;87:457–506. doi: 10.1152/physrev.00011.2006. [DOI] [PMC free article] [PubMed] [Google Scholar]
Associated Data
This section collects any data citations, data availability statements, or supplementary materials included in this article.