

Abstract
We develop a theory for three states of equilibrium of amyloid peptides: the monomer, oligomer, and fibril. We assume that the oligomeric state is a disordered micellelike collection of a few peptide chains held together loosely by hydrophobic interactions into a spherical hydrophobic core. We assume that fibrillar amyloid chains are aligned and further stabilized by steric zipper interactions—hydrogen bonding, steric packing, and specific hydrophobic side-chain contacts. The model makes a broad set of predictions that are consistent with experimental results: 1), Similar to surfactant micellization, amyloid oligomerization should increase with peptide concentration in solution. 2), The onset of fibrillization limits the concentration of oligomers in the solution. 3), The extent of Aβ fibrillization increases with peptide concentration. 4), The predicted average fibril length versus monomer concentration agrees with data on α-synuclein. 5), Full fibril length distributions agree with data on α-synuclein. 6), Denaturants should melt out fibrils. And finally, 7), added salt should stabilize fibrils by reducing repulsions between amyloid peptide chains. It is of interest that small changes in solvent conditions can tip the equilibrium balance between oligomer and fibril and cause large changes in rates through effects on the transition-state barrier. This model may provide useful insights into the physical processes underlying amyloid diseases.
Introduction
What are the forces that stabilize aggregates of amyloid peptide molecules? This question is of interest because of the putative role played by amyloid aggregation in diseases such as Alzheimer's, Parkinson's, Mad Cow, and type II diabetes (1). Amyloid appears to aggregate into at least two different states: amyloid oligomers, which are small, few-chain soluble disordered clusters, and fibrils, which are long, many-chain highly structured β-sheet-like aggregates. The view has recently emerged that the oligomers may be the toxic species, not the fibrils, as had been expected because of the appearance of plaques in disease (2). It has been challenging to understand the physical principles of amyloid aggregation, in part because of a lack of reductionist experimental model systems. In this regard, we believe that simple models can help guide and interpret experiments.
The first challenge is to discover the extent to which amyloid properties can be explained by equilibrium versus kinetics. Kinetics is often easier to study experimentally because measurement of rates does not require establishing conditions of reversibility. Yet, there is experimental evidence of multiple stable states: monomers, oligomers, and fibrils, and perhaps a precursor to the fibrillar state called the protofilament (3). We believe insights can be gained from first understanding the underlying phase equilibria. A key question is whether or not these observed states are truly stable equilibrium states. It is not always clear. However, we take the view here that the fact that these states are observable on the experimental timescale is evidence that such states are at least metastable. This is a sufficient basis for our modeling here. In this work, we cannot say much about kinetic barriers or timescales; our more modest aim here is to address states that are at least persistent enough to have been observed in experiments.
Various approaches to modeling amyloid aggregation have been taken by others. Algorithms have been developed to determine which amino acid sequences have the propensity to aggregate (4–7). Kinetics models and mass-action models have been proposed to understand the nucleation process and rates of fibril formation (8–13). Here, our focus is different: we are interested in physical equilibria.
Closer in spirit to our focus in this study are models of monomer-fibril equilibria (14–16), but these do not treat smaller soluble oligomers, an additional equilibrium that of key interest to us here. Equilibrium with oligomers has been treated using the thermodynamic models of Lee (17) and Tiana et al. (18). Here, our approach is more microscopic, and we provide a more microscopic interpretation using statistical thermodynamics.
Our work resembles the grand canonical treatment of Lee (17) for the three states, but it goes further in the following respects. First, we make an effort to give a microscopic interpretation of the energies and entropies involved in terms of hydrogen-bonding and zipping interactions. Second, whereas Lee's work focuses on the effects of temperature and pressure, our work focuses on salt, denaturants, and peptide precursor, which, we believe, are more critical to experimental study. Third, our article touches extensively on the broad range of existing experimental data, an important step in validating a model and developing meaningful parameters for realistic systems.
Modeling the States of Amyloid Aggregation
We develop here a model of the equilibrium among the following states: 1), isolated monomeric amyloid peptide molecules in solution; 2), few-chain noncovalent aggregates (oligomers) of amyloid peptide molecules; 3), the single macroscopic thread, called a protofilament, which is a noncovalent ordered assembly of many chains; and 4), the fibril, which is a bundle of protofilaments. These states are shown in Figs. 1 and 2. Fig. 2 is a reference key to help in translating between molecular structures and the simplified brick diagrams we use here. (In this article, the term monomer refers to an individual peptide chain, not to a single amino acid in a chain (Fig. 1 a)) (3,19,20). Our interest here is in peptides, such as Aβ, α-synuclein, and islet amyloid polypeptide, that do not have single-chain native folded structures, so our model below neglects any possible additional equilibria with a native folded structure.
Figure 1.
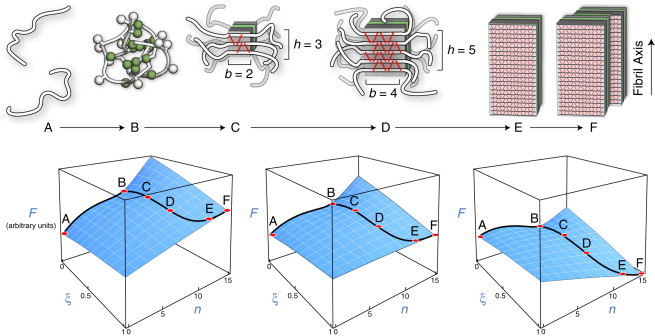
(Upper) Model of amyloid aggregation equilibria. Each black line indicates the peptide backbone. Each red line represents one hydrogen bond. (State A) Isolated peptide monomers in solution. (State B) Oligomeric assembly of a few peptide chains. (State C) Nucleus of β-sheet structure. The peptide backbone runs perpendicular to the fiber axis. (State D) Postcritical nucleus structure showing more β-structure. (State E) A protofilament is a single long thread of β-structure consisting of a β-sandwich and two face-to-face β-sheet planes. (State F) The full fibril, a bundle of protofilaments shown here to contain p = 2 protofilament threads. (Lower) Schematic representations of the free-energy (F) landscape at low (left), intermediate (middle), and high (right) peptide concentrations, as described by our model. Labels correspond to the states depicted above. At low concentrations, the monomer state (state A) is the free-energy minimum, whereas at high concentrations, the fibril (State F) is the minimum. At intermediate concentrations, the solution depends sensitively on the relative stabilities of the fibril and oligomer states.
Figure 2.
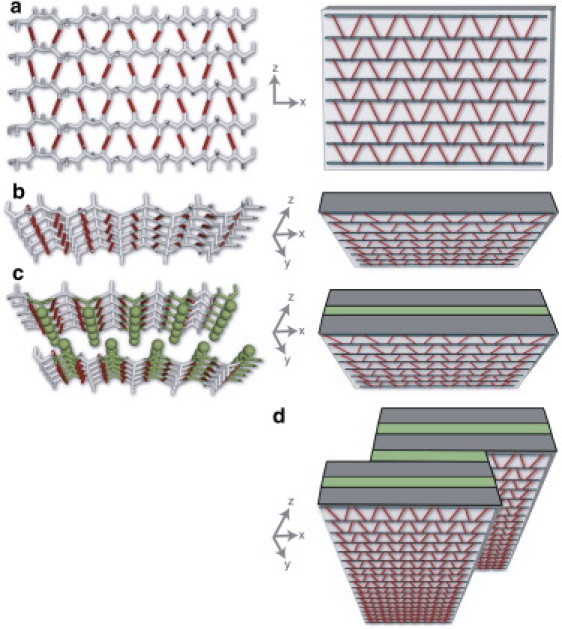
Assembly hierarchy of amyloid fibrils shown in atomistic cartoon representation (left) and schematically, with β-sheets as blocks (right). (a) A single β-sheet comprised of parallel β-strands. (b) A β-sheet observed along the fibrillization axis. (c) Assembled β-sandwich (protofilament) consisting of two β-sheets. Note the steric zipper interactions shown as interdigitating side chains (left) and as a green layer (right). (d) Mature fibril consisting of p = 2 protofilaments.
Modeling the oligomer state
Our model of the oligomer state is shown in Fig. 1 a. Oligomers are known to range in size from trimers to hundreds of monomers (3,19–25). We model the amyloid oligomer state as a disordered spherical globule with a hydrophobic core containing N peptide chains. Each chain has L amino acids. We approximate the free energy of oligomerization, ΔFoligo, from state A to state B (Fig. 1) in terms of the transfer of the NL amino acids from water into the oligomeric core as (26,27)
| (1) |
where kTχ is the free energy of transfer per amino acid and χ is the Flory-Huggins parameter, averaged over the amino acid composition of the peptide and over the solvent accessibilities of the various amino acids. Following recent work (28), we neglect the distinction between interior and surface residues that was drawn in older models (26).
Modeling the protofilament and its nucleus
A common feature of amyloid aggregates observed in NMR and x-ray structures is the β-sandwich motif (Fig. 2 c) (29–33). Here, we assume that the basic structural element of protofilaments and fibrils is the β-sandwich. Before describing our fibril model, we define our terminology for structures that appear throughout this article. A β-strand is a single linear stretch of peptide chain. A β-sheet is comprised of two or more hydrogen-bonded β-strands (see Fig. 2, a and b). A β-sandwich is two planar β-sheets face-to-face (see Fig. 2 c). For example, in the fibrillar state the Aβ molecule is a V-shaped β-hairpin comprised of two β-strands. In amyloid fibrils, the β-sandwich is stabilized by H-bonds parallel to the fibril axis and by hydrophobic and van der Waals interactions from the interdigitation of side chains within the steric zipper between the two β-strands (see Fig. 2 c) (29). At a given stage of fibrillization, we assume that a β-sheet is composed of h β-strands. Each β-strand contributes b amino acids to the β-sheet. The sheet width b must satisfy b ≤ ℓ, where ℓ ≤ L is the length of the β-strands in the mature fibril. At a given stage of fibril formation, the total number of residues in the β state is m = 2bh, where the factor of 2 accounts for the two sheets in the β-sandwich. The quantities b and h are shown schematically in Fig. 1, c and d. The quantity m serves as an order parameter for the extent of fibril formation.
We treat cooperative fibril formation in a way that resembles the standard treatment of the helix-coil transition in peptides (34–38). We call states BCDE the fibril-ordering pathway. The free energy as a function of m is
| (2) |
where m is the order parameter or reaction coordinate along the route BCDE. m ranges from m = 0 when the system is fully disordered (i.e., fully in state B), to m = NL when the system is fully ordered in the β-state (i.e., fully in state E). (Thus, in normalized form, a reaction coordinate could be expressed as ξ = m/NL). The first term in Eq. 2 is the free energy of converting m of the NL amino acids from their oligomeric disordered state, with a corresponding loss of the disordered micellelike hydrophobic interactions.
The second term in Eq. 2, −mlngs, is the free energy of forming a β-sandwich containing m amino acids. gs is a dimensionless propagation equilibrium coefficient that resembles the helix propagation quantity s in helix-coil theories (34,37), except that gs here describes β-structure, not α-helical structure. gs captures various types of interactions, including conformational entropy, hydrogen bonds, steric packing, and ordered side-chain hydrophobic interactions. A necessary condition for fibril formation is gs > 1. That is, fibrils can only form when the sterically zippered state (hydrogen bonds, packing, and ordered hydrophobic interactions) is more favorable than the monomeric state. In this case, the subscript s in gs indicates an interaction within a single β-sandwich, not interactions between the different β-sandwiches that make up a full fibril.
We treat the cooperative formation of fibrils as a surface/interior nucleation process. The third term in Eq. 2, , is the free energy of initiating steric zipping at the edge of the β-sandwich (a square having m/2 residues has a perimeter with residues). In our model, γ is a surface tension for forming the perimeter bonding. In the metaphor of helix-coil theories, γ resembles σ, the helix-coil nucleation parameter. Fig. 1 shows that the edge of the β-sandwich has 2b unsatisfied H-bonds, but only b unsatisfied hydrophobic contacts due to the stagger between the two sheets. It is these missing hydrophobic and H-bond interactions that account for why there should be a barrier, γ < 1, to nucleating the fibril. This nucleation-barrier free energy in Eq. 2 is maximal for b = ℓ. At the current stage of knowledge of microscopic structures, this square-shape approximation has the advantage of simplicity and is adequate to capture the shift in the oligomer-fibril growth transition from hydrophobic to combined hydrophobic and hydrogen-bonding interactions (39).
This model gives insight into fibril formation rates. We compute the free energy of the fibril-formation transition state by finding the maximum value of ΔForder along the reaction coordinate m using Eq. 2. The transition state is at , so
| (3) |
Equation 3 shows that the free-energy barrier can depend strongly on small changes in the intermolecular interactions, since the denominator contains the difference quantity ln(gs) – χ, which will be small. The quantities lngs and χ are dimensionless quantities of order unity; their difference is small, because the zipping free energy is expected to be only slightly more favorable than amorphous hydrophobic interactions. Small variations in gs or χ, at the level of single amino-acid changes or slight changes in solution conditions, could change fibrillization rates by several orders of magnitude (40). This provides a rationale for understanding how a single mutation could transform a normal fibrillization rate, which might be too slow to cause disease in a human lifetime, into a much faster fibrillization rate sufficient to cause disease during a human lifetime.
Our model of the amyloid nucleation process differs from classic nucleation mechanisms in two respects: 1), it involves a one-dimensional line tension (41), rather than a two-dimensional surface tension; and 2), our ordering transition is from oligomers to fibrils, not from monomers to aggregates, so our fibrillization mechanism is not driven by increasing the solution concentration of monomers. This is consistent with experiments showing that amyloid nucleation is concentration-independent (42). The proposed explanation in the nucleated conformational conversion model (42) is that oligomeric chains must enter an activated conformation to proceed to fibrils. In our model, the role of activation is played by the entropically unfavorable steric-zipper nucleus. This activation step is shown qualitatively as the barrier between states B and D in the free-energy landscapes depicted in Fig. 1.
Modeling the full fibril
We treat a full fibril as a collection of p β-sandwich-motif protofilaments stacked and bundled together. Fig. 1 e shows such a fibril for p = 2. ΔFEF is the free energy of bundling protofilaments into fibrils,
| (4) |
where L is the number of amino acids per peptide chain, n is the number of peptide chains in the bundled fibril, and g is the propagation constant for forming β-structure in the mature fibril. Equation 4 gives −lng = −lngs + ɛ, so −lngs is the free energy of the interactions within a single protofilament, and ɛ is the interaction energy holding different protofilaments together. Because these bundling interactions occur only between a subset of residues on the perimeter of the protofilament, we expect that g and gs will be approximately equal.
Within a fibril, a single peptide molecule is sometimes folded back and forth, so it contributes multiple β-strands to the fibril. To account for this, we introduce the parameters ℓ, the length of each β-strand, and ns, the number of β-strands formed by each peptide chain. For example, peptides such as Aβ and islet amyloid polypeptide that form a single hairpin in the mature fibril have ns = 2. These quantities are related by L = nsℓ (see Fig. 3).
Figure 3.
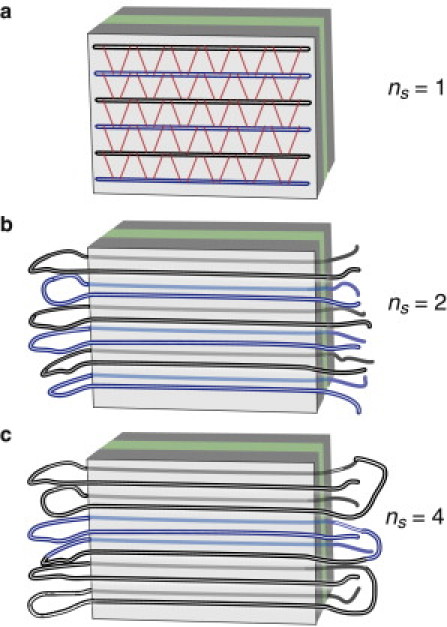
Schematic representation of the parameter ns. Here, each peptide chain contributes one (a), two (b), and four (c) β-strands to the fibril. For clarity, adjacent peptide chains are shown in alternating colors.
From Eq. 2, it is clear that each protofilament incurs a nucleation penalty −kTℓlnγ and that each β-strand in the fibril contributes a binding energy −kTℓlng. However, a more convenient quantity is the binding energy/peptide, −kTℓnslng = −kTLlng. The free energy of a fibril consisting of n peptides is then
| (5) |
The fibrillization index n must be greater than the minimum fibril size n0. However, we find that the physical observables are insensitive to the precise value of n0 (see the Supporting Material). This is in contrast to the oligomer size N, which has a strong affect on phase behavior.
The monomer-oligomer-fibril assembly equilibrium
Now, we combine the stepwise free energies above into a grand canonical ensemble to determine how the assembly equilibria depend on the concentration of peptide monomers in solution. If the oligomeric state resembles a micelle, a reasonable approximation is that the oligomer species is dominated by a single aggregation number, with free energy given by Eq. 1. However, for the fibril, we assume a continuum of aggregation states with n peptide chains and a free energy given by Eq. 5. To compute the properties of the solution, we compute the binding polynomial (43):
| (6) |
In Eq. 6, c1 is the concentration of monomers, c1NeχNL is the concentration of oligomers, and the final term is the sum over the concentrations of fibrils of all possible lengths. The total peptide concentration, c0, can be computed using the concentration of each species and summing the number of peptides in each species. Thus, c0 is written as
| (7) |
where n0 is the smallest accessible fibril size.
The solution-phase behavior is given by the peptide concentrations in each of three states: monomer, c1; oligomer, coligo; and fibril, cfibril, where
| (8) |
and
| (9) |
are the component terms from Eq. 7. The three relative concentration quantities c1/c0, coligo/c0, and cfibril/c0 must sum to 1. It should be noted that both coligo and cfibril are exponentially sensitive to the peptide length, L. To compute the phase diagram, we numerically solve Eq. 7 for c1 at fixed values of c0, g, γ, and χ. The concentrations of peptides in the fibril and oligomer states are then computed from Eqs. 8 and 9.
The model predictions are given below. Fig. 1 shows the energy landscape for aggregation and the corresponding local minima. The figure also shows how changing the peptide concentration tilts the landscape, stabilizing various states. We also show below how other factors, such as denaturants or pH or salts, affect the relative stabilities of the minima.
Results
The model predicts an amyloid triple point, a three-state equilibrium
Fig. 4 shows the phase diagram computed from Eq. 7. The x axis shows the monomer concentration. The y axis shows lng/χ, the ratio of the free energy for a steric zipper to the free energy for amorphous hydrophobic aggregation, for a fixed value of g. The boundaries in Fig. 4 represent the conditions of equal populations of the two corresponding states. In the Supporting Material, we derive analytic expressions for the phase boundaries. These are shown in Fig. 4 by black lines.
Figure 4.
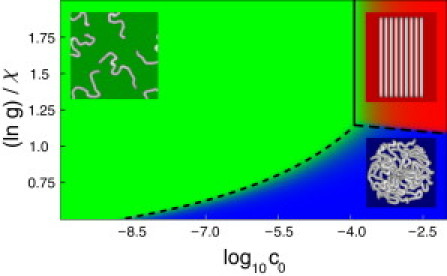
Phase diagram for peptides with p, ns = 1, ℓ = 15, N = 10, lng = 0.6, and lnγ = −2 as a function of peptide concentration and lng/χ. Lines depict phase boundaries computed from Eq. S12 (long-dashed), Eq. S8 (short-dashed), and Eq. S4 (solid). Colors (colored figure available online) show the numerical solution of Eq. 7 as follows: green =c1/c0 (monomers); blue = coligo/c0 (oligomers); and red =cfibril/c0 (fibrils).
The model predicts three main features. First, increasing the amyloid peptide concentration in solution leads to increased aggregation (for both oligomers and fibrils). Second, we were not surprised to find, at high peptide concentrations, changing solution conditions to favor steric zipping tips the balance from oligomers toward fibrils. This phase equilibrium line is relatively flat, indicating that it is not very dependent on monomer concentration. Third, there should be a triple point, a particular monomer concentration and solution condition at which monomers, oligomers, and fibrils are all present in equal populations.
The phase diagram can be closely approximated by comparing the critical fibril concentration (CFC) to the critical oligomer concentration (COC) (see Supporting Material). The lesser of these two quantities determines the aggregate species that appears upon raising the peptide concentration. However, if the COC is less than the CFC, it may be possible to drive the solution from the oligomer state to the fibril state by further raising the peptide concentration. This transition may be computed using the fibril-oligomer coexistence condition (see Eq. S12 and Eq. S26). The converse is not true; it is not possible to reach the oligomer phase from the fibril phase by increasing the peptide concentration. This asymmetry arises from differences in the ability of the oligomer relative to that of the fibril to buffer the monomer concentration. The fibril has an essentially infinite buffering capacity (required for the convergence of Eq. 7), and thus, the CFC sets a hard limit on the achievable monomer concentration. On the other hand, the monomer concentration will still rise, albeit weakly, upon reaching the COC, and therefore, it is possible for the monomer concentration to reach the CFC even after oligomers have begun to form, provided the CFC is not much greater than the COC.
When fibrils are stable, oligomers are not
It is interesting to note that the model predicts that amyloid peptide will be soaked up into the fibrils and depleted from the oligomers, with increasing bulk peptide concentration. To see this, substitute the CFC (Eq. S4) into Eq. 8 to get
| (10) |
This small quantity, e–(lng–χ) < 1, is raised to a large power, LN. Thus, unless χ and lng are closely matched, the concentration of the oligomeric state will be negligible under fibril-forming conditions. The implication for disease is that if oligomers are toxic, promoting fibril formation may deplete the toxins. In essence, the fibril acts as a buffer that controls and limits the pool of oligomers.
Fibril concentration increases as a nonlinear function of monomer concentration
Fig. 5 shows how the predicted fibril population, cfibril, depends on peptide concentration compared with the experiments of Terzi et al. (44). Since the N-terminal 11–16 residues of Aβ40 are disordered (30,45) in the fibril state, we take L = 26. To fit the data, we neglect the oligomer population and convert the experimental concentration, cM (in molar units), to the dimensionless concentrations required in our treatment. As a simple approximation, we divide by the molarity of water to get c = (cM/55.5M). From that fit, we find that −Llng = −13.1 and −pℓlnγ = 15.5 at experimental conditions 278 K and pH 7.4. In the next section, we find similar parameters for α-synuclein fibrils.
Figure 5.
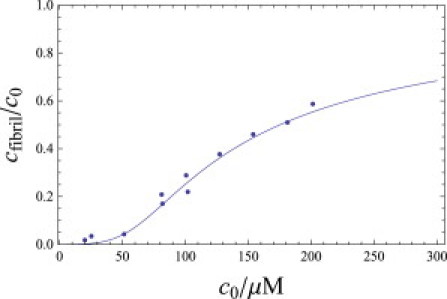
Plot of cfibril as a function of the bulk peptide concentration compared to circular dichroism data of Terzi et al. for Aβ1–40 (44). L = 26, ns = 2, p = 2, g = 1.66, and γ = 0.54.
Fibril lengths undergo a growth transition versus monomer concentration
Now we compute the distribution of fibril lengths. The probability that a fibril has a length n, P(n), is given by
| (11) |
What are the average fibril lengths? In the Supporting Material, we show that the average length scales as c01/2γ–ℓp/2, in agreement with the concentration dependence found by Lee (17). Fig. 6 shows the fit of Eq. 7 (neglecting the oligomer term) and Eq. S14 compared to the average fibril-length measurements of van Raaij et al. (46). From the fit we find, gL, which determines the onset of fibrillization, and we find γℓp, which determines the fibril length. We obtain −Llng = −15.5 and −ℓplnγ = 32.3. In α-synuclein fibrils, it is found that p = 4, twice the value for Aβ fibrils (46). Allowing for this factor of 2, the values of Llng and ℓlnγ are quite similar to those determined for Aβ in the previous section. ns and ℓ are not yet known for α-synuclein.
Figure 6.
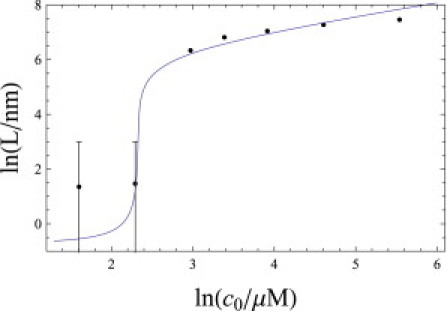
Average length of fibrils versus peptide concentration, and in comparison to experiments on α-synuclein (46). −Llng = −15.5 and −ℓplnγ = 32.3.
Fig. 7 demonstrates the prediction that fibril lengths follow an exponential distribution, which is in quantitative agreement with experimental data (see Eq. S14).
Figure 7.
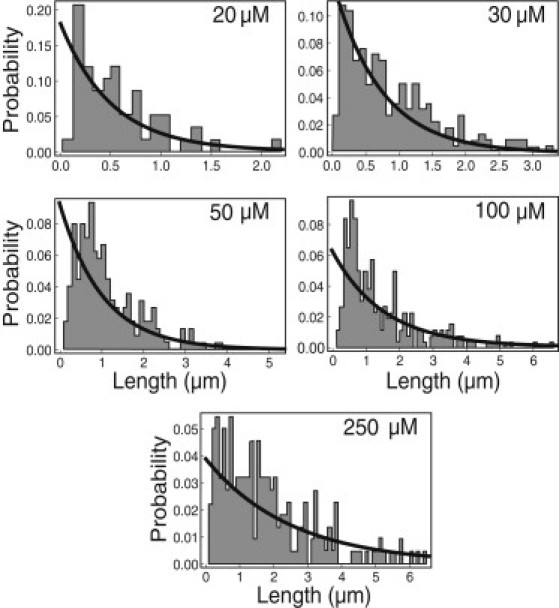
Comparison of the computed fibril length distribution as a function of the bulk peptide concentration to the experimental distributions of α-synuclein for peptide concentrations ranging from 20 to 250 μM (46). −Llng = −15.5 and −ℓplnγ = 32.3.
Denaturants destabilize the fibrils and oligomers
What is the effect of denaturants and osmolytes on amyloid aggregation? First, because both oligomers and fibrils are stabilized by hydrogen-bonding and hydrophobic interactions, denaturants should melt out all types of amyloid aggregated states. A more subtle question is how denaturants shift the oligomer-fibril equilibrium. Fig. 8 shows the model predictions that 1), denaturants such as urea, not unexpectedly, should weaken hydrophobic and hydrogen bonding interactions, disrupting aggregation; 2), more denaturant is required to disrupt aggregates if the amyloid concentration is high; and 3), adding denaturant to fibrils can drive the system into the oligomer state.
Figure 8.
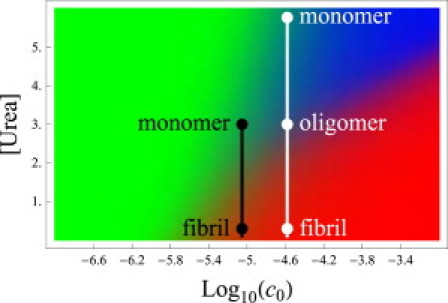
Phase diagram for Aβ as a function of peptide concentration and urea concentration. The colors represent monomers (green), oligomers (blue), and fibrils (red). N = 4 and χNL = 36.4 (19), and all other parameters are identical to those in Fig. 5. This diagram explains a discrepancy between the experiments of Chen and Glabe (19) and Kim et al. (50). The black line indicates the denaturation pathway of Chen and Glabe, who found no intermediate oligomers. For the Kim experiments, denaturation is indicated by the white line and shows an oligomeric state at intermediate urea concentrations.
We make three additional points. First, in apparent contradiction to this prediction, denaturants are sometimes used to promote fibrillization, but that appears to be observed exclusively in systems that have a native folded state (47–49), unlike those modeled here. Second, this model resolves a paradoxical result in the literature. Chen and Glabe found that urea drove fibrils to melt directly to monomers without passing through the oligomer state (19). In contrast, Kim et al. found that urea drove fibrils to melt to oligomers, which then melted to monomers (50). Fig. 8 gives an explanation: the Aβ peptide concentrations used by Kim et al. were 3- to 10-fold greater than those used by Chen and Glabe, shifting to a region of the phase diagram in which oligomers are a stable intermediate phase. Finally, our model predicts the fraction of aggregates as a function of denaturant concentration, which is in good agreement with data (see Table 1) (50).
Table 1.
Computed fraction of peptide in the fibril phase compared to experiment
| Experiment (50) |
Theory |
||
|---|---|---|---|
| [Urea] | Oligomer fraction | Fibril fraction | Fibril fraction |
| 0.4 M | 0 | 0.37 | 0.30 |
| 2 | 0.37∗ | 0.03 | |
| 4 | 0.2 | 0 | 10−3 |
| 6 | 0.22 | 0 | 10−5 |
Experimental data are taken from Kim et al. (50).
Aggregate fraction was observed to be a combination of fibrils and oligomers.
Electrostatic repulsion destabilizes the fibrils
To treat the effects of pH and salt, we express the binding free energy g as
| (12) |
in terms of g0, which accounts for the binding energy for a reference peptide having zero net charge, and an electrostatic component, ΔFes, which is the free energy of charging up the peptides from their uncharged state to a net charge q in the presence of a salt concentration cs. The latter is given quantitatively by Eq. S31.
Fig. 9 compares the calculated electrostatic repulsions with experimental measurements of dependence of the critical concentration on salt concentration. We identify the critical concentrations with the theoretical quantity c1(CFC), which we compute using Eq. 12. We compute charges of q = −3.9 at pH 9.0 and q = −2.8 at pH 7.4 for the Aβ peptide (51). We treat each fibril as a cylinder of radius R = 10 nm (52) using Poisson-Boltzmann theory (see Eq. S31). Fig. 9 shows a comparison of the experiments on the Aβ40 system by Klement et al. for pH 9 (52) and Terzi et al. for pH 7.4 (44). The sole fitting parameter in Fig. 9 (obtained from the Klement data (52)) is −Llng0 = −21.9. This corresponds to −Llng = −15.5 under the conditions of Terzi et al. of pH 7.4 and 5 mM. This is consistent with our earlier estimate, −Llng = −13.1, particularly given the extreme sensitivity of the electrostatic free energy at such low salt concentrations.
Figure 9.
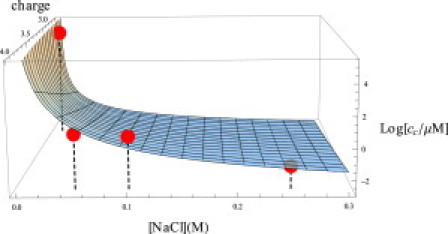
Predicted solubility of Aβ40 as a function of salt concentration and net peptide charge. Data points at q = 3.9 are from Klement et al. (52) and the point at q = 2.8 is from Terzi et al. (44).
Conclusions
We have described an equilibrium theory for the aggregation of short peptides into globular and fibrillar aggregates. The model predicts two transitions: 1), a micellelike transition of monomeric peptides in solution to an oligomeric state, involving a loose hydrophobic core and a loss of translational entropy, and 2), a transition from the disordered globular oligomeric state to an ordered β-structured fibrillar state, driven by tighter packing, hydrogen bonding, and steric and hydrophobic interactions.
We find good agreement of the model with experiments on fibril concentrations, average fibril lengths, and fibril length distributions versus monomer concentrations. We find that the phase boundaries and transition states are highly sensitive to small changes in solution conditions and protein properties. Such sensitivities may be relevant to aggregation processes in amyloid diseases.
Acknowledgments
We appreciate the support of National Institutes of Health Grants GM34993 to K.D. and AG021601 to Stan Prusiner. K.G. acknowledges the Faculty Research Fund from the University of Denver.
Supporting Material
References
- 1.Dobson C.M. Protein folding and misfolding. Nature. 2003;426:884–890. doi: 10.1038/nature02261. [DOI] [PubMed] [Google Scholar]
- 2.Hardy J., Selkoe D.J. The amyloid hypothesis of Alzheimer's disease: progress and problems on the road to therapeutics. Science. 2002;297:353–356. doi: 10.1126/science.1072994. [DOI] [PubMed] [Google Scholar]
- 3.Chimon S., Shaibat M.A., Ishii Y. Evidence of fibril-like β-sheet structures in a neurotoxic amyloid intermediate of Alzheimer's β-amyloid. Nat. Struct. Mol. Biol. 2007;14:1157–1164. doi: 10.1038/nsmb1345. [DOI] [PubMed] [Google Scholar]
- 4.DuBay K.F., Pawar A.P., Vendruscolo M. Prediction of the absolute aggregation rates of amyloidogenic polypeptide chains. J. Mol. Biol. 2004;341:1317–1326. doi: 10.1016/j.jmb.2004.06.043. [DOI] [PubMed] [Google Scholar]
- 5.Tartaglia G., Pawar A., Vendruscolo M. Prediction of the absolute aggregation rates of amyoidogenic peptide chains. J. Mol. Biol. 2008;380:425–436. [Google Scholar]
- 6.Trovato A., Chiti F., Seno F. Insight into the structure of amyloid fibrils from the analysis of globular proteins. PLOS Comput. Biol. 2006;2:e170. doi: 10.1371/journal.pcbi.0020170. [DOI] [PMC free article] [PubMed] [Google Scholar]
- 7.Fernandez-Escamilla A.-M., Rousseau F., Serrano L. Prediction of sequence-dependent and mutational effects on the aggregation of peptides and proteins. Nat. Biotechnol. 2004;22:1302–1306. doi: 10.1038/nbt1012. [DOI] [PubMed] [Google Scholar]
- 8.Pallitto M.M., Murphy R.M. A mathematical model of the kinetics of β-amyloid fibril growth from the denatured state. Biophys. J. 2001;81:1805–1822. doi: 10.1016/S0006-3495(01)75831-6. [DOI] [PMC free article] [PubMed] [Google Scholar]
- 9.Hall D., Hirota N., Dobson C.M. A toy model for predicting the rate of amyloid formation from unfolded protein. J. Mol. Biol. 2005;351:195–205. doi: 10.1016/j.jmb.2005.05.013. [DOI] [PubMed] [Google Scholar]
- 10.Lee C.C., Nayak A., McRae G.J. A three-stage kinetic model of amyloid fibrillation. Biophys. J. 2007;92:3448–3458. doi: 10.1529/biophysj.106.098608. [DOI] [PMC free article] [PubMed] [Google Scholar]
- 11.Powers E.T., Powers D.L. Mechanisms of protein fibril formation: nucleated polymerization with competing off-pathway aggregation. Biophys. J. 2008;94:379–391. doi: 10.1529/biophysj.107.117168. [DOI] [PMC free article] [PubMed] [Google Scholar]
- 12.Knowles T.P.J., Waudby C.A., Dobson C.M. An analytical solution to the kinetics of breakable filament assembly. Science. 2009;326:1533–1537. doi: 10.1126/science.1178250. [DOI] [PubMed] [Google Scholar]
- 13.Kashchiev D., Auer S. Nucleation of amyloid fibrils. J. Chem. Phys. 2010;132:215101. doi: 10.1063/1.3447891. [DOI] [PubMed] [Google Scholar]
- 14.van Gestel J., de Leeuw S.W. A statistical-mechanical theory of fibril formation in dilute protein solutions. Biophys. J. 2006;90:3134–3145. doi: 10.1529/biophysj.105.076000. [DOI] [PMC free article] [PubMed] [Google Scholar]
- 15.van Gestel J., de Leeuw S.W. The formation of fibrils by intertwining of filaments: model and application to amyloid Aβ protein. Biophys. J. 2007;92:1157–1163. doi: 10.1529/biophysj.106.097535. [DOI] [PMC free article] [PubMed] [Google Scholar]
- 16.Wolf M.G., Gestel J., de Leeuw S.W. Modeling amyloid fibril formation: a free-energy approach. Methods Mol. Biol. 2008;474:153–179. doi: 10.1007/978-1-59745-480-3_10. [DOI] [PubMed] [Google Scholar]
- 17.Lee C.F. Self-assembly of protein amyloids: a competition between amorphous and ordered aggregation. Phys. Rev. E. 2009;80:031922. doi: 10.1103/PhysRevE.80.031922. [DOI] [PubMed] [Google Scholar]
- 18.Tiana G., Simona F., Colombo G. Thermodynamics of b-amyloid fibril formation. J. Chem. Phys. 2004;120:8307–8317. doi: 10.1063/1.1689293. [DOI] [PubMed] [Google Scholar]
- 19.Chen Y.R., Glabe C.G. Distinct early folding and aggregation properties of Alzheimer amyloid-β peptides Aβ40 and Aβ42: stable trimer or tetramer formation by Aβ42. J. Biol. Chem. 2006;281:24414–24422. doi: 10.1074/jbc.M602363200. [DOI] [PubMed] [Google Scholar]
- 20.Glabe C.G. Structural classification of toxic amyloid oligomers. J. Biol. Chem. 2008;283:29639–29643. doi: 10.1074/jbc.R800016200. [DOI] [PMC free article] [PubMed] [Google Scholar]
- 21.Bitan G., Kirkitadze M.D., Teplow D.B. Amyloid β-protein (Aβ) assembly: Aβ 40 and Aβ 42 oligomerize through distinct pathways. Proc. Natl. Acad. Sci. USA. 2003;100:330–335. doi: 10.1073/pnas.222681699. [DOI] [PMC free article] [PubMed] [Google Scholar]
- 22.Yong W., Lomakin A., Benedek G. Structure determination of micelle-like intermediates in amyloid beta -protein fibril assembly by using small angle neutron scattering. Proc. Natl. Acad. Sci. USA. 2002;99:150–154. doi: 10.1073/pnas.012584899. [DOI] [PMC free article] [PubMed] [Google Scholar]
- 23.Modler A.J., Fabian H., Damaschun G. Polymerization of proteins into amyloid protofibrils shares common critical oligomeric states but differs in the mechanisms of their formation. Amyloid. 2004;11:215–231. doi: 10.1080/13506120400014831. [DOI] [PubMed] [Google Scholar]
- 24.Lashuel H.A., Petre B.M., Lansbury P.T., Jr. α-synuclein, especially the Parkinson's disease-associated mutants, forms pore-like annular and tubular protofibrils. J. Mol. Biol. 2002;322:1089–1102. doi: 10.1016/s0022-2836(02)00735-0. [DOI] [PubMed] [Google Scholar]
- 25.Conway K.A., Lee S.J., Lansbury P.T., Jr. Acceleration of oligomerization, not fibrillization, is a shared property of both α-synuclein mutations linked to early-onset Parkinson's disease: implications for pathogenesis and therapy. Proc. Natl. Acad. Sci. USA. 2000;97:571–576. doi: 10.1073/pnas.97.2.571. [DOI] [PMC free article] [PubMed] [Google Scholar]
- 26.Dill K.A. Theory for the folding and stability of globular proteins. Biochemistry. 1985;24:1501–1509. doi: 10.1021/bi00327a032. [DOI] [PubMed] [Google Scholar]
- 27.Dill K.A., Stigter D. Modeling protein stability as heteropolymer collapse. Adv. Protein Chem. 1995;46:59–104. doi: 10.1016/s0065-3233(08)60332-0. [DOI] [PubMed] [Google Scholar]
- 28.Ghosh K., Dill K.A. Computing protein stabilities from their chain lengths. Proc. Natl. Acad. Sci. USA. 2009;106:10649–10654. doi: 10.1073/pnas.0903995106. [DOI] [PMC free article] [PubMed] [Google Scholar]
- 29.Nelson R., Sawaya M.R., Eisenberg D. Structure of the cross-β spine of amyloid-like fibrils. Nature. 2005;435:773–778. doi: 10.1038/nature03680. [DOI] [PMC free article] [PubMed] [Google Scholar]
- 30.Lührs T., Ritter C., Riek R. 3D structure of Alzheimer's amyloid-β (1–42) fibrils. Proc. Natl. Acad. Sci. USA. 2005;102:17342–17347. doi: 10.1073/pnas.0506723102. [DOI] [PMC free article] [PubMed] [Google Scholar]
- 31.Sawaya M.R., Sambashivan S., Eisenberg D. Atomic structures of amyloid cross-β spines reveal varied steric zippers. Nature. 2007;447:453–457. doi: 10.1038/nature05695. [DOI] [PubMed] [Google Scholar]
- 32.Wasmer C., Lange A., Meier B.H. Amyloid fibrils of the HET-s(218-289) prion form a β solenoid with a triangular hydrophobic core. Science. 2008;319:1523–1526. doi: 10.1126/science.1151839. [DOI] [PubMed] [Google Scholar]
- 33.Petkova A.T., Yau W.-M., Tycko R. Experimental constraints on quaternary structure in Alzheimer's β-amyloid fibrils. Biochemistry. 2006;45:498–512. doi: 10.1021/bi051952q. [DOI] [PMC free article] [PubMed] [Google Scholar]
- 34.Zimm B., Bragg J. Theory of the phase transition between helix and random coil in polypeptide chains. J. Chem. Phys. 1959;31:526–535. [Google Scholar]
- 35.Schellmann J. The factors affecting the stability of hydrogen-bonded polypeptide structures in solution. J. Phys. Chem. 1958;62:1485–1494. [Google Scholar]
- 36.Lifson S., Roig A. On the theory of helix-coil transition in polypeptides. J. Chem. Phys. 1961;34:1963–1974. [Google Scholar]
- 37.Poland D., Scheraga H. Academic Press; New York: 1970. Theory of Helix-Coil Transistions in Biopolymers. [Google Scholar]
- 38.Ghosh K., Dill K.A. Theory for protein folding cooperativity: helix bundles. J. Am. Chem. Soc. 2009;131:2306–2312. doi: 10.1021/ja808136x. [DOI] [PMC free article] [PubMed] [Google Scholar]
- 39.Auer S., Meersman F., Vendruscolo M. A generic mechanism of emergence of amyloid protofilaments from disordered oligomeric aggregates. PLOS Comput. Biol. 2008;4:e1000222. doi: 10.1371/journal.pcbi.1000222. [DOI] [PMC free article] [PubMed] [Google Scholar]
- 40.Jarrett J.T., Berger E.P., Lansbury P.T., Jr. The carboxy terminus of the β amyloid protein is critical for the seeding of amyloid formation: implications for the pathogenesis of Alzheimer's disease. Biochemistry. 1993;32:4693–4697. doi: 10.1021/bi00069a001. [DOI] [PubMed] [Google Scholar]
- 41.Zhang J., Muthukumar M. Simulations of nucleation and elongation of amyloid fibrils. J. Chem. Phys. 2009;130:035102. doi: 10.1063/1.3050295. [DOI] [PMC free article] [PubMed] [Google Scholar]
- 42.Serio T.R., Cashikar A.G., Lindquist S.L. Nucleated conformational conversion and the replication of conformational information by a prion determinant. Science. 2000;289:1317–1321. doi: 10.1126/science.289.5483.1317. [DOI] [PubMed] [Google Scholar]
- 43.Dill K., Bromberg S. Garland Science; New York, NY: 2002. Molecular Driving Forces. [Google Scholar]
- 44.Terzi E., Hölzemann G., Seelig J. Self-association of β-amyloid peptide (1–40) in solution and binding to lipid membranes. J. Mol. Biol. 1995;252:633–642. doi: 10.1006/jmbi.1995.0525. [DOI] [PubMed] [Google Scholar]
- 45.Petkova A.T., Ishii Y., Tycko R. A structural model for Alzheimer's beta -amyloid fibrils based on experimental constraints from solid state NMR. Proc. Natl. Acad. Sci. USA. 2002;99:16742–16747. doi: 10.1073/pnas.262663499. [DOI] [PMC free article] [PubMed] [Google Scholar]
- 46.van Raaij M.E., van Gestel J., Subramaniam V. Concentration dependence of α-synuclein fibril length assessed by quantitative atomic force microscopy and statistical-mechanical theory. Biophys. J. 2008;95:4871–4878. doi: 10.1529/biophysj.107.127464. [DOI] [PMC free article] [PubMed] [Google Scholar]
- 47.Hamada D., Dobson C.M. A kinetic study of β-lactoglobulin amyloid fibril formation promoted by urea. Protein Sci. 2002;11:2417–2426. doi: 10.1110/ps.0217702. [DOI] [PMC free article] [PubMed] [Google Scholar]
- 48.Ahmad A., Millett I.S., Fink A.L. Stimulation of insulin fibrillation by urea-induced intermediates. J. Biol. Chem. 2004;279:14999–15013. doi: 10.1074/jbc.M313134200. [DOI] [PubMed] [Google Scholar]
- 49.Wang S., Hung Y., Wu J. The formation of amyloid fibril-like hen egg-white lysozyme species induced by temperature and urea concentration-dependent denaturation. Korean J. Chem. Eng. 2007;24:787–795. [Google Scholar]
- 50.Kim J.R., Muresan A., Murphy R.M. Urea modulation of beta-amyloid fibril growth: experimental studies and kinetic models. Protein Sci. 2004;13:2888–2898. doi: 10.1110/ps.04847404. [DOI] [PMC free article] [PubMed] [Google Scholar]
- 51.Sillero A., Ribeiro J.M. Isoelectric points of proteins: theoretical determination. Anal. Biochem. 1989;179:319–325. doi: 10.1016/0003-2697(89)90136-x. [DOI] [PubMed] [Google Scholar]
- 52.Klement K., Wieligmann K., Fändrich M. Effect of different salt ions on the propensity of aggregation and on the structure of Alzheimer's Aβ(1–40) amyloid fibrils. J. Mol. Biol. 2007;373:1321–1333. doi: 10.1016/j.jmb.2007.08.068. [DOI] [PubMed] [Google Scholar]
Associated Data
This section collects any data citations, data availability statements, or supplementary materials included in this article.