Abstract
Motivation: Functional enrichment analysis using primary genomics datasets is an emerging approach to complement established methods for functional enrichment based on predefined lists of functionally related genes. Currently used methods depend on creating lists of ‘significant’ and ‘non-significant’ genes based on ad hoc significance cutoffs. This can lead to loss of statistical power and can introduce biases affecting the interpretation of experimental results.
Results: We developed and validated a new statistical framework, generalized random set (GRS) analysis, for comparing the genomic signatures in two datasets without the need for gene categorization. In our tests, GRS produced correct measures of statistical significance, and it showed dramatic improvement in the statistical power over other methods currently used in this setting. We also developed a procedure for identifying genes driving the concordance of the genomics profiles and demonstrated a dramatic improvement in functional coherence of genes identified in such analysis.
Availability: GRS can be downloaded as part of the R package CLEAN from http://ClusterAnalysis.org/. An online implementation is available at http://GenomicsPortals.org/.
Contact: mario.medvedovic@uc.edu
Supplementary information: Supplementary data are available at Bioinformatics online.
1 INTRODUCTION
Elucidating the functional significance of differences in gene expression, or of patterns of different gene expression regulatory events in the context of existing knowledge about gene function has not only become the most challenging, but also the most rewarding aspect of the genomics data analysis (Rhodes and Chinnaiyan, 2005). The most commonly used strategy relies on sets of reference lists containing functionally related genes, such as Gene Ontologies (GOs; Ashburner et al., 2000) and KEGG pathways (Kanehisa and Goto, 2000), to identify functional categories enriched by the differentially regulated genes.
Statistical methods and computational procedures for identifying functionally related sets of genes that are associated with new experimental data have been studied in detail (Ackermann and Strimmer, 2009; Newton et al., 2007; Sartor et al., 2009; Subramanian et al., 2005; Tian et al., 2005). Two basic approaches are used to establish statistical significance of such enrichment. The first approach relies on counting the number of genes in a given functional category that are also differentially expressed, and using the Fisher's exact or chi-squared tests to establish the statistical significance of such overlaps. The inherent limitation of this type of analysis is the requirement to choose statistical significance cutoff levels for differential expression. This can reduce the statistical power of the analysis (Ackermann and Strimmer, 2009; Newton et al., 2007; Sartor et al., 2009; Subramanian et al., 2005), and different threshold choices may in some situations lead to different enriched categories (Pan et al., 2005). The second approach uses the complete distribution of differential expressions of all genes to identify enriched gene lists, without categorizing them into differentially and non-differentially expressed. Statistically, these methods use either rank-based Kolmogorov–Smirnov-like tests (Subramanian et al., 2005), or the traditional location shift tests (Newton et al., 2007; Sartor et al., 2009; Tian et al., 2005) to identify lists of functionally related genes that are ‘more differentially expressed’ than a randomly drawn list of genes of the same length. Systematic performance assessments established that, in general, ‘location shift’ methods using all data outperform chi-squared- and Kolmogorov–Smirnov-like methods (Ackermann and Strimmer, 2009; Sartor et al., 2009; Tian et al., 2005). In a further refinement of this approach, the ProbCD methodology (Vencio and Shmulevich, 2007) accommodates the use of the complete distribution of differential expression as well as the probabilistic rather than binary assignment of genes to functional categories such as GO by using a probabilistic categorical data analysis approach.
Comparing a new, experimentally derived gene list to other, predefined lists of functionally related genes, while widely used, has its limitations. Despite the large number of such gene lists, they are often not adequate for precisely characterizing functional consequences of experimentally derived genomics profiles. First, functional relationship does not necessarily imply co-expression or co-regulation. For example, only a fraction of genes associated with the same GO term also exhibit coordinated gene expression (Wren, 2009). Consequently, a potentially large portion of genes belonging to a functional category or pathway will never be informative about the association between a genomics profile and the pathway. Second, gene lists associated with a biological concept or process are often incomplete (Pena-Castillo et al., 2008).
The alternative is to use the vast array of public domain genomics datasets currently available through major public repositories (Barrett et al., 2009; Parkinson et al., 2009) to perform functional enrichment analysis by primary genomics data. In this approach, newly generated genomics profiles are directly compared with profiles from a large collection of reference genomics datasets. Functional interpretation of new data is then based on phenotypic characteristics of the reference datasets that have concordant genomics profiles. A number of methods use this approach including EXALT (Yi et al., 2007), expression-based pathway signature analysis (EPSA; Tenenbaum et al., 2008), GEMS (Li et al., 2008) and GEM-TREND (Feng et al., 2009). A related strategy is to identify a set of genes of interest and then search for datasets or genomic profiles where these genes exhibit coherent expression patterns (Caldas et al., 2009; Hibbs et al., 2007; Vazquez et al., 2010). Hibbs et al. (2007) combine this strategy with a subsequent search for additional genes that are closely related to the query set within the identified datasets. Previous methods to search for genes correlated with a set of query genes (Owen et al., 2003) had not first identified the related datasets. All these methods require a set of query genes, essentially categorizing genes into ‘significant’ and ‘non-significant’ based on, for example, a fixed significance threshold [e.g. false discovery rate (FDR) < 0.1], which can result in loss of statistical power as well as biases as is the case in the traditional analysis of gene sets.
Here, we introduce a new statistical framework, generalized random set (GRS) analysis, to assess the concordance in genomics profiles between two datasets. GRS extends the random set (RS) method for functional enrichment analysis by gene lists (Newton et al., 2007) and does not require specification of a significance cutoff for neither the query signature nor the reference datasets. We first describe our approach in detail and then compare our new method to other existing procedures which employ primary genomics data in this way. We find that GRS outperforms the other methods due in part to the loss of statistical power associated with the categorization of genes that is necessary for the other methods. GRS is implemented in the CLEAN R package (available at http://ClusterAnalysis.org/), and the online version is available through Genomics Portals (http://GenomicsPortals.org/) (Shinde et al., 2010).
2 METHODS
2.1 GRS analysis
Suppose that we calculated measures of differential expression and associated statistical significances for a set of genes G and let sg denote a score measuring the level of differential expression for gene g to be used in the analysis. Previously, we demonstrated that defining sg as
| (1) |
is preferable over any other choice of differential expression scores in such setting (Sartor et al., 2009).
Let dg be an index variable for the membership of each gene in a specific functional category F.dg is set to 1 if gene g is the member of the functional category F and it is set to 0 otherwise:
| (2) |
The RS statistics, measuring the overall level of differential expression for genes in F, is defined as the average score for the genes in F.
| (3) |
Under the null hypothesis that there is no enrichment of differentially expressed genes among the genes in category F, the RS statistics is approximately distributed as the normal random variable with the mean μ being equal to the average of sg over all genes and the variance being derived using the simple delta method (Casella and Berger, 2001):
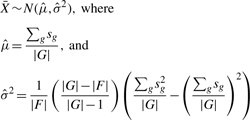 |
(4) |
This method (Newton et al., 2007) can be applied to our problem by simply using one genomics datasets to create the functional category F by declaring only the genes that are differentially expressed for some cutoff, to be members of the category F.
Now, suppose rather than discrete assignments of either ‘differentially’ or ‘non-differentially’ expressed for each gene, we have continuous probabilities of differential expression for each gene g in two datasets (pg1 and pg2). These probabilities can be estimated based on the P-values for differential expression (Sellke et al., 2001). To avoid the need for categorizing genes into ‘significant’ and ‘non-significant’, we propose to compute a statistic E12 by replacing the index variable dg with pg1, while the score sg for the other dataset remains the same as defined in Equation (1). In order to ensure that the statistic remains the same regardless of the ‘query’ and ‘reference’ designation, we make the statistic symmetric with respect to two datasets by also computing the statistic E21 in which the scores and probabilities are reversed and then defining the overall GRS statistic as the average of the two:
 |
(5) |
Defining E in this manner allows us to analytically derive the approximate distribution for the test statistic zE, a standardized version of E, under the null hypothesis of no concordance between the two datasets:
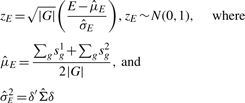 |
(6) |
That is,  is approximated using the multivariate delta method (Casella and Berger, 2001) such that
  and
and  is the estimated variance-−covariance matrix of the random variable X = (X1, X2, X3, X4)′, X1 = p1s2, X2 = p1, X3 = p2s1, and X4 = p2. Details of the derivation can be found in the Supplementary Material.
2.2 Estimating probability of differential expression
We approximate the probabilities of differential expression based on the P-values of differential expression (Sellke et al., 2001). The posterior probability of a gene being differentially expressed is the 1-posterior probability of the null hypothesis and can be estimated as:
| (7) |
| (8) |
However, Equation (8) implies that, a priori, H0 and H1 are equally likely. In other words, the proportion m0 of not differentially expressed genes is assumed to be 0.5. Using the false discovery rate approach (Storey and Tibshirani, 2003), we estimate m0 from the data and modify Equation (7) as follows:
| (9) |
2.3 Identifying genes with concordant patterns
In addition to assessing the existence of the concordant gene expression patterns, it is important to identify genes responsible for this concordance. A straightforward way to rank genes based on the likelihood of concordance is to use the scaled measure Eg of the individual contribution of gene g to the GRS statistics:
| (10) |
where |G| is the total number of genes.
We estimate the null distribution of Eg by first randomly re-assigning gene labels in both, the query and the reference signature and then re-computing Eg for each gene. After repeating this procedure n times, the resulting quantiles are averaged in order to describe the Eg null distribution.
2.4 Data preprocessing, differential expression profiles and gene matching
We use two primary breast cancer gene expression datasets (Miller et al., 2005; Schmidt et al., 2008) and the collection of genome-wide expression experiments systematically assessing small molecule perturbations in vitro (‘Connectivity Map’) (Lamb et al., 2006) in the analysis. Raw data are preprocessed using the RMA normalization procedures (Irizarry et al., 2003) and the Entrez Gene-based custom CDFs (version 10) (Dai et al., 2005).
Statistical significance of differential expression between two groups of samples [e.g. positive versus negative estrogen receptor status (ER+/−)] is assessed using empirical Bayes linear models (Sartor et al., 2006; Smyth, 2004). An average expression signature for a given pair of conditions (e.g. ER+ versus ER−) is computed as the per-gene average difference of log2 expression levels between the conditions.
To match genes across datasets, platform-specific identifiers are first mapped to Entrez gene IDs (Maglott et al., 2005) or, if the datasets are from different species, to Entrez HomoloGene IDs. Next, average P-values (geometric mean) and expression measures (arithmetic mean) for each Entrez ID are computed where necessary, and finally genes are matched across datasets by Entrez ID.
2.5 Other methods to assess gene list concordance
We first compared our GRS analysis to four other methods currently used to identify concordant genomics profiles. All four procedures require subsetting genes into ‘differentially expressed’ and ‘not differentially expressed’ using a statistical significance cutoff (Table 1). In addition, we compared GRS with ProbCD (Vencio and Shmulevich, 2007), a related method that does not require a significance cutoff, but so far has not been used in this context, as well as to more naïve approaches such as using Pearson's correlation or the Wilcoxon rank test. The alternative methods are as follows.
Table 1.
Methods included in the comparisons
| Method (Reference) | Similarity | Signif. cutoff |
|---|---|---|
| measure | ||
| CS (Lamb et al., 2006) | Kolmogorov-Smirnoff statistic | 0.1 FDR (query) |
| EXALT (Yi et al., 2007) | Significance score | 0.2 FDR (query & ref.) |
| ProbCD (Vêncio et al., 2007) | Probabilistic categorization | Not required |
| EPSA (Tenenbaum et al., 2008) | Spearman's correlation | 0.1 FDR (query) |
| LRpath (Sartor et al., 2009) | Logistic regression | 0.1 FDR (reference) |
| Wilcoxon rank test | W statistic | Not required |
| Simple correlation | Pearson, Spearman | Not required |
| GRS | Random set statistic | Not required |
EPSA (Tenenbaum et al., 2008): EPSA was developed to identify the relevant disease-related datasets among a large collection of publicly available microarray data. The EPSA score is defined as the Spearman's correlation coefficient between average differential expression levels in the Query and the Reference datasets for genes with statistically significant differential expression (FDR < 0.1) in the Query dataset. If none of the genes had statistically significant differences in expression then the score is set to zero.
EXALT (EXpression signature AnaLysis Tool) (Yi et al., 2007): EXALT was developed to identify gene expression signatures, which in this case consist of P-values and differential expression levels for all genes, from public databases such as gene expression omnibus (GEO) (Barrett et al., 2009) that are related to a user-defined query signature based on the ‘total identity score’ (TIS). First, genes are considered to be differentially expressed if the FDR (‘Q-value’) is less than 0.2. Each gene is then labeled either U (upregulated), D (downregulated) or X (uncertain) in both the Query and the Reference datasets. The TIS is the weighted sum of Q-scores (i.e. the −log[Q-value]) for concordant genes (U–U, D–D) minus the weighted sum of Q-scores for discordant genes (U–D, D–U). Genes labeled X for either one of the signatures do not contribute to the TIS.
ProbCD (Vencio and Shmulevich, 2007): this approach is designed to address uncertainties in the assignment of genes to functional categories such as the ones represented in GO (Ashburner et al., 2000). The usual association between rows and columns in a contingency table is generalized using probabilities of group membership, and then an empirical P-value of the observed association is determined (Vencio and Shmulevich, 2007). Here, we use the Query and Reference P-values as input, respectively, with default parameter settings and use the ProbCD P-value to rank Reference sets.
CS (Connectivity score) (Lamb et al., 2006): the CS is a widely used non-parametric rank-based method to evaluate the similarity of a query signature (i.e. a list of genes) and a number of reference signatures [e.g. GSEA (Subramanian et al., 2005), GEM-TREND (Feng et al., 2009), SCSS (Toyoshiba et al., 2009) and MARQ (Vazquez et al., 2010)]. Differentially expressed genes in the Query dataset (FDR ≤ 0.1) are used as the query list and tagged ‘up’ or ‘down’, respectively, based on their average expression signature. The CS is then computed using the average reference expression signature to compute a metric based on the Kolmogorov–Smirnov statistic as described in Lamb et al. (2006) which compares the ranks of the query genes with the corresponding ranks in the reference signature.
LRpath (Sartor et al., 2009): LRpath is a logistic regression-based method to identify lists of biologically related genes (‘functional category’) that are overrepresented in a query signature. It has also been recently applied to assess gene list concordance (Shinde et al., 2010). Instead of predefined functional categories, we use the list of differentially expressed genes in the Query dataset (FDR ≤ 0.1). The LRpath P-value is then computed as described in the original publication by testing the differential expression enrichment in the Reference datasets.
Wilcoxon signed rank test (Wilcoxon, 1945): this is a pairwise non-parametric test. We rank pairwise comparisons of the Query and Reference datasets by the respective W statistic assuming that datasets with the smallest W statistic are the most similar.
Correlation coefficients: we compute Pearson's and Spearman's correlation between the Query and Reference datasets for both, P-values and –log transformed P-values. The higher the correlation coefficients are the higher is the concordance between the profiles.
2.6 Comparing GRS to other methods
To compare GRS to other methods, we test their ability to identify concordant expression profiles defined by the ER status of human primary breast tumors between two independent datasets, as well as expression profiles defined by perturbations that are caused by a number of small molecules (Lamb et al., 2006).
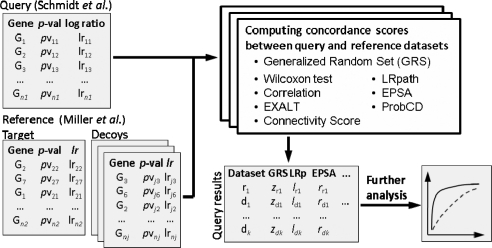
Breast cancer datasets (Miller et al., 2005; Schmidt et al., 2008): for each iteration, we define a Query dataset of size 2N (N = 2 … 10) by randomly selecting N samples without replacement among ER+ and N samples among ER− samples in the Schmidt dataset (Schmidt et al., 2008). The Reference datasets are constructed using samples from an independent primary breast cancer dataset (Miller et al., 2005) and consist of a single Target that is constructed in the same way as the Query dataset, and 20 Decoys for which two groups of samples of size N are selected randomly from all remaining samples. Using the eight different methods (Table 1), we compute respective 21 scores between the Query and Reference datasets and rank Reference datasets based on these scores. We repeat this procedure 500 times for each N (Fig. 1).
Fig. 1.
Computational study for assessing abilities of different methods to distinguish between Target and Decoy datasets constructed from samples in the Miller (Miller et al., 2005) dataset using the Query dataset based on samples from the Schmidt (Schmidt et al., 2008) dataset.
Connectivity map dataset (Lamb et al., 2006): here, we use the same principle to generate Query and Reference sets except Decoy datasets that are based on the true gene expression profiles for perturbants that are different from the Query perturbant. For Query datasets, we randomly draw without replacement a subset of size N from the pool of samples treated with the same compound (e.g. estrodial, wortmannin, etc.) and then draw N samples from the pool of corresponding control samples. For Target datasets, we randomly draw without replacement a subset of size N from remaining pool of samples treated with the same compound and from remaining controls, respectively. For a Decoy dataset, we draw N samples from a sample pool treated with a compound other than the query compound and N samples from its corresponding controls.
Receiver operating characteristics: to compute the true positive rate (TPR), we consider only the Query–Target pair a true match, any Query–Decoy pairing is considered false match. For a fixed sample size, we construct receiver operating characteristics (ROCs) curves based on the rankings of each Query–Reference pair in 500 trials. For the fixed ranking threshold t (t = 1,…, 20), TPRs are defined as the proportion of trials for which the rank of Query–Target score is less than t and false positive rates are the average proportion of Query–Decoy ranks less than t. In case of ties, ranks are assigned randomly among the tied scores. For each sample size, we construct ROC curves by varying t from 1 to 21, and summarize them by calculating the area under each such ROC curves (AUC).
3 RESULTS
We implemented our new approach and the other methods listed in Table 1 and performed a comparison study using expression data from primary human breast cancers (Miller et al., 2005; Schmidt et al., 2008) and the Connectivity Map (Lamb et al., 2006). We then evaluated each method based on their ability to correctly identify a Target signature concordant with a Query signature among a number of unrelated Decoy signatures. This approach allows us to estimate the specificity and sensitivity of each method, while mimicking the functional analysis by primary genomics data where the researcher compares a new dataset (Query) to a diverse collection of existing genomics datasets (References) in order to identify gene signatures that are similar to the Query.
3.1 Evaluating GRS measures of statistical significance
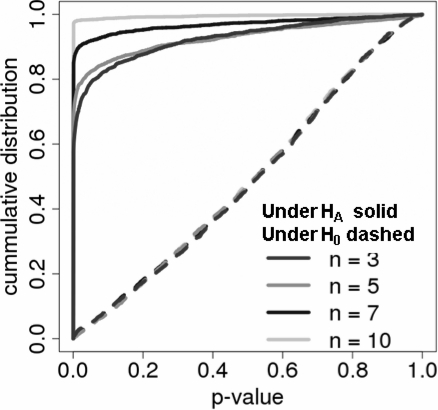
To assess how well our null distribution approximates the true null distribution, we plotted the average cumulative distribution of P-values for different sample sizes (Fig. 2) under the null hypothesis of no concordance (dashed lines) and the alternative hypothesis (solid lines). The distribution under the null hypothesis was simulated by randomly permuting gene labels in the Decoy datasets, while leaving the expression data intact. The cumulative distribution of P-values under the null hypothesis fell on the diagonal line indicating perfect control of the Type I error rate. Supplementary Figure 1 shows the distribution of the GRS score under the null hypothesis for increasing N using histograms (Supplementary Fig. 1A) and quantile–quantile plots (Supplementary Fig. 1B) indicating that the GRS score is approximately standard normal as expected. Under the alternative hypothesis (solid lines in Fig. 2), P-values were highly enriched by small P-values and enrichments increased with the increased sample size indicating increasing statistical power to detect the concordance.
Fig. 2.
Cumulative distribution of GRS P-values under the null hypothesis (dashed) and Query versus Targets (solid) comparisons using the two breast cancer datasets.
3.2 Evaluating methods using subsampling of breast cancer datasets
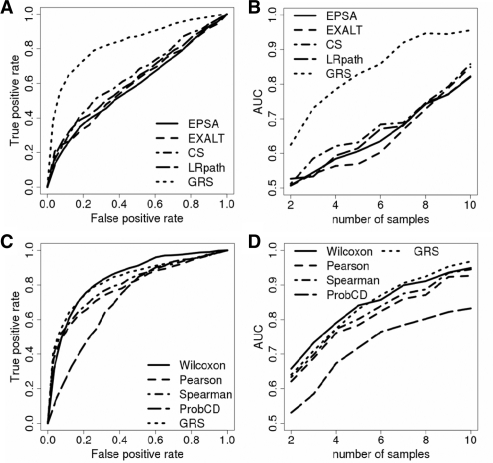
To compare our GRS approach to methods currently used for assessing gene list concordance (EPSA, EXALT, Connectivity Score and LRpath), we tested their ability to identify concordant expression profiles defined by the ER status of human primary breast tumors among a number of Decoys. The analysis was performed and ROC curves established for a series of sample sizes N. Figure 3A shows the ROC curve for N = 5. GRS (dashed line) clearly outperforms the other methods producing significantly higher TPRs for any given FPR. ROC curves were summarized for each N by calculating the area under each such curve (Fig. 3B). Our GRS method provided dramatic improvement in precision over four alternative approaches which all rely on designating ‘differentially expressed’ genes. For example, when N = 5, allowing 10% false positives will, on average, resulted in 70% TPR for our GRS method and only ∼40% TPR for other methods (Fig. 3). Figure 3C and D show similar ROC and AUC plots for the simple alternative statistical methods that do not require significance cutoffs. In this case, GRS does not appear to outperform the Wilcoxon test and the correlation coefficients. To test if this result is due to the large number of concordant genes in this particular situation, we re-labeled an increasing number of randomly selected genes in the target signature and computed the AUC (Supplementary Fig. 2). As the number of ‘scrambled’ genes increases, the AUC for the correlation methods and the Wilcoxon test rapidly approach the 50% mark while GRS remains relatively high even for 80% ‘scrambled’ genes.
Fig. 3.
ROC curves comparing the performance of different methods for the breast cancer data (Miller et al., 2005; Schmidt et al., 2008). (A, C) Examples of the ROC curves for a fixed samples size (N = 5). (B, D) Areas under the ROC curves for different methods and sample sizes (N = 2, 3,…, 10).
To evaluate the effect of choosing the number of decoys (20) and the number of trials (500), we repeated these experiments for GRS for different numbers of decoys (Supplementary Fig. 3) and trials (Supplementary Fig. 4). Increasing the number of decoys allows us to increase the number of data points in the ROC curves, but it does not affect the accuracy of ROC curves (Supplementary Fig. 3). Similarly, increasing the number of trials does not affect the accuracy of ROC curves but reduces the error associated with each data point of ROC curve and consequently the AUC (Supplementary Fig. 4). Finally, increasing the number of targets has no discernible effect on the ROC curves (Supplementary Fig. 5).
Fig. 4.
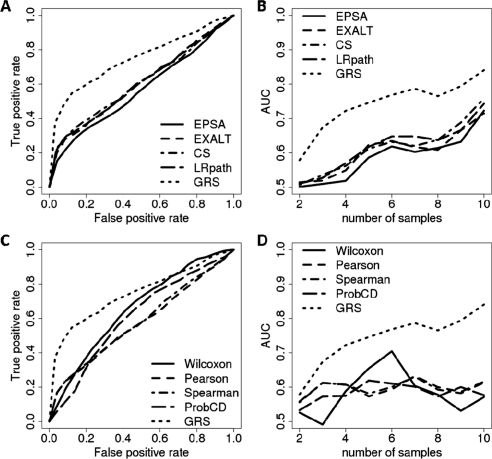
ROC curves comparing the performance of different methods for the Connectivity Map data (Lamb et al., 2006). (A, C) Examples of the ROC curves for a fixed samples size (N = 5). (B, D) Areas under the ROC curves for different methods and sample sizes (N = 2, 3,…, 10).
Fig. 5.
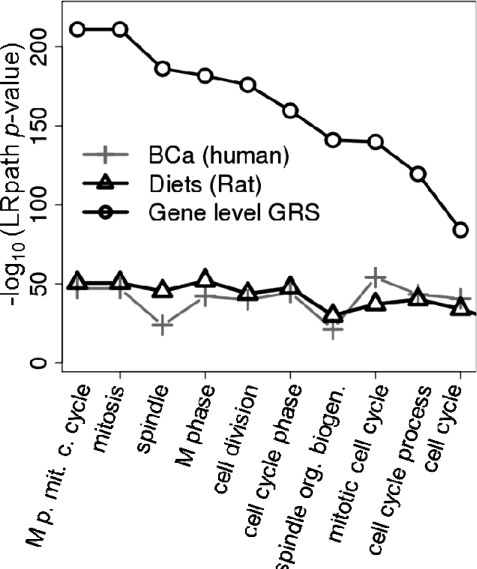
Precision of functional analysis is greatly improved by combining two proliferation-related datasets.
3.3 Evaluating methods using the Connectivity Map
In this case, we tested the ability of different methods to identify datasets generated by using the same ‘perturbant’ as used in the Query dataset. This time, Decoy datasets were not formed based on randomly permuted data, but based on the true gene expression profiles for perturbants different from the Query perturbant. As with the breast cancer data, GRS outperformed alternative methods across all sample sizes, while all methods had increased statistical power with increased sample size (Fig. 4). All methods performed worse in this setting than in the breast cancer data. This is most likely due to the fact that most Decoys in the breast cancer data are true decoys since they are based on randomly permuted sample labels, whereas at least some of the decoys generated in the Connectivity Map setting could be similar to the Target as multiple perturbants can affect the same biological processes and hence produce highly concordant transcriptional signatures. It is also possible that transcriptional signatures include fewer genes than the signatures distinguishing ER+ from ER- breast tumors. In that case results are expected to be similar to what we observe after re-labeling a certain portion of genes in the breast cancer dataset as we did in the previous section.
3.4 Identifying genes with concordant patterns
We examined the utility of the gene-level scores (Eg) to identify genes associated with overlapping patterns of expression. As an example, we used two gene expression datasets comparing samples with different proliferation levels in two very distinct biological systems: diets-induced differential proliferation in normal rat mammary epithelium (Medvedovic et al., 2009) and differential proliferation of primary human tumors of different histologic grades (Grade 3 versus Grade 1) (Schmidt et al., 2008). The GRS indicated the existence of a strong concordant gene expression signature in the two datasets (GRS, P < 10−50). The functional analysis of individual datasets using LRpath (Sartor et al., 2009) against GOs (Ashburner et al., 2000) indicated the strong enrichment of cell-cycle-related genes. Using LRpath with gene-level GRS scores (Eg) as the independent variable, we compared the statistical significance of enrichment of top 10 GO terms with results based on individual datasets (Fig. 5). All top 10 GO terms were cell-cycle related and there was a dramatic increase in the statistical significance of these GO terms over the analysis of individual datasets. This indicates that GRS analysis was able to effectively identify genes associated with the concordant profiles in the two datasets and accentuate their importance in the functional analysis.
3.5 Example: diets proliferation signature
To demonstrate how the GRS framework can be used to functionally annotate a newly generated genomics dataset, we continue the example shown in Figure 5 involving diets-induced gene expression changes in normal rat mammary epithelium (Medvedovic et al., 2009). First, we used our web interface (Shinde et al., 2010) to analyze a single reference dataset (query: dataset ‘BcercDiets’, parameter ‘Diet’; reference: dataset ‘GSE11121Entrez’, parameter: ‘Grade 1’ versus ‘Grade 3’). The resulting gene list contained 7814 common genes where 123 (396) genes had a gene-specific GRS score greater than the 99th (95th) percentile. These genes were highly enriched for proliferation-related pathways, which can be viewed by clicking on the corresponding link on the result page. A heatmap for the top 396 genes showing the relative expression levels for the two datasets can be found in Supplementary Figure 6. A comparison with the distribution of absolute GRS scores among a collection of 2980 human reference signatures obtained from GEO (Barrett et al., 2009) shows that 1.7% of all pairwise comparisons between these signatures have a GRS score as high as or higher than the observed score for the diets versus breast cancer signature comparison (Supplementary Fig. 7). As a ‘negative control’ system that is not related to increased proliferation, we use a signature comparing estrogen (E2)-treated samples without ectopic expression of the estrogen receptor (ESR1) to control samples (Moggs et al., 2005; GEO accession GDS1326). As expected, this signature shows no concordance with the diet proliferation signature (GRS score = 0.53, P = 0.59).
Fig. 6.
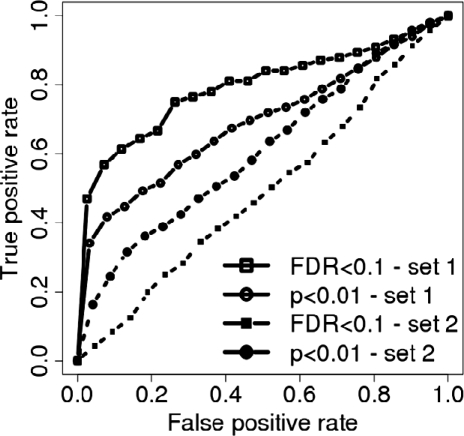
Effect of significance cutoff choice. In this example, we use Connectivity Map data (Lamb et al., 2006) to compute the EPSA score for two sets of Query and corresponding Reference signatures as described (N = 5) and compute the respective ROC curves. Query set 1 is a set of compound-vehicle comparisons with a relatively large number of genes with low P-values. Set 2 is a more ‘difficult’ set of comparisons where the number of differentially expressed genes for each signature and cutoff is lower. For set 1, the FDR cutoff results in a better ROC curve than for P-value cutoff (upper two curves) while for set 2, the less conservative P-value cutoff produces a better ROC curve than the FDR cutoff (lower two curves).
Next, we used the procedures implemented in the R to analyze the 2980 GEO signatures and 3135 signatures derived from Connectivity Map (Lamb et al., 2006). Both reference sets yielded concordant signatures with highly significant GRS scores that complement the proliferation-related functional annotations found by traditional methods. The GEO reference datasets with the most significant scores include a comparison of mesenchymal and proliferative cells in gliomas (accession GDS1815), breast cancer cells with inactivated FOXM1 transcription factor, and (GDS1477) breast cancer cells affected by 17β-estradiol (GDS2324) (Supplementary Table 1). The most concordant perturbation signatures are caused by compounds (etoposide and methotrexate) that are commonly used in cancer chemotherapies and inhibit DNA replication. The third most significant compound (monobenzone) also is a cytotoxin that is used for depigmentation therapy but its working mechanism is not yet fully understood (Supplementary Table 2).
4 DISCUSSION
We have developed a new method to assess the concordance of gene signatures. The new method was compared with other existing methods evaluating their ability to identify genomics datasets similar to a query dataset based on their respective gene signatures. The ultimate goal of such analysis is to use the phenotypic characteristics of the identified reference sets to elucidate underlying molecular functions of the genomic profile in the new dataset. Comparisons were made with methods specifically used in this context, as well as alternative statistical methods that are applicable in this setting.
All of the currently used methods (EPSA, EXALT, CS and LRpath) use a significance cutoff to designate which genes are differentially expressed in the Query dataset. However, the a priori choice of the optimal cutoff is a difficult problem. A too restrictive cutoff leads to a low number of genes in the signature, particularly in experiments with small sample sizes. Choosing less restrictive cutoffs, on the other hand, often leads to high numbers of genes in the signature which then results in reduced specificity when computing the concordance measures. To illustrate the impact of the cutoff choice on subsequent concordance analyses, we used the Connectivity Map data (Lamb et al., 2006) to first calculate the EPSA score for two sets of Query and corresponding Reference signatures as described (N = 5) each time using (i) a stringent significance cutoff (FDR < 0.1) and (ii) a less conservative one (P < 0.01). We then computed the respective ROC curves (Fig. 6). Query set 1 is a set of compound-vehicle comparisons with a relatively large number of genes with low P-values. Set 2 is a more ‘difficult’ set of comparisons where the overall number of significant P-values is lower for each signature and cutoff choice (Supplementary Fig. 8). In the former case, the FDR cutoff was the better choice (i.e. the ROC curve for the FDR cutoff is above the curve for the P-value cutoff) as it resulted in Query signatures that were more informative for the concordance assessment compared with a larger signature based on a less-conservative cutoff containing many uninformative genes. In the latter case, however, FDR proved to be too restrictive not producing a sufficiently large gene signature and the P-value-based cutoff was the better alternative still producing signatures with informative genes. That is, ROC curves for set 2 overall are worse than for the less ‘difficult’ set 1 but the curve for the P-value cutoff is above the non-informative ROC curve for the FDR cutoff in this case (Fig. 6).
In an elegant theoretical analysis within their unifying RS framework, Newton et al. (2007) showed that in certain situations (small number of very significant genes), methods based on categorizing genes can outperform methods that rely on the complete expression profiles in the traditional enrichment analysis by gene lists. While it is possible that this result holds in the context of enrichment by primary data, our procedure indicates that it is probably impossible to a priori define optimal significance cutoffs for assessing the concordance of gene signatures. Consequently, one may always be better off using methods that do not rely on defining such cutoffs.
Alternative simple statistical methods that do not require specifying statistical significance cutoffs (correlation coefficients, Wilcoxon test) showed surprisingly strong performance in the breast cancer datasets analysis, but performed worse than other methods based on selecting differentially expressed genes (EPSA, EXALT, CS and LRpath) in the more difficult Connectivity Map data. Our analysis in which we progressively remove the ‘signal’ by random re-labeling of genes indicates that simple methods perform well when most genes are differentially expressed, but their performance deteriorates when only a fraction of genes are concordant. This could be explained by the fact that if most genes are differentially expressed and concordant, using all genes is better than losing many informative ones due to imperfect statistical power of the differential expression analysis. The fact that our GRS method performs as well as, or better than, any other method in all settings implies that it is capable of correctly weighing the contribution of different genes based on the statistical significance of their differential expression. Our results indicate that simple methods utilizing complete gene expression profiles (correlation, Wilcoxon) and methods that rely on preselecting differentially expressed genes (EPSA, EXALT, CS and LRpath) both have domains of superiority. However, our procedure performs optimally in all settings and in difficult situations (such as the Connectivity Map data) clearly outperforms all tested alternatives.
Our method provides additional means to functionally annotate newly generated genomics data exploiting the vast number of datasets publicly available through repositories such as GEO (Barrett et al., 2009). It is readily available as part of the add-on R package CLEAN (Freudenberg et al., 2009) and through our web interface Genomics Portals (Shinde et al., 2010). The online version (http://GenomicsPortals.org) facilitates the use of datasets uploaded by the user as well as using any one of the >2000 primary genomics datasets currently deposited in the Genomics Portals as query and reference datasets.
Funding: National Human Genome Research Institute (R01 HG003749); National Library of Medicine (R21 LM009662); National Institute of Environmental Health Sciences Center for Environmental Genetics grant (P30 ES06096).
Conflict of Interest: none declared.
Supplementary Material
REFERENCES
- Ackermann M, Strimmer K. A general modular framework for gene set enrichment analysis. BMC Bioinformatics. 2009;10:47. doi: 10.1186/1471-2105-10-47. [DOI] [PMC free article] [PubMed] [Google Scholar]
- Ashburner M, et al. Gene ontology: tool for the unification of biology. The Gene Ontology Consortium. Nat. Genet. 2000;25:25–29. doi: 10.1038/75556. [DOI] [PMC free article] [PubMed] [Google Scholar]
- Barrett T, et al. NCBI GEO: archive for high-throughput functional genomic data. Nucleic Acids Res. 2009;37:D885–D890. doi: 10.1093/nar/gkn764. [DOI] [PMC free article] [PubMed] [Google Scholar]
- Caldas J, et al. Probabilistic retrieval and visualization of biologically relevant microarray experiments. Bioinformatics. 2009;25:i145–i153. doi: 10.1093/bioinformatics/btp215. [DOI] [PMC free article] [PubMed] [Google Scholar]
- Casella G, Berger RL. Statistical Inference. Duxbury Press; 2001. [Google Scholar]
- Dai M, et al. Evolving gene/transcript definitions significantly alter the interpretation of GeneChip data. Nucleic Acids Res. 2005;33:e175. doi: 10.1093/nar/gni179. [DOI] [PMC free article] [PubMed] [Google Scholar]
- Feng C, et al. GEM-TREND: a web tool for gene expression data mining toward relevant network discovery. BMC Genomics. 2009;10:411. doi: 10.1186/1471-2164-10-411. [DOI] [PMC free article] [PubMed] [Google Scholar]
- Freudenberg JM, et al. CLEAN: CLustering Enrichment ANalysis. BMC Bioinformatics. 2009;10:234. doi: 10.1186/1471-2105-10-234. [DOI] [PMC free article] [PubMed] [Google Scholar]
- Hibbs MA, et al. Exploring the functional landscape of gene expression: directed search of large microarray compendia. Bioinformatics. 2007;23:2692–2699. doi: 10.1093/bioinformatics/btm403. [DOI] [PubMed] [Google Scholar]
- Irizarry RA, et al. Summaries of affymetrix GeneChip probe level data. Nucleic Acids Res. 2003;31:e15. doi: 10.1093/nar/gng015. [DOI] [PMC free article] [PubMed] [Google Scholar]
- Kanehisa M, Goto S. KEGG: kyoto encyclopedia of genes and genomes. Nucleic Acids Res. 2000;28:27–30. doi: 10.1093/nar/28.1.27. [DOI] [PMC free article] [PubMed] [Google Scholar]
- Lamb J, et al. The Connectivity Map: using gene-expression signatures to connect small molecules, genes, and disease. Science. 2006;313:1929–1935. doi: 10.1126/science.1132939. [DOI] [PubMed] [Google Scholar]
- Li Y, et al. Gene expression module-based chemical function similarity search. Nucleic Acids Res. 2008;36:e137. doi: 10.1093/nar/gkn610. [DOI] [PMC free article] [PubMed] [Google Scholar]
- Maglott D, et al. Entrez Gene: gene-centered information at NCBI. Nucleic Acids Res. 2005;33:D54–D58. doi: 10.1093/nar/gki031. [DOI] [PMC free article] [PubMed] [Google Scholar]
- Medvedovic M, et al. Influence of fatty acid diets on gene expression in rat mammary epithelial cells. Physiol. Genomics. 2009;38:80–88. doi: 10.1152/physiolgenomics.00007.2009. [DOI] [PMC free article] [PubMed] [Google Scholar]
- Miller LD, et al. From The Cover: An expression signature for p53 status in human breast cancer predicts mutation status, transcriptional effects, and patient survival. Proc. Natl Acad. Sci. USA. 2005;102:13550–13555. doi: 10.1073/pnas.0506230102. [DOI] [PMC free article] [PubMed] [Google Scholar]
- Moggs JG, et al. Anti-proliferative effect of estrogen in breast cancer cells that re-express ER {alpha} is mediated by aberrant regulation of cell cycle genes. J. Mol. Endocrinol. 2005;34:535–551. doi: 10.1677/jme.1.01677. [DOI] [PubMed] [Google Scholar]
- Newton MA, et al. Random-set methods identify distinct aspects of the enrichment signal in gene-set analysis. Ann. Appl. Stat. 2007;1:85–106. [Google Scholar]
- Owen AB, et al. A gene recommender algorithm to identify coexpressed genes in C. elegans. Genome Res. 2003;13:1828–1837. doi: 10.1101/gr.1125403. [DOI] [PMC free article] [PubMed] [Google Scholar]
- Pan KH, et al. Effects of threshold choice on biological conclusions reached during analysis of gene expression by DNA microarrays. Proc. Natl Acad. Sci. USA. 2005;102:8961–8965. doi: 10.1073/pnas.0502674102. [DOI] [PMC free article] [PubMed] [Google Scholar]
- Parkinson H, et al. ArrayExpress update–from an archive of functional genomics experiments to the atlas of gene expression. Nucleic Acids Res. 2009;37:D868–D872. doi: 10.1093/nar/gkn889. [DOI] [PMC free article] [PubMed] [Google Scholar]
- Pena-Castillo L, et al. A critical assessment of Mus musculus gene function prediction using integrated genomic evidence. Genome Biol. 2008;9:S2. doi: 10.1186/gb-2008-9-s1-s2. [DOI] [PMC free article] [PubMed] [Google Scholar]
- Rhodes DR, Chinnaiyan AM. Integrative analysis of the cancer transcriptome. Nat. Genet. 2005;37(Suppl.):S31–S37. doi: 10.1038/ng1570. [DOI] [PubMed] [Google Scholar]
- Sartor MA, et al. LRpath: a logistic regression approach for identifying enriched biological groups in gene expression data. Bioinformatics. 2009;25:211–217. doi: 10.1093/bioinformatics/btn592. [DOI] [PMC free article] [PubMed] [Google Scholar]
- Sartor MA, et al. Intensity-based hierarchical Bayes method improves testing for differentially expressed genes in microarray experiments. BMC Bioinformatics. 2006;7:538. doi: 10.1186/1471-2105-7-538. [DOI] [PMC free article] [PubMed] [Google Scholar]
- Schmidt M, et al. The humoral immune system has a key prognostic impact in node-negative breast cancer. Cancer Res. 2008;68:5405–5413. doi: 10.1158/0008-5472.CAN-07-5206. [DOI] [PubMed] [Google Scholar]
- Sellke T, et al. Calibration of p-values for testing precise null hypothesis. Am. Stat. 2001;55:62–71. [Google Scholar]
- Shinde K, et al. Genomics Portals: integrative web-platform for mining genomics data. BMC Genomics. 2010;11:27. doi: 10.1186/1471-2164-11-27. [DOI] [PMC free article] [PubMed] [Google Scholar]
- Smyth GK. Linear models and empirical Bayes methods for assessing differential expression in microarray experiments. Stat. Appli. Genet. Mol. Biol. 2004;3 doi: 10.2202/1544-6115.1027. Article 3. [DOI] [PubMed] [Google Scholar]
- Storey JD, Tibshirani R. Statistical significance for genomewide studies. Proc. Natl Acad. Sci. USA. 2003;100:9440–9445. doi: 10.1073/pnas.1530509100. [DOI] [PMC free article] [PubMed] [Google Scholar]
- Subramanian A, et al. Gene set enrichment analysis: a knowledge-based approach for interpreting genome-wide expression profiles. Proc. Natl Acad. Sci. USA. 2005;102:15545–15550. doi: 10.1073/pnas.0506580102. [DOI] [PMC free article] [PubMed] [Google Scholar]
- Tenenbaum J, et al. Expression-based Pathway Signature Analysis (EPSA): Mining publicly available microarray data for insight into human disease. BMC Med. Genomics. 2008;1:51. doi: 10.1186/1755-8794-1-51. [DOI] [PMC free article] [PubMed] [Google Scholar]
- Tian L, et al. Discovering statistically significant pathways in expression profiling studies. Proc. Natl Acad. Sci. USA. 2005;102:13544–13549. doi: 10.1073/pnas.0506577102. [DOI] [PMC free article] [PubMed] [Google Scholar]
- Toyoshiba H, et al. Similar compounds searching system by using the gene expression microarray database. Toxicol. Lett. 2009;186:52–57. doi: 10.1016/j.toxlet.2008.08.009. [DOI] [PubMed] [Google Scholar]
- Vazquez M, et al. MARQ: an online tool to mine GEO for experiments with similar or opposite gene expression signatures. Nucleic Acids Res. 2010;38:W228–W232. doi: 10.1093/nar/gkq476. [DOI] [PMC free article] [PubMed] [Google Scholar]
- Vêncio RZ, Shmulevich I. ProbCD: enrichment analysis accounting for categorization uncertainty. BMC Bioinformatics. 2007;8:383. doi: 10.1186/1471-2105-8-383. [DOI] [PMC free article] [PubMed] [Google Scholar]
- Wilcoxon F. Individual comparisons by ranking methods. Biomet. Bull. 1945;1:80–83. [Google Scholar]
- Wren JD. A global meta-analysis of microarray expression data to predict unknown gene functions and estimate the literature-data divide. Bioinformatics. 2009;25:1694–1701. doi: 10.1093/bioinformatics/btp290. [DOI] [PMC free article] [PubMed] [Google Scholar]
- Yi Y, et al. Strategy for encoding and comparison of gene expression signatures. Genome Biol. 2007;8:R133. doi: 10.1186/gb-2007-8-7-r133. [DOI] [PMC free article] [PubMed] [Google Scholar]
Associated Data
This section collects any data citations, data availability statements, or supplementary materials included in this article.


