Abstract
While the basic pathways mediating vestibulo-ocular, -spinal, and -collic reflexes have been described in some detail, little is known about vestibular projections to central autonomic sites. Previous studies have primarily focused on projections from the caudal vestibular region to solitary, vagal and parabrachial nuclei, but have noted a sparse innervation of the ventrolateral medulla. Since a direct pathway from the vestibular nuclei to the rostral ventrolateral medulla would provide a morphological substrate for rapid modifications in blood pressure, heart rate and respiration with changes in posture and locomotion, the present study examined anatomical evidence for this pathway using anterograde and retrograde tract tracing and immunofluorescence detection in brainstem sections of the rat medulla. The results provide anatomical evidence for direct pathways from the caudal vestibular nuclear complex to the rostral and caudal ventrolateral medullary regions. The projections are conveyed by fine and highly varicose axons that ramify bilaterally, with greater terminal densities present ipsilateral to the injection site and more rostrally in the ventrolateral medulla. In the rostral ventrolateral medulla, these processes are highly branched and extremely varicose, primarily directed toward the somata and proximal dendrites of non-catecholaminergic neurons, with minor projections to the distal dendrites of catecholaminergic cells. In the caudal ventrolateral medulla, the axons of vestibular nucleus neurons are more modestly branched, with fewer varicosities, and their endings are contiguous with both the perikarya and dendrites of catecholamine-containing neurons. These data suggest that vestibular neurons preferentially target the rostral ventrolateral medulla, and can thereby provide a morphological basis for a short latency vestibulo-sympathetic pathway.
Keywords: Vestibular nuclei, vestibulo-sympathetic pathways, vestibulo-sympathetic reflex, vestibulo-autonomic control
INTRODUCTION
The vestibular system senses the movement and position of the head in space and uses this information to stabilize vision, control posture, detect head orientation and self-motion in three-dimensional space, and modulate autonomic and limbic system activities in response to locomotion and postural adjustments (for review, see (Angelaki and Cullen, 2008)). Most vestibular signals are not consciously perceived, but are usually appreciated through effector pathways traditionally described as the vestibulo-ocular, -spinal, -collic and -autonomic reflexes. Vestibular inputs to these pathways originate in the semicircular canals and/or otolith organs, which are sensitive to head rotational and translational accelerations respectively, and are conveyed centrally to the vestibular nuclei and cerebellum (for review, see (Highstein and Holstein, 2006)). The four main vestibular nuclei participate to variable extents in each of these functional pathways, and while afferents from the semicircular canals innervate parts of all four vestibular nuclei, otolithic inputs tend to target more caudal regions of the vestibular nuclear complex (VNC) (Dickman and Angelaki, 2002, Newlands and Perachio, 2003).
Whereas the basic pathways mediating vestibulo-ocular, -spinal, and -collic reflexes have been described, relatively little is known about vestibular projections to central autonomic centers. Two general regions of the VNC have been proposed to mediate vestibulo-sympathetic responses: a rostral region that includes cells in the superior vestibular nucleus and rostral medial vestibular nucleus (MVN), and a caudal area comprising the caudal portion of MVN (MVNc) and the inferior or spinal vestibular nucleus (SpVN). The rostral region is thought to receive vestibular input predominantly from the semicircular canals and to send projections to the parabrachial complex (Balaban, 1996, Kerman et al., 2006). Since the parabrachial nuclei integrate visceral, emotional and vestibular signals, and have reciprocal connections with the hypothalamus and limbic system, this rostral pathway may be involved in affective and emotional aspects of vestibulo-autonomic function such as the association between vertigo and panic. The caudal pathway receives vestibular signals primarily (but not exclusively) from the otolith organs (Yates et al., 1993) and sends second order projections to brainstem sites involved in the central regulation of blood pressure and heart rate, as well as respiration and digestion. In the rat, the best characterized medullary targets of this pathway are subregions of the solitary nucleus (NTS) and the dorsal vagal motor nucleus, with very minor projections noted in nucleus ambiguus, raphé magnus, and the rostral and caudal ventrolateral medullary cell groups (RVLM and CVLM, respectively) (Ruggiero et al., 1996, Porter and Balaban, 1997).
In order for VNC neurons to influence blood pressure during orthostatic challenge, vestibular signals must be conveyed to the medullary and/or spinal cord regions that participate in sympathetic nervous system regulation. Baroreceptor afferents project to regions of the NTS (Spyer, 1981), which in turn send projections to CVLM and RVLM (for reviews, see (Pilowsky and Goodchild, 2002, Sved et al., 2003, Blessing, 2004, Guyenet, 2006)). Since at least some vestibular axons have been observed in NTS, CVLM and RVLM, blood pressure-related and vestibulo-autonomic signals could conceivably interact at any or all of these sites. However, the vestibular and baroreceptor terminal fields in NTS are thought to be separate, with little convergence of the two inputs onto individual NTS neurons (Yates et al., 1994). In addition, NTS lesions have only minor impact on the sympathetic activity resulting from electrical stimulation of the vestibular nerve (for review, see (Yates, 1996). In fact, cells in NTS and CVLM do not respond appreciably to vestibular nerve stimulation, suggesting that these cell groups are primarily involved in mediating the baroreflex (Kerman and Yates, 1998). In contrast, there is some electrophysiological evidence for convergence of baroreceptor and vestibular inputs onto individual RVLM neurons (Yates and Bronstein, 2005) and chemical ablation of this region abolishes vestibular nerve stimulation-elicited effects on sympathetic nerve activity (Yates et al., 1995). Based on these observations, and the absence of direct vestibular projections to the sympathetic preganglionic neurons in the intermediolateral cell column of the spinal cord (IML), the RVLM appears to be the most likely site for direct functional interplay between the baroreflex and the vestibulo-sympathetic reflex.
From the RVLM, a neurochemically hetereogeneous neuronal population sends excitatory projections to the IML (Card et al., 2006). While the principal neurotransmitter of the vasomotor cells in RVLM that project to the IML is thought to be glutamate (Morrison, 2003), numerous additional neuroactive molecules have been identified in these cells. Notably, approximately 70% of the putatively glutamatergic vasomotor RVLM neurons co-localize the requisite biosynthetic enzymes for epinephrine production, and are identified as part of the C1 catecholaminergic cell group (Ruggiero et al., 1994). In addition, various neuromodulators have been localized in subpopulations of vasomotor RVLM neurons, including calbindin, enkephalin, neuropeptide Y, substance P, cocaine- and amphetamine-regulated transcript, pituitary adenylate cyclase-activating polypeptide and nitric oxide (for review, see (Stornetta, 2009)). Although the C1 neurons were originally proposed as the chief purveyor of sympathoexcitation from the RVLM region (Reis et al., 1988), specific immunotoxic lesions of these cells produce only small reductions in mean arterial blood pressure (Schreihofer et al., 2000, Madden and Sved, 2003). In addition, vesicular glutamate transporter type 2, suggestive of glutamatergic neurotransmission, has been localized in both C1 and non-C1 presympathetic RVLM neurons (Stornetta et al., 2002b). Such findings have led to the current concept that the catecholaminergic neurons of the RVLM have a primarily modulatory role in blood pressure regulation, perhaps contributing to sympathoexcitatory reflexes rather than to the maintenance of resting sympathetic vasomotor tone (Guyenet, 2006). In addition, the CVLM region gives rise to both excitatory and GABAergic inhibitory projections to the RVLM (Blessing, 1988, Jeske et al., 1995, Natarajan and Morrison, 2000), as well as caudal C1 catecholaminergic projections to the hypothalamus and basal forebrain (Cravo et al., 1991, Chan and Sawchenko, 1998, Schreihofer and Guyenet, 2002). Thus, it is clear that the role(s) of cells in the CVLM area extend far beyond that of a simple baroreflex relay.
Although the RVLM appears to be the key site for integrating vestibular and baroreflex signals that control blood pressure, previous anatomical studies of the vestibular pathways have emphasized the projections from the caudal VNC (VNCc) to the solitary, vagal and parabrachial nuclei (Balaban and Beryozkin, 1994, Yates et al., 1994, Ruggiero et al., 1996, Porter and Balaban, 1997), although sparse, light and largely indirect vestibular projections to the ventrolateral medullary region (VLM) were noted. This finding is puzzling given that the existence of a direct VNCc-RVLM pathway would provide a morphological substrate for rapid modifications in blood pressure, heart rate and respiration to mitigate the acute effects of gravity on blood re-distribution that occur with changes in posture and locomotion (e.g. (Voustianiouk et al., 2006)). The present study investigated this pathway by testing two anatomical hypotheses regarding the vestibulo-autonomic projections: (1) that there is a substantial direct projection from the vestibular nuclei to RVLM and CVLM, and (2) that the primary target of the vestibular projection is in the RVLM.
EXPERIMENTAL PROCEDURES
Animal and tissue sources
Tissue from 25 outbred adult male Sprague-Dawley rats (350 – 450 g) was used for this study. The animals were obtained from a commercial vendor (Harlan Laboratories) and were housed in a facility approved by the Association for Assessment and Accreditation of Laboratory Animal Care. Most rats received unilateral (N=14) or bilateral (N=6) iontophoretic injections of the anterograde tracer Phaseolus vulgaris leucoagglutinin (PhaL; Vector Labs; Burlingame, CA) into the caudal medulla. Vestibular axon data for the present report were obtained from the six animals with the most uniform tracer placements. Data from the other 14 animals were used for immunolabeling studies of the RVLM and CVLM. Other rats (N=5) received unilateral pressure injections of Fluoro-Gold (FG; Fluorochrome, Denver CO) into the caudal RVLM. The choice of anterograde (PhaL) and retrograde (FG) tracers was based on published reports of their sensitivity, uni-directional transport, and comparatively low probability of uptake by fibers of passage (Raju and Smith, 2006, Schofield, 2008). The experiments were carried out in accordance with the National Institutes of Health Guide for the Care and Use of Laboratory Animals (NIH Publications No. 80-23, revised 1996), and the Institutional Animal Care and Use Committee of the Mount Sinai School of Medicine approved all experiments.
Tracer injections
Rats were anesthetized with isoflurane (4% induction; 2–2.5% maintenance in 95% O2/5% CO2), prepared for aseptic surgery (head and neck shaving and skin disinfection with povidone) and placed in a stereotaxic frame. A preemptive injection of the analgesic buprenorphine (Reckitt Benckiser Pharmaceuticals; Richmond VA; 0.05mg/kg) was administered before the surgery. During surgery, the rat was kept on an Isotherm heating pad and its temperature was monitored with a rectal probe. After making a midline skin incision from the top of the skull to the atlas region, the atlanto-occipital membrane was exposed by blunt dissection and partially removed to expose the underlying brainstem. A small amount of occipital bone was removed with fine rongeurs to allow a glass pipette to reach the region of the vestibular nuclei from the dorsal approach at an angle of 22° from the horizontal plane. The glass pipette (10–15 μm outer diameter) was initially zeroed on the obex (calamus scriptorius) and then moved laterally (0.8–1.0 mm) and caudally (0.45 mm). After raising it 1.4–1.5 mm (off-vertical movement), the pipette was advanced 2.5–2.8 mm into the vestibular nucleus target. Each rat then received one 15-min iontophoretic injection (5 μA, 7 sec on/7 sec off) of 2% PhaL dissolved in 0.1M phosphate buffer (PB; pH 8.0). After completing the injection, the pipette was withdrawn, the wound was closed with monofilament sutures, and the animal was allowed to recover from anesthesia. Analgesics were administered twice daily for three days after surgery (buprenorphine; 0.05 mg/kg).
The surgical approach for the pressure injection of FG was identical to that described above, except that the pipette was angled 45°. FG was injected using a short glass pipette (tip pulled to ~20 μm outer diameter) glued to the tip of a 2 μl Hamilton syringe held in a microinjection unit (Model 5000, David Kopf Instruments; Tujunga, CA). The pipette was moved 2.3 mm laterally from the obex (calamus scriptorius) and advanced 4.4 mm into the tissue to the VLM target (12.8 mm caudal to Bregma, −9.51 mm dorsoventral). Twenty to 25 nl of FG (2% in normal saline) were injected and the pipette was left in situ for 3 – 4 minutes before being withdrawn.
Perfusion, fixation and tissue sectioning
After a survival time of 10 – 14 days (PhaL) or 7 – 10 days (FG), animals were deeply anesthetized (chloral hydrate; 400 mg/kg) and perfused transcardially with 80 ml of room temperature (RT) 10 mM phosphate buffered saline (PBS) followed by 450 ml of 4% paraformaldehyde/0.2% glutaraldehyde fixative in 0.1M PB (pH 7.4) at RT. Brains were harvested immediately after perfusion, blocked using an adult rat brain coronal matrix (Ted Pella, Inc.; Redding, CA), and stored at 4°C in PBS with 0.02% NaN3. Tissue blocks were subsequently cut by vibrating microtome into 50 μm thick serial sections that extended through the VNCc and the VLM. All the sections (usually about 120 per animal) were stored in PBS with 0.02% NaN3 at 4°C.
Anatomical boundaries of RVLM and CVLM
The boundaries of RVLM and CVLM were determined in each tissue section by comparison of the anatomical structures present in the ventral aspect of the section with published maps and atlases of the region (Paxinos et al., 1999, Card et al., 2006, Bourassa et al., 2009, Goodchild and Moon, 2009). Utilizing the most conservative estimates based on these published maps, we identified the RVLM as the 1 mm rostrocaudal region extending from approximately 11.8 mm to 12.8 mm caudal to Bregma. The other dimensions of the region were defined by a triangle with pars compacta of nucleus ambiguus at the apex, and the ventral surface of the medulla 1.4 and 2.2 mm lateral to the midline as the two other geometric points. The CVLM region was also defined by anatomical coordinates, and extended from 12.8 mm to 13.6 mm caudal to Bregma. As recently noted (Goodchild and Moon, 2009), this region corresponds well with previously published functional and physiological maps of RVLM and CVLM.
Primary antisera (Table 1)
Table 1.
Primary Antibodies Used in this Study
| Target | Antigen | Source | Description | Concentration (Dilution) |
|---|---|---|---|---|
| Fluorogold | Fluorogold | Fluorochrome, LLC | Rabbit polyclonal | (1:20000) |
| Glutamate | Glutamate conjugated to BSA | This laboratory (clone 21-5-B2) (Holstein et al., 2004) | Mouse monoclonal IgG1 (k) (tissue culture supernatant) | (1:10) |
| PhaL | Phaseolus vulgaris leucoagglutinin (E+L) | Vector Laboratories (AS-3200) | Rabbit polyclonal, affinity purified | 10 μg/ml |
| Tyrosine hydroxylase | Purified rat tyrosine hydroxylase | Millipore (MAB5280, clone 2/40/15) | Mouse monoclonal IgG2a; recognizes 64 kDa band in western blot of PC12 lysate | 1.7 μg/ml |
The mouse monoclonal anti-glutamate (IgG1) antibody used in this study was produced in our laboratory. A full description of the antibody production, characterization and specificity was published previously (Holstein et al., 2004). In brief, anti-glutamate antibodies were produced by immunizing BALB/c mice with glutamate conjugated to keyhole limpet hemocyanin using glutaraldehyde as a linking agent. Once antibody titers reached satisfactory levels, spleen cells were harvested from several mice and fused with myeloma cells (P3×63-Ag8. 653). Screening for hybrid clones that produced anti-glutamate antibodies was initially performed by ELISA using glutamate conjugated to bovine serum albumin (BSA). Hybridomas from positive wells were pick-cloned. Antibodies produced by these clones were subsequently screened by ELISA for cross-reactivity with other amino acid- and neurotransmitter-BSA conjugates including alanine, arginine, asparagine, aspartic acid, citrulline, cysteine, glutamine, glycine, histidine, isoleucine, methionine, proline, serine, threonine, tryptophan, valine, dopamine, serotonin, epinephrine, norepinephrine, histamine, and GABA. In addition, pre-incubation of glutamate antiserum with glutamate bound to BSA completely blocked ELISA reactivity and tissue section staining.
For the present paper, additional assays were performed in order to demonstrate that glutamate could be fixed in situ by glutaraldehyde and that the fixed glutamate could specifically be recognized by the monoclonal antibody (MAb 215B2). All the steps of the assay were separated by five washes with PBS, and during all incubations plates were mixed on an ELISA shaker. The major steps of the assay were i) ELISA plates were coated (overnight at 4°C) with a brain tissue lysate (100 μg protein/ml in 0.15 M NaHCO3) harvested from a rat perfused with a large volume of PBS (to exclude blood plasma proteins from the lysate), ii) amino acids (1 mM in 0.1 M PB, pH 7.4) were added to triplicate wells in the presence of fixatives for 3 hr at RT, iii) residual aldehydes were quenched with 0.1 M ethanolamine (pH 8.0, 60 min, RT), iv) wells were reacted (overnight at 4°C) with a 1:30 dilution (2% BSA in PBS) of MAb 215B2, v) biotinylated goat anti-mouse IgG (Zymed, 1 μg/ml in 2% BSA in PBS) was added for 2 hrs at RT, vi) streptavidin-horseradish peroxidase (HRP; Zymed, 1 μg/ml in 2% BSA) was added (60 min, RT). After a final set of washes, the plate was developed with a peroxidase substrate (Sureblue, Kirkegaard & Perry Labs; 10 min, 37°C). The enzymatic reaction was stopped with 50 μl of 2N HCl and the plate was read at 450 nm. As shown in Figure 1, we found that glutamate is fixed in situ by the paraformaldehyde/glutaraldehyde mixture (but not by paraformaldehyde alone) and that fixed glutamate is specifically recognized by our anti-glutamate monoclonal antibody (MAb 215B2). These results were confirmed in a second set of similar assays in which ELISA wells were coated with BSA instead of rat brain lysate. Since a metabolic pool of glutamate is present in all neurons, this antibody was used in the present study as a generic neuronal cell marker.
Figure 1.
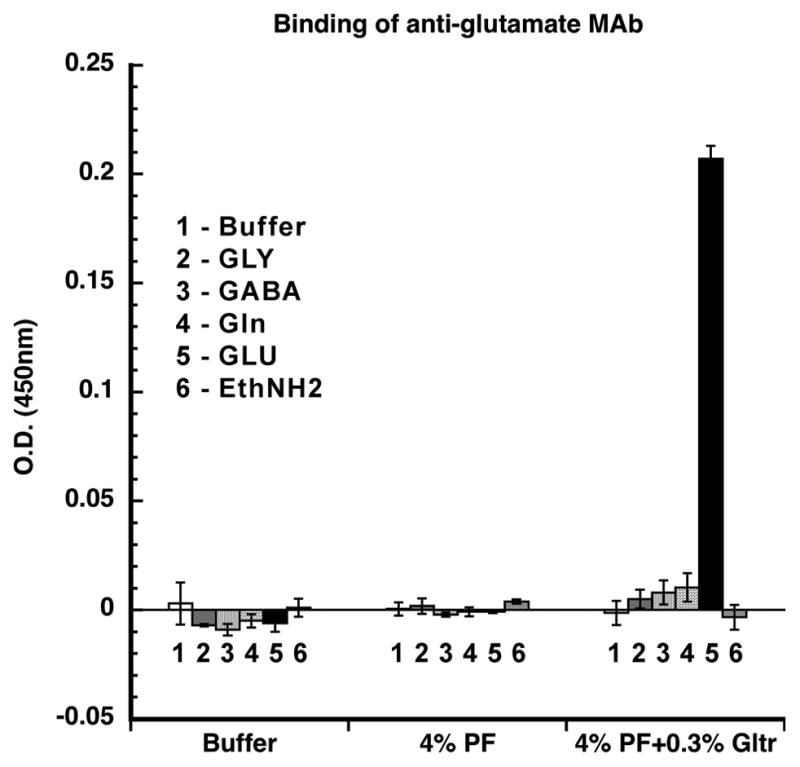
Reaction of the anti-glutamate MAb 215B2 with amino acids fixed in situ with 4% paraformaldehyde or with 4% paraformaldehyde/0.3% glutaraldehyde in wells of ELISA plates coated with rat brain tissue lysate. Glutamate (black bar) is fixed in situ by the mixed aldehyde solution, but not by paraformaldehyde alone, and the fixed glutamate is specifically recognized by the anti-glutamate monoclonal antibody MAb 215B2. The error bars represent standard deviations of triplicate assays; MAb 215B2 binding in wells receiving glutamate differed from all controls (p<0.025, t-test). Abbreviations: EthNH2: ethanolamine; GABA: gamma aminobutyric acid; Gln: glutamine; Gltr: glutaraldehyde; GLU: glutamate; GLY: glycine; PF: paraformaldehyde.
A commercial mouse monoclonal antibody against tyrosine hydroxylase (TH; Millipore, Billerica, MA) (Rohrer et al., 1986) was utilized in the present study to identify catecholaminergic neurons. The antibody stained the same catecholaminergic cell groups in the medulla that have been demonstrated by other investigators using different antibodies (e.g., (Armstrong et al., 1982)).
Reagents
Primary and secondary antibodies were diluted in antibody dilution buffer (ADB: PBS containing 10% normal goat serum, 0.1% Triton X-100 and 0.02% NaN3). Streptavidins were diluted in PBS containing 0.5% BSA (Sigma A7530; St Louis, MO) and 0.1% gelatin (PBSG; Type A from porcine skin; Sigma; St Louis, MO). For diluting fluorochrome-labeled streptavidins, 0.02% NaN3 was added to the PBSG. NaN3 was omitted from buffers used to dilute peroxidase-labeled secondary reagents.
Immunofluorescence
Tissue sections were processed for multicolor immunofluorescence labeling for glutamate, TH, and PhaL or FG. All steps were performed at RT with agitation on an orbital shaker. Free-floating sections were pre-incubated for 3 – 6 h in ADB; incubated for 12 – 18 h in ADB containing mixed primary antibodies (see Table 1); washed for 4 – 8 h in multiple changes of PBS; incubated for 12 –18 h in ADB containing mixed species- or IgG subclass-specific biotin- or Alexa Fluor -conjugated secondary antibodies; and washed for 4 – 8 h in multiple changes of PBS. When streptavidins were used, sections were further incubated for 12 – 18 h in PBSG containing labeled streptavidin and then washed for 4 – 8 h in multiple changes of PBS. After the final wash, all sections were mounted on glass slides and coverslipped using Prolong™ (Invitrogen).
The multiple-label simultaneous immunofluorescence experiments utilized combinations of primary antibodies distinguished by their host species and, for mixtures containing multiple mouse monoclonal antibodies, by their immunoglobin class and subclass. Secondary antibodies were applied as mixtures of species- and isotype-specific reagents selected such that each secondary recognized only one component of the primary antibody mixture. Primary reagents were always pre-mixed and added concurrently and, after thorough washing, all secondary antibodies were also pre-mixed and applied simultaneously.
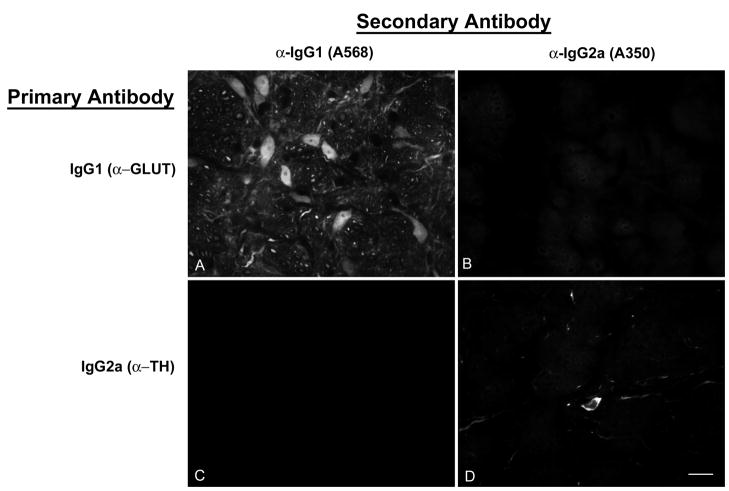
Crosstalk among the secondary antibodies was assessed by applying each secondary to sections labeled with a single rabbit polyclonal, mouse IgG1 or mouse IgG2a primary antibody. Each secondary antibody bound only to its appropriate primary antibody with negligible binding to inappropriate primaries (Fig. 2). In addition, most immunofluorescence-stained sections contained profiles that were stained by only one of the colors in the specimen’s secondary mixture. This provides an indication within single sections that only one secondary antibody bound to each primary antibody, and therefore that secondary antibody cross-reactivity was insignificant.
Figure 2.
Assessment of secondary antibody specificity. A,B: A section stained with the mouse monoclonal IgG1 anti-glutamate antibody followed by a mixture of anti-IgG1-Alexa568 and anti-IgG2a-Alexa350 secondary antibodies. The same field is shown visualized for red (Alexa568; panel A) and blue (Alexa350; panel B) emissions. IgG1-labeled cells bind anti-IgG1 secondary antibody (panel A) but not anti-IgG2a secondary antibody (panel B). C, D: a section stained with a mouse monoclonal IgG2a anti-tyrosine hydroxylase antibody followed by the same mixture of secondary antibodies as in panels A and B. The IgG2a-labeled cell (panel D) does not bind the anti-IgG1 secondary antibody (panel C). The antibodies are further described in Table 1. Scale bar: 20 μm, for all panels of the figure.
We have experienced varying degrees of sensitivity among secondary antibodies. To assess the robustness of our results, we used several alternative secondary antibodies and several alternative fluorochromes to detect each primary antibody. Consequently, our designs include the same combinations of primary antibodies visualized using several different combinations of secondaries. We have also exploited the greater sensitivity of biotin/streptavidin detection in designing secondary combinations, in some cases targeting different members of the same or related primary antibody combinations with biotin/streptavidin detection in parallel experiments.
Immunoperoxidase
Vibratome sections were blocked with ADB (4 – 6 h), and treated with anti-PhaL or anti-FG primary antibody (12 – 18 h) followed by PBS rinses (6 changes over 4 – 6 h) and either biotinylated secondary antibody (12 – 18 h), PBS rinses (6 changes over 4 – 6 h) and streptavidin-HRP, or by direct HRP-conjugated secondary antibody. Sections were then rinsed in PBS (6 changes over 2 h), and incubated in Tris buffer (pH 7.6) containing 0.5 mg/ml diaminobenzidine (DAB; Sigma D-5905; St. Louis, MO) with 0.01% H2O2.
Microscopy and image preparation
Sections were examined and images were acquired with a Zeiss Axioplan2 microscope equipped for structured illumination (ApoTome®) or with a Leica TCS SP5 laser scanning confocal microscope. Three-dimensional image processing, including z-stack rotations, extraction of virtual sections, maximum-intensity projections and volume rendering were performed with Zeiss Axiovision or Volocity (Perkin-Elmer) software. Publication images were prepared using ImageJ, Adobe Photoshop™ CS and Adobe Illustrator. Adjustments of brightness and contrast were accomplished with the Photoshop Levels and Curves tools, applied equally to all parts of each image. For these latter adjustments, the levels intensity check function was used to optimize the image data range by clipping the background field to full intensity and the darkest values just above zero. The curves tool was then used to optimize contrast and tonal mapping. The levels tool was then used again, solely as a diagnostic, to double check for clipping regions. Note that we did not use the Photoshop Autolevels function since this imprecisely uses percentages to judge clipping levels.
Atlas data
PhaL and FG labeling patterns were plotted using a standard rat brain atlas for reference (Paxinos et al., 1999). Sections stained by immunoperoxidase or immunofluorescence for visualization of PhaL or FG were either examined directly with the microscope or through digital photomicrographs and the locations of labeled cell bodies and axonal arbors were plotted manually on brainstem drawings made from the atlas. Axonal labeling was assessed in each optical section of the confocal stacks. Immunofluorescent axons that were present in a series of optical sections but absent from a contiguous section (in which antibody penetration was verified by other markers) were interpreted as terminal arbors. The resulting data were then rendered using Adobe Illustrator to produce Figures 3A and 4A.
Figure 3.
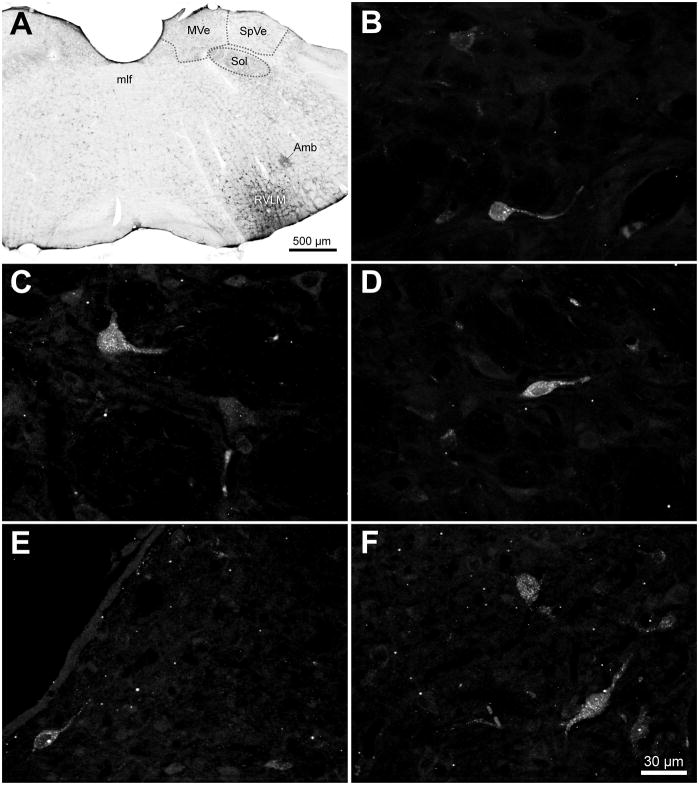
Retrograde injections in the VLM and retrogradely-labeled cells in the VNCc. A. An example of the largest FluoroGold injection in this study, visualized using diaminobenzidine. The injection site was directed at the ventral surface of the brainstem at the caudal pole of RVLM, approximately 12.8 mm caudal to Bregma. Tracer spread was approximately 100 μm rostro-caudally, and 500 μm medio-laterally and dorso-ventrally. Local labeled cell bodies were apparent within the tracer diffusion penumbra. B – D: Examples of retrogradely-labeled globular (B), multipolar (C) and fusiform (D) cells in the spinal vestibular nucleus following a FluoroGold injection in the caudal RVLM. E, F: Examples of FluoroGold-immunofluorescent cells in the periventricular (E) and tegmental (F) portions of the caudal medial vestibular nucleus. Panels B–F are maximum intensity projections of a series of 40x Apotome images collected serially through the z-axis of each neuron. Scale bar in F is for panels B–F. Abbreviations: Amb: nucleus ambiguus; mlf: medial longitudinal fasciculus; MVe: medial vestibular nucleus; RVLM: rostral ventrolateral medulla; Sol: solitary nucleus; SpVe: spinal (inferior) vestibular nucleus.
Figure 4.
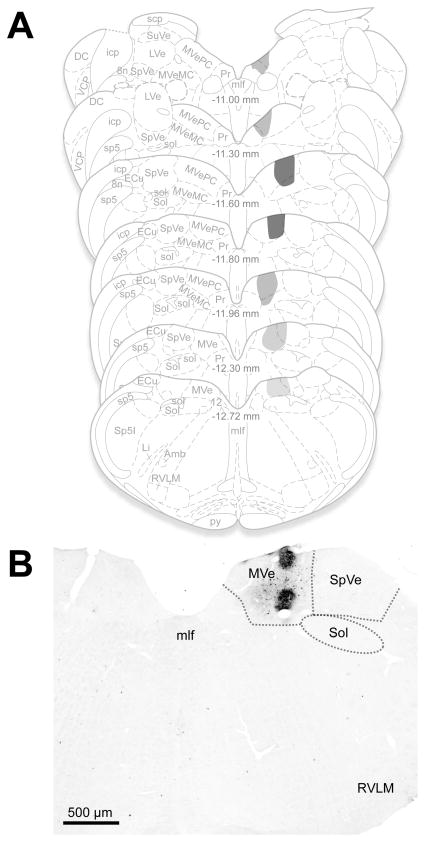
Representative anterograde tracer injection sites. A. The location and extent of the largest of the anterograde Phaseolus vulgaris leucoagglutinin (PhaL) injection sites and diffusion penumbra is plotted on a standard series of rat brainstem atlas schematic drawings (Paxinos et al., 1999). Darker gray shades indicate greater tracer deposition. The injection was almost entirely restricted to the caudal medial vestibular nucleus (MVe) although some of the penumbra showed diffusion into the adjacent spinal vestibular nucleus (SpVe) caudally and prepositus nucleus (Pr) rostrally. Approximate Bregma coordinates from the published atlas are indicated in the midline of each schematic section. B. PhaL injection placed in the caudal MVe, visualized using diaminobenzidine. Other than a small amount of tracer spread into the adjacent spinal vestibular nucleus, the injection remained within the confines of the medial nucleus. Abbreviations: 8n: vestibulo-cochlear nerve; 12: hypoglossal nucleus; Amb: nucleus ambiguus; DC: dorsal cochlear nucleus; ECu: external cuneate nucleus; icp: inferior cerebellar peduncle; Li: linear nucleus; LVe: lateral vestibular nucleus; mlf: medial longitudinal fasciculus; MVeMC: medial vestibular nucleus, magnocellular division; MVePC: medial vestibular nucleus, parvocellular division; Pr: prepositus nucleus; py: pyramids; RVL: rostral ventrolateral medulla; scp: superior cerebellar peduncle; sol: solitary tract; Sol: solitary nucleus; sp5: spinal trigeminal tract; Sp5I: spinal trigeminal nucleus, pars interpolaris; SpVe: spinal (inferior) vestibular nucleus; SuVe: superior vestibular nucleus; VCP: ventral cochlear nucleus, posterior division.
RESULTS
Tracer injections
The location and extent of the anterograde PhaL and retrograde FG tracer placements were determined by brightfield assessment of a series of regularly-spaced, 50 μm thick DAB-stained Vibratome sections through the caudal medulla. The injection site(s) and diffusion penumbrae in each animal were plotted on a standard series of rat brainstem atlas drawings (Paxinos et al., 1999) using neuroanatomical landmarks including the shape of the IVth ventricle, and the size and shape of the medullary pyramids, medial longitudinal fasciculus, spinal trigeminal nucleus and the presence of the cochlear nuclei to match the Vibratome sections to the appropriate Bregma levels.
Retrograde labeling
Initially, retrograde FG injections were performed to determine whether vestibular pathways to the VLM region include a direct projection component. These injections were placed at the caudal pole of RVLM, approximately 12.8 mm caudal to Bregma. Figure 3A illustrates the largest FG injection in this study; the diffusion penumbra spanned approximately 100 μm in the rostro-caudal plane and 500 μm in both the mediolateral and dorsoventral dimensions. The injection sites in the other FG-injected animals were similarly placed, but diffused shorter distances in all three dimensions. In addition to the local labeled cell bodies within the injection penumbra, retrogradely-labeled VNCc neurons were observed in both MVNc and the SpVN. The labeled vestibular cells were scattered throughout these nuclei, including the periventricular zone, and were not clustered or focally concentrated. Labeled cells were not observed in rostral MVN, or in the lateral or superior vestibular nuclei, and there were no apparent morphological differences between the neurons observed in MVNc and SpVN. In both nuclei, the FG-labeled cell bodies were 15 – 25 μm in longest axis diameter and had 1 – 3 primary dendrites emerging from the perikarya. The somata were variable in shape, with globular, multipolar and fusiform-shaped cell bodies observed most frequently (Fig. 3B–F). These retrograde tracer findings were consistent across animals and indicated that the VNCc sends a direct projection to the VLM region.
Anterograde labeling
All of the PhaL tracer injections in the animals used for this report were delivered to the MVNc. The injections varied in size, but little diffusion occurred outside the borders of the VNC. In two of the animals, tracer diffused into the adjacent SpVN, although none of the injections were concentrated in this latter region. Figure 4A illustrates the entire extent of the largest PhaL deposit in these animals, mapped onto standardized brainstem atlas schematics (Paxinos et al., 1999). A representative injection site is shown in Figure 4B. Across animals, the level of greatest PhaL tracer deposition was located 11.5 mm caudal to Bregma, although in one animal with bilateral injections of tracer, one of the two placements was focused somewhat more caudally at 12.13 mm caudal to Bregma.
Projections from VNCc to the VLM
Vestibular axons, visualized through anterograde transport of PhaL, traversed numerous nuclei in the medulla including NTS, the dorsal motor vagal nucleus, the spinal trigeminal nucleus, caudal raphé nuclei, nucleus ambiguus and the medullary reticular formation. Since the focus of the present study was on the axonal termination fields in the VLM region, no attempt was made to further investigate these projections or to determine whether the axons proceeded en passant or appeared to terminate in these nuclei.
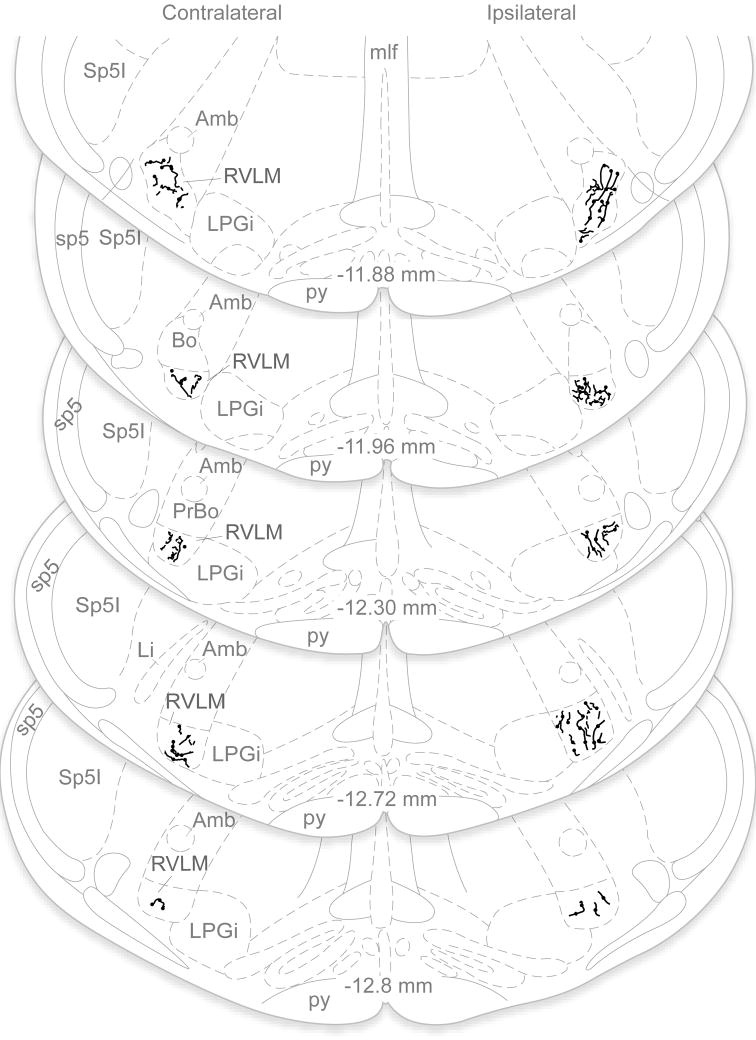
PhaL-labeled axons were present bilaterally throughout the VLM. Axonal labeling in this region was assessed in each optical section of the confocal image stacks. Immunofluorescent axons that were present in a series of optical sections but then absent from a contiguous section were interpreted as terminal arbors and were mapped onto the atlas schematics. These maps revealed that the vestibular axon termination density was greatest on the side ipsilateral to the injection site and at rostral levels, and progressively diminished at more caudal levels through the VLM. This general pattern was clear in brightfield microscopic assessments of DAB-labeled sections, as well as by immunofluorescence visualization of the labeled processes (Fig. 5). Since there was a direct relationship between the extent of the tracer deposition in VNCc and the density of the axonal projections in the VLM, labeling comparisons were made within-subjects only. Such comparisons demonstrated that the rostral-to-caudal decrease in vestibular axon density was consistent across all animals.
Figure 5.
Vestibular projections to RVLM in one animal with a unilateral PhaL injection in MVNc, illustrated in line drawings plotted on a standard series of rat brainstem atlas schematic drawings (Paxinos and Watson, 1998). Axonal labeling in the RVLM was assessed in each optical section of the confocal stacks. Immunofluorescent axons that were present in a series of optical sections but absent from a contiguous section were interpreted as terminal arbors, and were mapped onto the atlas schematics. These maps revealed that the vestibular axonal termination density was bilateral and extended throughout the VLM region, but was greatest on the side ipsilateral to the injection site and at more rostral levels of the RVLM. Note that only PhaL-labeled terminal fields in RVLM are illustrated; the course and termination patterns of axons traversing other medullary regions such as NTS, the dorsal motor vagal nucleus, the spinal trigeminal nucleus, caudal raphé nuclei, nucleus ambiguus and the medullary reticular formation were not investigated in the present study and are not included in this figure. Abbreviations as in Fig. 4.
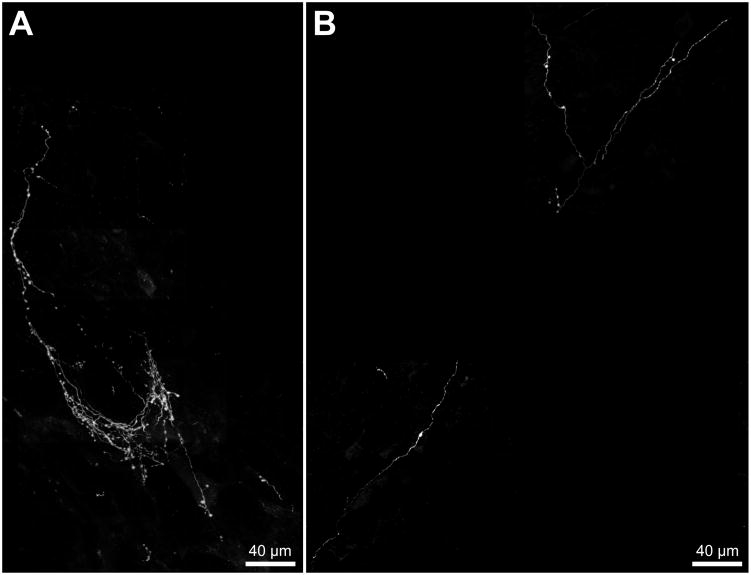
The vestibular projections to the VLM were conveyed by fine and highly varicose axons. Although individual axons ramified over areas greater than 0.15 mm2 in both the RVLM and CVLM, the arborizations in RVLM were substantially more elaborate than those in CVLM (Fig. 6). The varicosities were usually ovoid, and ranged from 1 – 3 μm in long-axis diameter. They were spaced 3 – 10 μm apart along the course of each labeled axon in the RVLM, but were considerably more widely separated in CVLM. Overall, the projections to rostral RVLM were very highly branched, profuse and varicose whereas those to CVLM were sparser, and had fewer branches and varicosities. Nevertheless, the termination fields tended to cover approximately equal tissue volumes in the two regions.
Figure 6.
PhaL-labeled vestibular axons in the VLM visualized by immunofluorescence. A. An example of the dense plexus of fine caliber, highly varicose vestibular axons that ramify in the RVLM, ipsilateral to the injection site in the MVNc and at approximately 11.9 mm caudal to Bregma. B. The ipsilateral CVLM (approximately 13.4 mm caudal to Bregma) of the same animal illustrated in panel A receives a substantially sparser vestibular innervation. Each panel comprises multiple fields obtained using a 40x objective, composited over a scaled 10x reference image. Each 40x field is a maximum intensity projection of a series of Apotome images collected serially through the z-axis of the tissue section.
Vestibular endings in the VLM
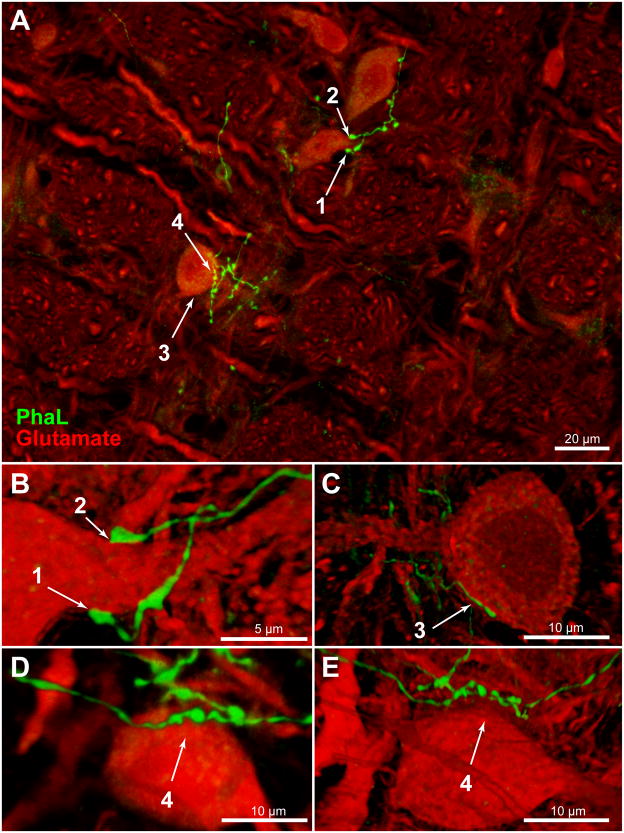
Glutamate immunofluorescence (Glu-IMF) was used in this study as a generic cytoplasmic marker. Glu-IMF neurons were distinguished from Glu-IMF astrocytes on the basis of cytology. Double immunofluorescence microscopy was used to examine PhAL-labeled axons in relation to Glu-IMF neurons in the VLM. Detailed analyses were conducted on z-stacks of optical sections through regions of interest that were obtained using either structured illumination (Apotome) or laser-scanning confocal microscopy, and images of these optical sections were rendered and rotated in three dimensional space for optimal visualization. In the RVLM, individual vestibular axons coursed over the perikarya and the expansive dendritic fields of individual cells. Usually there were chains of 2 – 5 axonal varicosities overlying individual somata (Fig. 7). In addition, the primary dendrites of the RVLM neurons were often surrounded by multiple or extended varicosities that formed pincers around the emerging processes (Fig. 7B). Rotations of all image stacks through PhaL-labeled axonal endings revealed that approximately 70% of the vestibular axonal varicosities in the RVLM were directly contiguous with somata and/or dendrites (Fig. 7B, C), whereas approximately 30% of these varicosities were not apposed to the adjacent neurons, as visualized by Glu-IMF (Fig. 7D, E).
Figure 7.
PhaL-immunofluorescent vestibular axons (green) in relation to glutamate-immunolabeled cells (red) in the RVLM (approximately 12.2 mm caudal to Bregma). A: Highly varicose vestibular axons contiguous with neuronal cell bodies and proximal dendrites in RVLM. Four regions of interest (numbered 1 – 4) were identified in this maximum intensity projection of a 40x Apotome image z-stack, and then further analyzed. Panels B – E are three-dimensional images, rotated and rendered using Volocity. Panels B, C, and E were constructed using 63x confocal image stacks acquired with a 2.4x zoom. Panel D is an Apotome image stack. B: Terminal boutons surround the emerging proximal dendrite of an RVLM neuron. C: A varicose vestibular process follows the perimeter of an RVLM neuron. Typically, chains of 2 – 5 varicosities appear to be in close contact with individual perikarya. To obtain this data, each image stack was fully rotated in three dimensions. The illustration shown in panel C was rotated 180° around the x-axis with respect to the image in panel A. While contiguity was often demonstrated by these rotations (panels B, C), panels D and E illustrate the importance of complete rotational information. While the vestibular varicosities in panel D appear to nest within somal concavities, it is clear from the further rotation of this image stack (panel E) that this vestibular axon bypasses the RVLM cell body altogether. The image in panel D was rotated 90° around the z-axis, and the image in panel E was rotated 90° around the z-axis with additional (~45°) x-axis rotation with respect to the image in panel A.
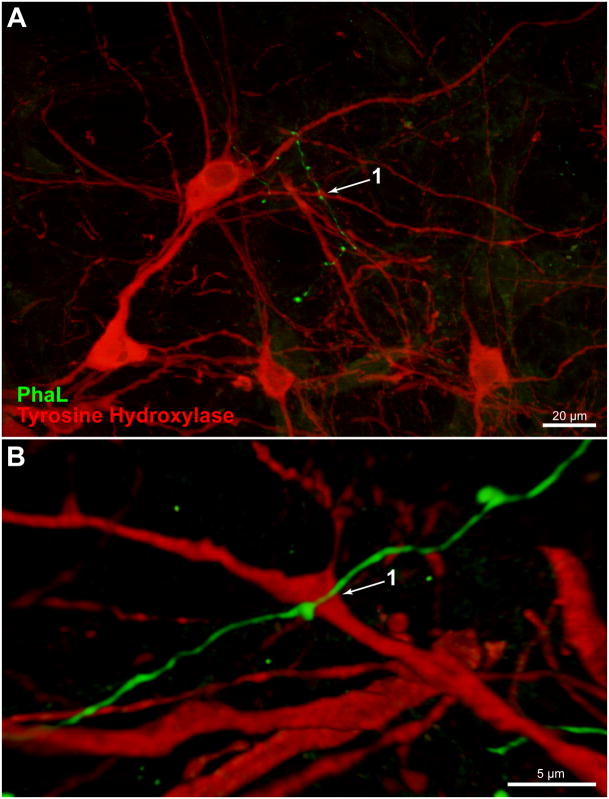
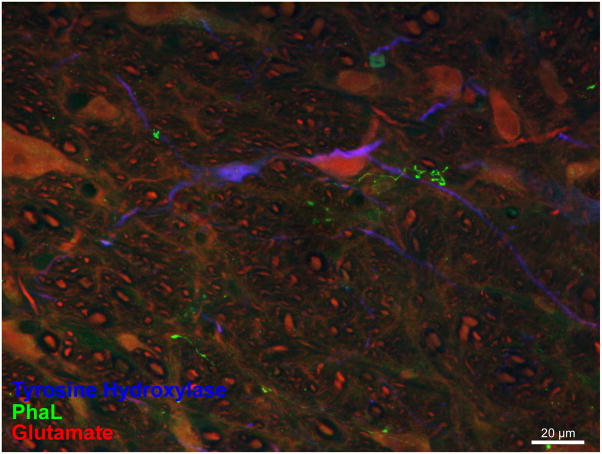
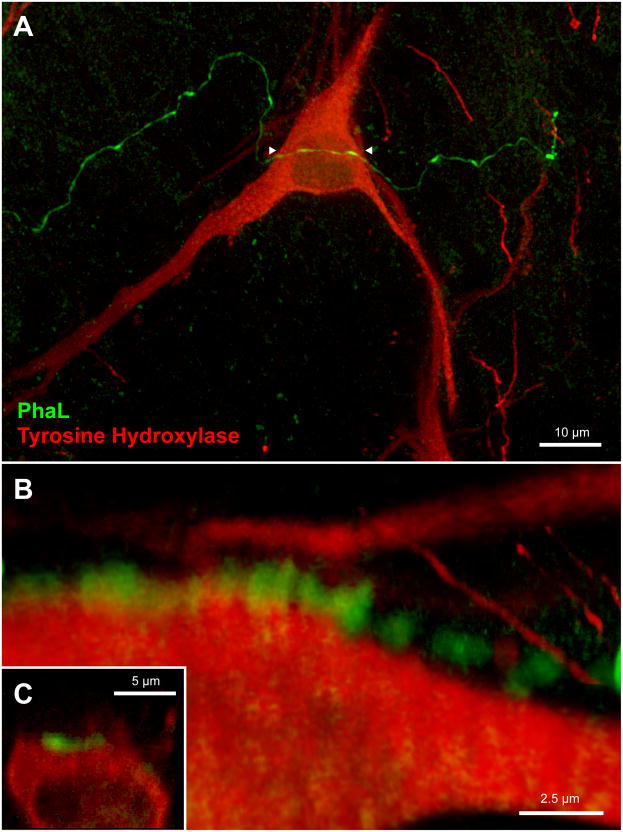
Since catecholaminergic neurons comprise one important neurochemical phenotype in the VLM region, additional multiple-label immunofluorescence studies were conducted to visualize the relationship between PhaL-labeled vestibular axons and tyrosine hydroxylase-immunofluorescent (TH-IMF) cell bodies in the VLM. These studies revealed that the vestibular axons in RVLM traverse the dendritic arbors, but not the cell bodies, of the TH-IMF neurons (Figs. 8 and 9). Although labeled axons often arborized near the TH-IMF dendrites, and appeared to end in profuse telodendrons, three-dimensional analysis using confocal or Apotome image stacks showed that direct contiguity between these elements did not always occur.
Figure 8.
A PhaL-labeled vestibular axon in relation to tyrosine hydroxylase-immunofluorescent (TH-IMF) cells in the caudal RVLM (approximately 12.7 mm caudal to Bregma). A. A vestibular axon traverses the dendritic processes but not the cell bodies of TH-IMF neurons. Maximum intensity projection of a 40x Apotome image z-stack. B. Three dimensional Volocity rendering, rotated approximately 180° around the x-axis with a small z-axis rotation, revealing the underside of a 63x confocal image stack acquired with a 2.4x zoom of same field.
Figure 9.
Immunofluorescence visualization of PhaL-labeled vestibular axons in relation to catecholaminergic (TH-IMF) and non-catecholaminergic (glutamate-immunofluorescent) neurons in the RVLM (approximately 12.8 mm caudal to Bregma). This maximum intensity projection of a 40x Apotome image z-stack illustrates a vestibular axonal telodendron in relation to a TH-IMF dendrite and a non-catecholaminergic cell body in RVLM.
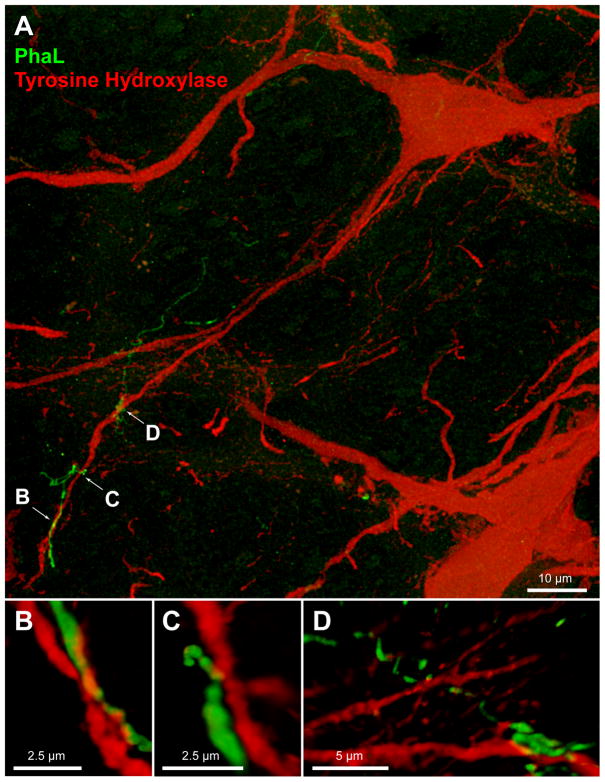
In contrast to the findings in RVLM, vestibular axons in CVLM were closely apposed to the somata as well as the dendrites of TH-IMF cells. Multiple points of apparent contact were suggested as individual axons traversed the perikarya of the catecholaminergic neurons (Fig. 10). In addition, the vestibular axons appeared to be intertwined with the distal dendritic segments of the TH-IMF CVLM cells, with multiple points of apposition evidenced along their shared trajectory (Fig. 11).
Figure 10.
Vestibular axon (green) in relation to a TH-IMF cell body in CVLM (approximately 13.3 mm caudal to Bregma). A: The varicose PhaL-filled axon courses over a TH-IMF cell body. Maximum intensity projection of a 63x confocal image stack acquired with a 2.4x zoom. B, C: multiple three-dimensional Volocity rendering rotations of the underside of the perikaryon, illustrating the series of apparent contacts (yellow patches) between the axon and the cell body. Panel B is a 3D Volocity rendering rotated 90 degrees around the x-axis; Panel C is an X–Z cut made in Volocity along the length of the PhaL axon/TH-IMF soma contact.
Figure 11.
Vestibular axon (green) in relation to TH-IMF dendrites in CVLM (approximately 13.4 mm caudal to Bregma). The axonal process is intertwined with the distal dendritic segments of the TH-IMF CVLM cells, with multiple points of contact occurring along their shared trajectory. A: Maximum intensity projection of a 63x confocal image stack acquired with a 2.4x zoom. Panels B–D: multiple three-dimensional Volocity renderings rotated to show the extent of the axo- dendritic contacts. The image in panel B is rotated 180° around the x-axis; the image in panel C is rotated 90° around the z-axis, then 90–135° around the x-axis; and the image in panel D is rotated 180° around the x-axis, then rotated approximately 60° around the Y-axis.
DISCUSSION
Conclusions
Using anterograde and retrograde tracing, the present study demonstrates that cells in the caudal vestibular nuclear complex of the rat have direct projections to the caudal brainstem area encompassing the rostral and caudal ventrolateral medullary regions. This projection is conveyed by fine and highly varicose axons that ramify bilaterally in the ventrolateral medulla, with terminal densities greatest ipsilaterally and rostrally. In the RVLM, these processes are directed primarily toward the somata and proximal dendrites of non-catecholaminergic neurons, with minor projections to the distal dendritic fields of catecholaminergic cells. In the CVLM region, vestibular axons appear to be closely apposed to both the perikarya and dendrites of catecholamine-containing neurons. These data support the existence of a direct vestibular projection to the RVLM region. Such a pathway could provide a morphological substrate for rapid modifications in blood pressure, heart rate and respiration with changes in posture and locomotion. The data further suggest that the VNCc sends direct projections to the CVLM, thereby conveying vestibular signals to more complex neural circuits involved in central autonomic control.
Vestibular cells with projections to R/CVLM
On the basis of cytoarchitectonics, the MVN has been subdivided into three parts: a parvocellular division adjacent to the IVth ventricle, a more ventrolaterally situated magnocellular area, and a caudal region that in humans is located caudal to the glossopharyngeal nerve and in rats is caudal to the genu of the facial nerve (Epema et al., 1988). The larger diameter neurons in the magnocellular region receive afferents from the semicircular canals and the flocculus, send projections to the extraocular motor nuclei, and are functionally related to the vestibulo-ocular reflex (Epema et al., 1988, Minor and Goldberg, 1991, Büttner-Ennever, 1992, Sekirnjak and Du Lac, 2006). In contrast, neurons in caudal and parvocellular MVN regions are generally of smaller diameter, receive inputs from the otolith organs as well as the semicircular canals, and send efferents to autonomic brainstem nuclei as well as to the cerebellum, spinal cord and inferior olivary complex (for reviews, see (Büttner-Ennever, 1999, Barmack, 2006, Highstein and Holstein, 2006)).
On the basis of physiological studies (Straka et al., 1997, Dickman and Angelaki, 2002), it has been estimated that approximately 25% of VNC neurons receive input exclusively from one semicircular canal, another 25% of these neurons express otolith-related signals only, while the remaining 50% of VNC cells receive convergent canal and otolith input since these neurons are responsive to both rotation and translation. While the neurons exclusively receiving canal afferents tend to have only rostrally-directed axons, presumably projecting to the oculomotor nuclei, otolith-recipient cells, including those receiving convergent input, send projections both rostrally and caudally (Straka et al., 2002) (for review, see (Newlands and Perachio, 2003)). In the present study, vestibular neurons that project to the VLM region are present in the MVNc and the SpVN. This regional localization is indistinguishable from the distributions of vestibular cells with projections to NTS and the dorsal motor vagal nucleus observed in the cat (Yates et al., 1994), rabbit (Balaban and Beryozkin, 1994) and rat (Ruggiero et al., 1996, Porter and Balaban, 1997), and the sole description by other investigators of the source of a sparse vestibulo-VLM pathway (Porter and Balaban, 1997).
The retrogradely-labeled vestibular neurons we observed are 15 – 25 μm in diameter, fusiform, multipolar and globular shaped, and have 1 – 3 primary dendrites. This cellular morphology is essentially identical to that reported in the only published study to date (Ruggiero et al., 1996) that includes a description of the cytology of vestibular neurons with projections to medullary autonomic nuclei (specifically, NTS and the dorsal motor vagal nucleus). These investigators reported that such VNCc cells have fusiform, triangular or multipolar somata, 12 – 25 μm in diameter with 2 – 3 primary dendrites. Moreover, the sizes of these vestibulo-autonomic neurons in VNCc are small to medium in comparison with rodent vestibular neurons overall (Bagnall et al., 2007). Based on these correlative observations, it is reasonable to hypothesize that the vestibular neurons with projections to medullary autonomic nuclei receive otolith inputs either solely or with convergent semicircular canal signals. However, since vestibular neurons with projections to the VLM are scattered throughout the MVNc and the SpVN, and are likely to be intermixed with neurons projecting to NTS, the dorsal motor vagal nucleus and other caudal sites, it is not possible to distinguish the vestibulo-VLM neurons from the general population of VNCc cells involved in various functional pathways solely on the basis of regional localization. In addition, since the VNCc neurons with direct projections to the VLM are variable in shape and size, as are second order vestibular neurons of other functional pathways (Highstein and Holstein, 2006, Bagnall et al., 2007), they cannot be recognized on cytoarchitectural grounds alone. Thus, the identification of VNCc neurons participating in vestibulo-autonomic pathways also cannot be made solely on the basis of cytology.
The vestibular axons ramifying in the VLM are resplendent with varicosities. This morphological attribute has been noted previously in tract tracing studies of vestibular projections to various autonomic cell groups including the VLM region in the rabbit (Balaban and Beryozkin, 1994, Balaban, 1996) and rat (Porter and Balaban, 1997), and contrasts markedly with the smooth processes of vestibular neurons participating in vestibulo-spinal, vestibulo-floccular and horizontal and vertical vestibulo-ocular pathways (for review, see (Highstein and Holstein, 2006)). Although the terminal axonal arborizations of these latter projections are in general highly branched, profuse varicosities have not been reported. This suggests that while the somata of VNCc neurons with descending autonomic projections cannot be distinguished by the cytology of their cell bodies, it is possible that vestibulo-sympathetic cells can be recognized on the basis of their axonal morphology. It is interesting to note that such profuse axonal varicosities are more typical of monoaminergic pathways such as serotonergic processes, in which such swellings contain high packing densities of synaptic vesicles and participate in en passant synaptic contacts (for review, see (Descarries et al., 2010)). Future ultrastructural studies will be necessary to assess the synaptology of the profuse vestibular axonal varicosities in the VLM.
Morphology of the VNC-VLM projection
In the present study, we provide anatomical evidence suggesting a direct projection from VNCc to the VLM region in the rat. Prior reports mentioning this putative pathway utilized anterograde tract tracing from the entire VNC of the rabbit (Balaban, 1996), or the VNCc of the rat (Porter and Balaban, 1997). However, in comparison to the “light” or “sparse” projections described in these previous reports, we observe a substantially denser projection from the MVNc to the VLM that is greatest rostrally and diminishes more caudally. Since the main focus of previous investigations was vestibular projections to the parabrachial, solitary, ambiguus and dorsal motor vagal nuclei, but not the VLM, it is possible that these prior studies examined more caudal VLM regions that indeed receive sparser vestibular innervation. The existence of a pathway from the MVNc and SpVN to the RVLM was also shown in the cat (Stocker et al., 1997), but the retrograde tracing approach used in that study did not permit afferent fiber density estimates.
Most anatomical and physiological studies have emphasized the predominant role of indirect polysynaptic vestibular pathways to the VLM via an intermediary structure or interneuron in NTS, the dorsal motor vagal nucleus or the lateral medullary reticular formation (Cai et al., 2007, Cai et al., 2008) (for reviews, see (Balaban and Porter, 1998, Yates and Bronstein, 2005)). Our findings suggest several additional vestibulo-sympathetic connections. Approximately 70% of the vestibular axonal varicosities observed in our study are directly contiguous with the somata and/or dendrites of cells in the RVLM visualized using glutamate immunofluorescence. Although contiguity cannot be interpreted as synaptic contact, our findings can nevertheless be viewed as clear evidence that axons of VNCc neurons end in the RVLM region. While the vestibular axons appear to remain distant from the catecholaminergic cell bodies of the area, vestibular endings are observed in close contact with TH-IMF dendrites. Since approximately 70% of the glutamatergic vasomotor RVLM neurons co-localize catecholamines (Ruggiero et al., 1994), it appears that the vestibular projection is directed toward catecholaminergic dendrites, non-vasomotor somata and/or the non-catecholaminergic vasomotor cell bodies in the RVLM region.
It is noteworthy that the vestibular axons appear to terminate preferentially in the more rostral region of the RVLM since the greatest sympathoexcitatory responses evoked by L-glutamate microinjections in the VLM are localized to this rostral region (Ruggiero et al., 1994, Bourassa et al., 2009, Goodchild and Moon, 2009). Our data suggest that vestibular afferents to the VLM may be preferentially directed toward the rostrally-located sympathoexcitatory portion of the presympathetic “cardiovascular ventrolateral column” (Goodchild and Moon, 2009). The comparatively sparse vestibular projection to the CVLM instead appears to be directed toward the cell bodies and dendrites of catecholaminergic neurons. These cells are part of the caudal C1 cell group, which sends projections to the hypothalamus and basal forebrain (Schreihofer and Guyenet, 2002). Nevertheless, it is possible that vestibular signals to the CVLM region are integrated into more complex autonomic circuitry, since the paraventricular hypothalamic nucleus in turn sends projections to the caudal pressor area as well as NTS, nucleus ambiguus, the C1 and A1 cell groups (Geerling et al., 2010), the VLM region (Chen and Toney, 2010) and the IML (Strack et al., 1989).
Functional considerations
Changes in posture, particularly those involving alterations in head position with regard to gravity, trigger rapid autonomic nervous system responses that impact ongoing physiological activity. In humans, caloric vestibular stimulation (Cui et al., 1997) and head-up and -down pitch alter sympathetic nerve activity (Ray et al., 1998, Ray and Carter, 2003) (for review, see (Yates and Bronstein, 2005)). Similarly, linear acceleration of human subjects, which stimulates the otolith organs, causes transient changes in systolic blood pressure (Cui et al., 1999) that are attenuated in patients with bilateral vestibular deficits (Yates et al., 1999). Otolith activation by off-vertical-axis rotation of normal subjects produces an increase in muscle sympathetic nerve activity in-phase with the head-up tilt component and a decrease in muscle sympathetic nerve activity corresponding to the head-down tilt component (Kaufmann et al., 2002). Moreover, a short-latency component of the vestibulo-sympathetic reflex pathway has been identified in humans (Kaufmann et al., 2002, Radtke et al., 2003, Voustianiouk et al., 2006), suggesting that the vestibular system contributes fast as well as slow temporal components to central sympathetic pathways, and can thereby exert blood pressure control during rapid linear head movements such as those that occur upon standing. The pathway we have observed from VNCc toward the non-catecholaminergic somata and proximal dendrites in the RVLM could provide the morphological basis for this short latency vestibulo-sympathetic activity reported in humans. The findings further indicate that there are vestibular projections directed toward catecholaminergic CVLM cells, as well as distal dendrites of RVLM neurons, the latter providing a structural basis for longer latency vestibulo-autonomic feedback control. Lastly, since the vestibulo-sympathetic projection is often referred to as a reflex pathway, and since our data indicate that some vestibular axons are primarily directed toward non-catecholaminergic cells in RVLM, it appears that the catecholaminergic neurons in the RVLM region are not necessarily involved in all aspects of the reflexive control of blood pressure.
RESEARCH HIGHLIGHTS.
Tract-tracing and immunofluorescence visualization were used
Projections from the vestibular nuclei to the ventrolateral medulla were studied
Direct vestibulo-sympathetic pathways were observed in rat
Acknowledgments
Grant support: Research supported by NIH grant 1R01 DC008846 from the National Institute on Deafness and Other Communication Disorders.
ABBREVIATIONS
- ADB
antibody dilution buffer
- BSA
bovine serum albumin
- CVLM
caudal ventrolateral medulla
- DAB
diaminobenzidine
- FG
Fluoro-Gold
- HRP
horseradish peroxidase
- MAb
monoclonal antibody
- MVN
medial vestibular nucleus
- MVNc
caudal MVN
- NTS
solitary nucleus
- PB
phosphate buffer
- PBS
phosphate buffered saline
- PBSG
phosphate buffered saline containing BSA and gelatin
- PhaL
Phaseolus vulgaris leucoagglutinin
- RT
room temperature
- RVLM
rostral ventrolateral medulla
- SpVN
spinal or inferior vestibular nucleus
- TH
tyrosine hydroxylase
- TH-IMF
tyrosine hydroxylase-immunofluorescent
- VLM
ventrolateral medullary region
- VNC
vestibular nuclear complex
- VNCc
caudal vestibular nuclear complex
Footnotes
Contributors: All authors approved the final version of this article. Experiments were conceived and designed by GRH, VLF and GPM. GPM and EK performed the tracer injections and histology; GPM, EK and VLF performed the immunolabeling studies; GRH, VLF and TK performed the microscopy and image processing; GRH and VLF performed the data analysis and all authors contributed to the manuscript and figure preparation.
Publisher's Disclaimer: This is a PDF file of an unedited manuscript that has been accepted for publication. As a service to our customers we are providing this early version of the manuscript. The manuscript will undergo copyediting, typesetting, and review of the resulting proof before it is published in its final citable form. Please note that during the production process errors may be discovered which could affect the content, and all legal disclaimers that apply to the journal pertain.
Contributor Information
Gay R. Holstein, Email: gay.holstein@mssm.edu.
Victor L. Friedrich, Jr., Email: victor.friedrich@mssm.edu.
Timothy Kang, Email: timothy.kang@mssm.edu.
Ewa Kukielka, Email: ewa.kukielka@mssm.edu.
Giorgio P. Martinelli, Email: giorgio.martinelli@mssm.edu.
LITERATURE CITED
- Angelaki DE, Cullen KE. Vestibular System: The many facets of a multimodal sense. Ann Rev Neurosci. 2008;31:125–150. doi: 10.1146/annurev.neuro.31.060407.125555. [DOI] [PubMed] [Google Scholar]
- Armstrong DM, Ross CA, Pickel VM, Joh TH, Reis DJ. Distribution of dopamine-, noradrenaline-, and adrenaline-containing cell bodies in the rat medulla oblongata: Demonstration by the immunocytochemical localization of catecholamine biosynthetic enzymes. J comp Neurol. 1982;212:173–187. doi: 10.1002/cne.902120207. [DOI] [PubMed] [Google Scholar]
- Bagnall MW, Stevens RJ, du Lac S. Transgenic mouse lines subdivide medial vestibular nucleus neurons into discrete, neurochemically distinct populations. J Neurosci. 2007;27:2318–2330. doi: 10.1523/JNEUROSCI.4322-06.2007. [DOI] [PMC free article] [PubMed] [Google Scholar]
- Balaban CD. Vestibular nucleus projections to the parabrachial nucleus in rabbits: implications for vestibular influences on the autonomic nervous system. Exp Brain Res. 1996;108:367–381. doi: 10.1007/BF00227260. [DOI] [PubMed] [Google Scholar]
- Balaban CD, Beryozkin G. Vestibular nucleus projections to nucleus tractus solitarius and the dorsal motor nucleus of the vagus nerve: potential substrates for vestibular-autonomic interactions. Exp Brain Res. 1994;98:200–212. doi: 10.1007/BF00228409. [DOI] [PubMed] [Google Scholar]
- Balaban CD, Porter JD. Neuroanatomical substrates for vestibulo-autonomic interactions. J Vest Res. 1998;8:7–16. [PubMed] [Google Scholar]
- Barmack NH. Inferior olive and oculomotor system. Prog Brain Res. 2006;151:231–268. doi: 10.1016/S0079-6123(05)51009-4. [DOI] [PubMed] [Google Scholar]
- Blessing WW. Depressor neurons in rabbit caudal medulla act via GABA receptors in rostral medulla. Am J Physiol. 1988;254:H686–H692. doi: 10.1152/ajpheart.1988.254.4.H686. [DOI] [PubMed] [Google Scholar]
- Blessing WW. Lower brain stem regulation of visceral, cardiovascular, and respiratory function. In: Paxinos G, Mai JK, editors. The Human Nervous System. 2. Amsterdam: Elsevier Academic Press; 2004. [Google Scholar]
- Bourassa EA, Sved AF, Speth RC. Angiotensin modulation of rostral ventrolateral medulla (RVLM) in cardiovascular regulation. Mol Cell Endocrin. 2009;302:167–175. doi: 10.1016/j.mce.2008.10.039. [DOI] [PMC free article] [PubMed] [Google Scholar]
- Büttner-Ennever JA. Patterns of connectivity in the vestibular nuclei. In: Cohen B, et al., editors. Sensing and Controlling Motion: Vestibular and Sensorimotor Function. Vol. 656. New York: New York Academy of Sciences; 1992. pp. 363–378. [DOI] [PubMed] [Google Scholar]
- Büttner-Ennever JA. A review of otolith pathways to brainstem and cerebellum. Ann NY Acad Sci. 1999;871:51–64. doi: 10.1111/j.1749-6632.1999.tb09175.x. [DOI] [PubMed] [Google Scholar]
- Cai Y-L, Ma W-L, Li M, Guo J-S, Li Y-Q, Wang L-G, Wang W-Z. Glutamatergic vestibular neurons express Fos after vestibular stimulation and project to the NTS and the PBN in rats. Neurosci Lett. 2007;417:132–137. doi: 10.1016/j.neulet.2007.01.079. [DOI] [PubMed] [Google Scholar]
- Cai Y-L, Ma W-L, Wang J-Q, Li Y-Q, Li M. Excitatory pathways from the vestibular nuclei to the NTS and the PBN and indirect vestibulo-cardiovascular pathway from the vestibular nuclei to the RVLM relayed by the NTS. Brain Res. 2008;1240:96–104. doi: 10.1016/j.brainres.2008.08.093. [DOI] [PubMed] [Google Scholar]
- Card JP, Sved JC, Craig B, Raizada M, Vazquez J, Sved AF. Efferent projections of rat rostroventrolateral medulla C1 catecholamine neurons: Implications for the central control of cardiovascular regulation. J comp Neurol. 2006;499:840–859. doi: 10.1002/cne.21140. [DOI] [PubMed] [Google Scholar]
- Chan RKW, Sawchenko PE. Organization and transmitter specificity of medullary neurons activated by sustained hypertension: implications for understanding baroreceptor reflex circuitry. J Neurosci. 1998;18:371–387. doi: 10.1523/JNEUROSCI.18-01-00371.1998. [DOI] [PMC free article] [PubMed] [Google Scholar]
- Chen Q-H, Toney GM. In vivo discharge properties of hypothalamic paraventricular nucleus neurons with axonal projections to the rostral ventrolateral medulla. J Neurophysiol. 2010;103:4–15. doi: 10.1152/jn.00094.2009. [DOI] [PMC free article] [PubMed] [Google Scholar]
- Cravo SL, Morrison SF, Reis DJ. Differentiation of two cardiovascular regions within caudal ventrolateral medulla. Am J Physiol. 1991;261:R985–994. doi: 10.1152/ajpregu.1991.261.4.R985. [DOI] [PubMed] [Google Scholar]
- Cui J, Iwase S, Mano T, Katayama N, Mori S. Sympathetic response to horizontal linear acceleration in humans. J Gravit Physiol. 1999;6:65–66. [PubMed] [Google Scholar]
- Cui J, Mukai C, Iwase S, Sawasaki N, Kitazawa H, Mano T, Sugiyama Y, Wada Y. Response to vestibular stimulation of sympathetic outflow to muscle in humans. J Auton Nerv Syst. 1997;66:154–162. doi: 10.1016/s0165-1838(97)00077-5. [DOI] [PubMed] [Google Scholar]
- Descarries L, Riad M, Parent M. Ultrastructure of the serotonin innervation in the mammalian central nervous system. In: Muller CP, Jacobs B, editors. The Behavioural Neurobiology of Serotonin. Amsterdam: Elsevier; 2010. pp. 65–101. [Google Scholar]
- Dickman JD, Angelaki DE. Vestibular convergence patterns in vestibular nuclei neurons of alert primates. J Neurophysiol. 2002;88:3518–3533. doi: 10.1152/jn.00518.2002. [DOI] [PubMed] [Google Scholar]
- Epema AH, Gerrits NM, Voogd J. Commissural and intrinsic connections of the vestibular nuclei in the rabbit: a retrograde labeling study. Exp Brain Res. 1988;71:129–146. doi: 10.1007/BF00247528. [DOI] [PubMed] [Google Scholar]
- Geerling JC, Shin J-W, Chimenti PC, Loewy AD. Paraventricular hypothalamic nucleus: Axonal projections to the brainstem. J comp Neurol. 2010;518:1460–1499. doi: 10.1002/cne.22283. [DOI] [PMC free article] [PubMed] [Google Scholar]
- Goodchild AK, Moon EA. Maps of cardiovascular and respiratory regions of rat ventral medulla: Focus on the caudal medulla. J Chem Neuroanat. 2009;38:209–221. doi: 10.1016/j.jchemneu.2009.06.002. [DOI] [PubMed] [Google Scholar]
- Guyenet PG. The sympathetic control of blood pressure. Nat Rev Neurosci. 2006;7:335–346. doi: 10.1038/nrn1902. [DOI] [PubMed] [Google Scholar]
- Highstein SM, Holstein GR. The anatomy of the vestibular nuclei. In: Büttner-Ennever JA, editor. Neuroanatomy of the Oculomotor System. Vol. 151. Amsterdam: Elsevier; 2006. [Google Scholar]
- Holstein GR, Martinelli GP, Henderson SC, Friedrich VL, Rabbitt RD, Highstein SM. Gamma-aminobutyric acid is present in a spatially discrete subpopulation of hair cells in the crista ampullaris of the toadfish, Opsanus tau. J Comp Neurol. 2004;471:1–10. doi: 10.1002/cne.11025. [DOI] [PubMed] [Google Scholar]
- Jeske I, Reis DJ, Milner TA. Neurons in the barosensory area of the caudal ventrolateral medulla project monosynaptically on to sympathoexcitatory bulbospinal neurons in the rostral ventrolateral medulla. Neurosci. 1995;65:343–353. doi: 10.1016/0306-4522(94)00470-p. [DOI] [PubMed] [Google Scholar]
- Kaufmann H, Biaggioni I, Voustianiouk A, Diedrich A, Costa F, Clarke R, Gizzi M, Raphan T, Cohen B. Vestibular control of sympathetic activity. An otolith-sympathetic reflex in humans. Exp Brain Res. 2002;143:463–469. doi: 10.1007/s00221-002-1002-3. [DOI] [PubMed] [Google Scholar]
- Kerman IA, Akil H, Watson SJ. Rostral elements of sympatho-motor circuitry: A virally mediated transsynaptic tracing study. J Neurosci. 2006;26:3423–3433. doi: 10.1523/JNEUROSCI.5283-05.2006. [DOI] [PMC free article] [PubMed] [Google Scholar]
- Kerman IA, Yates BJ. Regional and functional differences in the distribution of vestibulosympathetic reflexes. Am J Physiol. 1998;275:R824–R835. doi: 10.1152/ajpregu.1998.275.3.R824. [DOI] [PubMed] [Google Scholar]
- Madden CJ, Sved AF. Rostral ventrolateral medulla C1 neurons and cardiovascular regulation. Cell Mol Neurobio. 2003;23:739–749. doi: 10.1023/a:1025000919468. [DOI] [PubMed] [Google Scholar]
- Minor LB, Goldberg JM. Vestibular-nerve inputs to the vestibulo-ocular reflex: a functional-ablation study in the squirrel monkey. J Neurosci. 1991;11:1636–1648. doi: 10.1523/JNEUROSCI.11-06-01636.1991. [DOI] [PMC free article] [PubMed] [Google Scholar]
- Morrison SF. Glutamate transmission in the rostral ventrolateral medullary sympathetic premotor pathway. Cell and Mol Neurobiol. 2003;23:761–772. doi: 10.1023/a:1025005020376. [DOI] [PubMed] [Google Scholar]
- Natarajan M, Morrison SF. Sympathoexcitatory CVLM neurons mediate responses to caudal pressor area stimulation. Am J Physiol Regulatory Integ Comp Physiol. 2000;279:R364–R374. doi: 10.1152/ajpregu.2000.279.2.R364. [DOI] [PubMed] [Google Scholar]
- Newlands SD, Perachio AA. Central projections of the vestibular nerve: a review and single fiber study in the Mongolian gerbil. Brain Res Bull. 2003;60:475–495. doi: 10.1016/s0361-9230(03)00051-0. [DOI] [PubMed] [Google Scholar]
- Paxinos G, Carrive P, Wang H, Wang P-Y. Chemoarchitectonic Atlas of The Rat Brainstem. San Diego: Academic Press; 1999. [Google Scholar]
- Paxinos G, Watson C. The Rat Brain in Stereotaxic Coordinates. San Diego: Academic Press; 1998. [Google Scholar]
- Pilowsky PM, Goodchild AK. Baroreceptor reflex pathways and neurotransmitters: 10 years on. J Hypertens. 2002;20:1675–1688. doi: 10.1097/00004872-200209000-00002. [DOI] [PubMed] [Google Scholar]
- Porter JD, Balaban CD. Connections between the vestibular nuclei and regions that mediate autonomic function in the rat. J Vest Res. 1997;7:63–76. [PubMed] [Google Scholar]
- Radtke A, Popov K, Bronstein AM, Gresty MA. Vestibulo-autonomic control in man: Short- and long-latency vestibular effects on cardiovascular function. J Vest Res. 2003;13:25–37. [PubMed] [Google Scholar]
- Raju DV, Smith Y. Curr Protoc Neurosci. Unit 1.14. Chapter 1. 2006. Anterograde axonal tract tracing. [DOI] [PubMed] [Google Scholar]
- Ray CA, Carter JR. Review: Vestibular activation of sympathetic nerve activity. Acta Physiol Scand. 2003;177:313–319. doi: 10.1046/j.1365-201X.2003.01084.x. [DOI] [PubMed] [Google Scholar]
- Ray CA, Hume KM, Steele SL. Sympathetic nerve activity during natural stimulation of horizontal semicircular canals in humans. Am J Physio. 1998;275:R1274–R1278. doi: 10.1152/ajpregu.1998.275.4.R1274. [DOI] [PubMed] [Google Scholar]
- Reis DJ, Morrison SF, Ruggiero D. The C1 area of the brainstem in tonic and reflex control of blood pressure. Hypertens. 1988;11:I8–I13. doi: 10.1161/01.hyp.11.2_pt_2.i8. [DOI] [PubMed] [Google Scholar]
- Rohrer H, Acheson AL, Thibault J, Thoenen H. Developmental potential of quail dorsal root ganglion cells analyzed in vitro and in vivo. J Neurosci. 1986;6:2616–2624. doi: 10.1523/JNEUROSCI.06-09-02616.1986. [DOI] [PMC free article] [PubMed] [Google Scholar]
- Ruggiero DA, Cravo SL, Golanov E, Gomez R, Anwar M, Reis DJ. Adrenergic and non-adrenergic spinal projections of a cardiovascular-active pressor area of medulla oblongata: quantitative topographic analysis. Brain Res. 1994;663:107–120. doi: 10.1016/0006-8993(94)90468-5. [DOI] [PubMed] [Google Scholar]
- Ruggiero DA, Mtui EP, Otake K, Anwar M. Vestibular afferents to the dorsal vagal complex: substrate for vestibulo-autonomic interactions in the rat. Brain Res. 1996;743:294–302. doi: 10.1016/s0006-8993(96)01099-2. [DOI] [PubMed] [Google Scholar]
- Schofield BR. Retrograde axonal tracing with fluorescent markers. Curr Protoc Neurosci. 2008;43 Chapter 1(Unit 1.17) doi: 10.1002/0471142301.ns0117s43. [DOI] [PubMed] [Google Scholar]
- Schreihofer AM, Guyenet PG. The baroreflex and beyond: control of sympathetic vasomotor tone by GABAergic neurons in the ventrolateral medulla. Clin Exp Pharmacol Physiol. 2002;29:514–521. doi: 10.1046/j.1440-1681.2002.03665.x. [DOI] [PubMed] [Google Scholar]
- Schreihofer AM, Stornetta RL, Guyenet PG. Regulation of sympathetic tone and arterial pressure by rostral ventrolateral medulla after depletion of C1 cells in rat. J Physiol. 2000;529:221–236. doi: 10.1111/j.1469-7793.2000.00221.x. [DOI] [PMC free article] [PubMed] [Google Scholar]
- Sekirnjak C, Du Lac S. Physiological and anatomical properties of mouse medial vestibular nucleus neurons projecting to the oculomotor nucleus. J Neurophysiol. 2006;95:3012–3023. doi: 10.1152/jn.00796.2005. [DOI] [PubMed] [Google Scholar]
- Spyer KM. Neural organisation and control of the baroreceptor reflex. Rev Physiol Biochem Pharmacol. 1981;88:24–124. [PubMed] [Google Scholar]
- Stocker SD, Steinbacher BC, Balaban CD, Yates BJ. Connections of the caudal ventrolateral medullary reticular formation in the cat brainstem. Exp Brain Res. 1997;116:270–282. doi: 10.1007/pl00005755. [DOI] [PubMed] [Google Scholar]
- Stornetta RL. Neurochemistry of bulbospinal presympathetic neurons of the medulla oblongata. J Chem Neuroanat. 2009;38:222–230. doi: 10.1016/j.jchemneu.2009.07.005. [DOI] [PMC free article] [PubMed] [Google Scholar]
- Stornetta RL, Sevigny CP, Schreihofer AM, Rosin DL, Guyenet PG. Vesicular glutamate transporter DNPI/VGLUT2 is expressed by both C1 adrenergic and non-adrenergic presympathetic vasomotor neurons of the rat medulla. J comp Neurol. 2002b;444:207–220. doi: 10.1002/cne.10142. [DOI] [PubMed] [Google Scholar]
- Strack AM, Sawyer WB, Platt KB, Loewy AD. CNS cell groups regulating the sympathetic outflow to adrenal gland as revealed by transneuronal cell body labeling with pseudorabies virus. Brain Res. 1989;491:274–296. doi: 10.1016/0006-8993(89)90063-2. [DOI] [PubMed] [Google Scholar]
- Straka H, Biesdorf S, Dieringer N. Canal-specific excitation and inhibition of frog second-order vestibular neurons. J Neurophysiol. 1997;78:1363–1372. doi: 10.1152/jn.1997.78.3.1363. [DOI] [PubMed] [Google Scholar]
- Straka H, Holler S, Goto F. Patterns of canal and otolith afferent input convergence in frog second-order vestibular neurons. J Neurophysiol. 2002;88:2287–2301. doi: 10.1152/jn.00370.2002. [DOI] [PubMed] [Google Scholar]
- Sved AF, Ito S, Sved JC. Brainstem mechanisms of hypertension: Role of the rostral ventrolateral medulla. Curr Hypertens Rep. 2003;5:262–268. doi: 10.1007/s11906-003-0030-0. [DOI] [PubMed] [Google Scholar]
- Voustianiouk A, Kaufmann H, Diedrich A, Raphan T, Biaggioni I, MacDougall H, Ogorodnikov D, Cohen B. Electrical activtion of the human vestibulo-sympathetic reflex. Exp Brain Res. 2006;171:251–261. doi: 10.1007/s00221-005-0266-9. [DOI] [PubMed] [Google Scholar]
- Yates BJ. Vestibular influences on the autonomic nervous system. Ann NY Acad Sci. 1996;781:458–473. doi: 10.1111/j.1749-6632.1996.tb15720.x. [DOI] [PubMed] [Google Scholar]
- Yates BJ, Aoki M, Burchill P, Bronstein AM, Gresty MA. Cardiovascular responses elicited by linear acceleration in humans. Exp Brain Res. 1999;125:476–484. doi: 10.1007/s002210050705. [DOI] [PubMed] [Google Scholar]
- Yates BJ, Bronstein AM. The effects of vestibular system lesions on autonomic regulation: Observations, mechanisms, and clinical implications. J Vest Res. 2005;15:119–129. [PubMed] [Google Scholar]
- Yates BJ, Goto T, Bolton PS. Responses of neurons in the rostral ventrolateral medulla of the cat to natural vestibular stimulation. Brain Res. 1993;601:255–264. doi: 10.1016/0006-8993(93)91718-8. [DOI] [PubMed] [Google Scholar]
- Yates BJ, Grélot L, Kerman IA, Balaban CD, Jakus J, Miller AD. Organization of vestibular inputs to nucleus tractus solitarius and adjacent structures in cat brain stem. Am J Physiol. 1994;267:R974–R983. doi: 10.1152/ajpregu.1994.267.4.R974. [DOI] [PubMed] [Google Scholar]
- Yates BJ, Siniaia MS, Miller AD. Descending pathways necessary for vestibular influences on sympathetic and inspiratory outflow. Am J Physiol. 1995;268:R1381–R1385. doi: 10.1152/ajpregu.1995.268.6.R1381. [DOI] [PubMed] [Google Scholar]


