Abstract
In an accompanying paper, we find specific localization of diabetogenic T cells only to islets of Langerhans bearing the specific antigen. Instrumental in the specific localization was the presence of intraislet dendritic cells bearing the β-cell-peptide-MHC complex. Here, we report that the entry of diabetogenic CD4 T cells very rapidly triggered inflammatory gene expression changes in islets and vessels by up-regulating chemokines and adhesion molecules. Vascular cell adhesion molecule-1 (VCAM-1) expression was notable in blood vessels, as was intercellular adhesion molecule-1 (ICAM-1). ICAM-1 was also found on β-cells. These expression changes induced the entry of nonspecific T cells that otherwise did not localize to the islets. In contrast to the entry of diabetogenic CD4 T cells, the entrance of nonspecific T cells required a chemokine response and VCAM-1 expression by the islets. IFN-γ was important for the early gene expression changes in the islets. By microarray analysis, we detected up-regulation of a group of IFN-inducible genes as early as 8 h post–T-cell transfer. These studies establish that entry of diabetogenic T cells induces a state of receptivity of islets to subsequent immunological insults.
Keywords: T-cell migration, autoimmunity, type 1 diabetes
The entry of T cells to tissues containing antigen-presenting cells (APCs) bearing their protein antigen leads to an inflammatory response. Within a few days, specific cells are difficult to distinguish among the many inflammatory cells made up of various leukocytes: macrophages, dendritic cells (DC), natural killer cells, and neutrophils. These events have been extensively examined, mainly in the case of the central nervous system (CNS) autoreactivity, where activated myelin antigen-specific T cells migrate to the CNS, leading to autoimmune encephalomyelitis (1). Flow of specific and nonspecific T cells into the capillaries of the cerebral vasculature and adherence to endothelial cells has been shown, particularly after inflammation (2–4). The retention of the circulating autoreactive T cells that allows the passage across the blood–brain barrier depends on the presence of class II MHC bearing APC within the perivascular or Virchow–Robin space (5, 6). After specific T cells are in play, they dictate the migration of nonspecific T cells into the CNS (4, 6, 7). Moreover, a random nonspecific entry and exit of T cells has been described in the mouse and rat (4, 8–10).
In the case of autoimmune diabetes, activated diabetogenic CD4 T cells localized only to islets bearing their cognate antigen; thus, in mice bearing hen-egg white lysozyme (HEL) under the insulin promoter (IP-HEL), T cells bearing a transgenic T-cell receptor for HEL peptides only localized to islets bearing HEL. The same was true for the localization of diabetogenic T cells in the NOD model of spontaneous diabetes (11). In both cases, the intraislet DCs were instrumental in the presentation of the peptide-MHC complexes and in the localization of the CD4 T cells. We did not obtain evidence that activated CD4 T cells would localize to noninflamed islets unless they expressed the antigenic proteins. We now report that islets rapidly changed their biological response on entry of diabetogenic CD4 T cells, leading to profound changes and making islets permissive to the entry of nondiabetogenic cells.
Results
Entry of Diabetogenic T Cells Induces Changes in Islets and the Entry of Nonspecific CD4 T Cells.
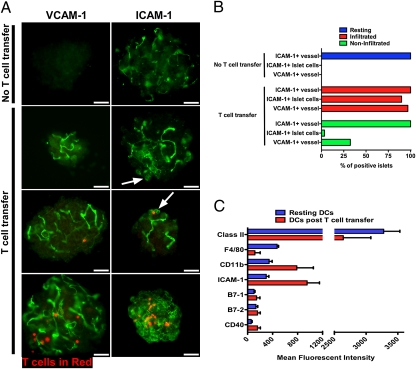
Localization of activated CD4 T cells to islets of Langerhans rapidly triggered changes within the β-cells, blood vessels, and DCs. By 24 h, endothelial cells as well as β-cells were intensely positive for ICAM-1. Strikingly, VCAM-1 expression in blood vessels became positive by 24 h (Fig. 1 A and B shows experiments in IP-HEL mice). Flow cytometry analysis of islet cells (gated on CD45-negative cells) at 24 h post–T-cell transfer corroborated the increased expression of ICAM-1 compared with mice that did not receive T cells (∼52% and ∼15%, respectively, from three independent experiments). Other markers analyzed (CD62E and CD62P) were negative in resting and inflamed islets. X-irradiation did not induce any such changes in the β-cells, vessels, or DCs; moreover, identical findings were made in islets from irradiated mice where the upper abdomen was shielded by a lead cuff.
Fig. 1.
Islet changes after early T-cell entry. (A) VCAM-1 and ICAM-1 are shown in green, and T cells are in red (labeled in red with CMTPX) in IP-HEL islets. T-cell transfer refers to islets 24 h after 3A9 T-cell transfer. Arrows indicate ICAM-1 expression on endocrine cells, which includes β-cells. Data are representative of three experiments. (Scale bars, 50 μm.) (B) Percentage of positive ICAM-1 and VCAM-1 in islets from previous experiments (A). Bars indicate expression of ICAM-1 and VCAM-1 from untreated mice (no T-cell transfer) and mice injected with T cells (T-cell transfer) divided into those islets containing T cells (infiltrated) and islets without T cells (noninfiltrated). (C) Flow cytometry analysis of dispersed islets from IP-HEL mice evaluating phenotype changes in resting DCs (no T-cell transfer) and 24 h after 3A9 T-cell transfer DCs post–T-cell transfer. CD11c/CD45+ cells were evaluated for expression levels (mean fluorescent intensity) of DC membrane markers as indicated. Compiled data from two independent experiments.
The extent of the response roughly correlated with the number of T cells found in islets. Islets that contained more than ∼10 T cells showed strong expression of ICAM-1 on the entire islet (endocrine cells and vessels), whereas those that contained fewer T cells showed weaker ICAM-1 expression, usually localized to islet cells proximal to the T cells (Fig. 1 A and B). To note, about one-third of islets showed VCAM-1–positive vessels without detectable T cells (Fig. 1B). Either CD4 T cells entered, imprinted on islet reactivity, and then left, or islets bearing CD4 T cells influenced the surrounding islets. Similar findings were made when transferring the diabetogenic BDC 2.5 (BDC) T cells into NOD Rag1−/− mice.
Islet DCs also changed their expression of surface markers after CD4 T-cell transfer. Islet DCs from nondiabetic strains such as IP-HEL and NOD Rag1−/− mice were positive for class II MHC molecules, F4/80, and CD11b and weakly positive for ICAM-1, B7-1, B7-2, and CD40 (12). Twenty-four hours after T-cell transfer, islet DC from IP-HEL mice showed up-regulation of CD11b, ICAM-1, B7-1, and CD40 and a minor increase in B7-2. Class II MHC expression remained about the same, whereas F4/80 expression was reduced (Fig. 1C). Whether these modifications reflect changes in the islet DC or entry of new cells from blood has not been examined.
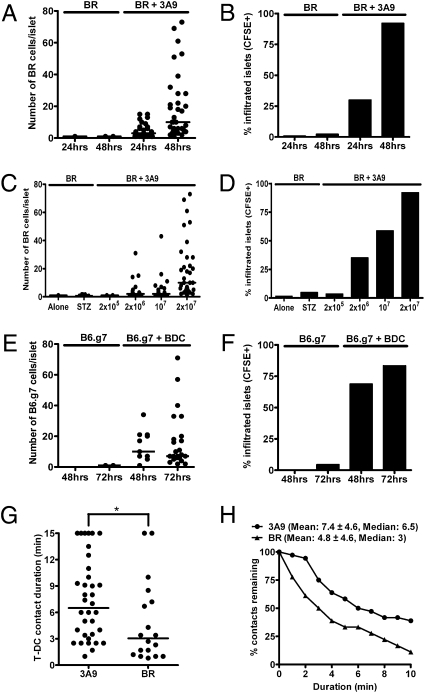
We asked whether nonspecific T cells that did not enter normal islets would behave differently after the localization of diabetogenic T cells. Indeed, as a result of such changes, nonspecific CD4 T cells localized to islets if coinjected with activated diabetogenic T cells (Fig. 2). When cotransferred with carboxyfluorescein succinimidyl ester (CFSE)-labeled 3A9 T cells, nonspecific CD4 T cells localized to 30% of the IP-HEL islets at 24 h, increasing to 92% by 48 h (Fig. 2 A and B). The nonspecific CD4 T cells were from B10.BR (BR) mice activated by a 24-h culture with concanavalin A. Unstimulated nonspecific T cells also localized when injected with 3A9 T cells but to a lesser extent than when activated: 35% of the islets contained nonspecific CD4 T cells by 48 h. The localization of nonspecific CD4 T cells depended on the amount of cotransferred diabetogenic T cells (Fig. 2 C and D).
Fig. 2.
Entry of nonspecific CD4 T cells after specific T-cell localization. (A) Activated nonspecific BR CD4 T cells were CFSE-labeled and transferred alone or with activated 3A9 CD4 T cells (indicated at the top of the graph) into sublethally irradiated IP-HEL mice. Cell counts of CFSE+ cells in the islets were obtained at 24 and 48 h posttransfer. (B) Percentage of infiltrated islets with CFSE+ cells from the previous experiment (A). Data are representative of five experiments. (C) Sublethally irradiated IP-HEL mice received activated BR CFSE-labeled CD4 T cells, which were transferred alone into unmanipulated recipients, transferred alone into low-dose STZ-treated mice, or cotransferred with titrating amounts of activated 3A9 CD4 T cells. Cell counts of CFSE+ cells in the islets at 48 h postcell transfer are shown. (D) Percentage of infiltrated islets with BR CD4 T cells from the previous experiment (C). Data are representative of two experiments. (E) Activated B6.g7 CD4 T cells were tested as in A, either transferred alone or with activated BDC T cells into NOD Rag1−/− mice. Cell counts were obtained at 24 and 48 h. (F) Percentage of infiltrated islets with CFSE+ cells from a previous experiment (E). Data are representative of three experiments. (G) Two-photon microscopy analysis of isolated islets. Plot shows T cell–DC contact durations of 3A9 (CFSE-labeled) and nonspecific BR (CMAC-labeled) T cells at 24 h postcell transfer in IP-HEL mice. Contact durations were obtained from 10 to 15 min time-lapse movies from two experiments. (H) Analysis showing percentage of T cell–DC remaining contact for any given duration.
Equal findings were seen in the BDC transfer model when nonspecific activated CFSE-labeled B6.g7 CD4 T cells were coinjected into NOD Rag1−/− mice (Fig. 2 E and F). The nonspecific CD4 T-cell entry was dependent on the presence of diabetogenic CD4 T cells, because drug-induced islet inflammation by low-dose streptozotocin (STZ) treatment alone did not influence the nonspecific CD4+ T-cell localization in the islets (Fig. 2 C and D).
The duration of contacts between nonspecific cells and diabetogenic T cells with islet DCs was compared in experiments in which activated 3A9 T cells were cotransferred with activated nonspecific CD4 T cells into IP-HEL mice: isolated islets were then examined by two-photon microscopy. The contact of 3A9 with DC had a median duration of 6.5 min, whereas that of nonspecific cells with DC had a median duration of 3 min (Fig. 2 G and H). By the last point of observation (15 min), 11% of the nonspecific CD4 T cell–DC interactions were still stable compared with 39% of specific CD4 T cell–DC interactions (Fig. 2H).
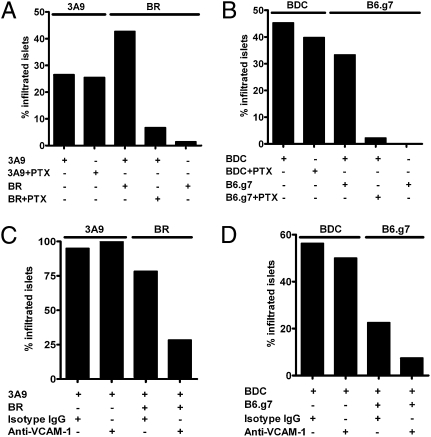
The mechanisms of localization of diabetogenic and nonspecific T cells differed. First, the percentage localization of neither 3A9 nor BDC T cells was affected by blocking chemokine receptor signaling by treatment with pertussis toxin (PTx) before their transfer (Fig. 3 A and B). In contrast, the localization of activated nonspecific T cells was impaired. Second, VCAM-1 expression in the vessels of inflamed islets was required for the localization of nonspecific activated CD4 T cells but not diabetogenic T cells. Although 93% of the activated 3A9 and BDC CD4 T cells were positive for very late antigen-4 (VLA-4) (α4β1, the ligand of VCAM-1; the other ligand was α4β7), blocking VCAM-1 by mAb treatment did not have an effect on the percentage of localization into the islets of IP-HEL or NOD Rag1−/− mice, respectively (Fig. 3 C and D), nor did it affect the number of specific T cells per islet present during the evaluation time point (mean of about 45 and 50 specific T cells per infiltrating islet at 48 h in isotype IgG and anti–VCAM-1 mAb treatment). However, the same mAb reduced the entry of activated nonspecific CD4 T cells cotransferred with the diabetogenic T cells (either 3A9 or BDC) (Fig. 3 C and D) and the number of cells per infiltrated islet (about 10 and 2 nonspecific T cells per infiltrated islet in isotype IgG and anti-VCAM treatment, respectively). Most of the nonspecific activated T cells (87%) also expressed VLA-4.
Fig. 3.
Localization mechanism of nonspecific T cells to islets. (A) Activated 3A9 or nonspecific CFSE-labeled BR T cells were treated with PTx and transferred alone or together. Graph shows the percentage of infiltrated islets after 24 h. Experimental permutations are indicated in the bottom section of the graph. Data are representative of two experiments. (B) The same experimental manipulations and design as in A testing activated BDC and nonspecific B6.g7 T-cell transfers. Data are representative of three experiments. (C) Activated 3A9 or nonspecific CFSE-labeled BR T cells were transferred into sublethally irradiated IP-HEL mice after injection of control isotype antibody or the blocking anti–VCAM-1 mAb. Percentages of infiltrated islets at 48 h are shown. Data are representative of two experiments. (D) The same experimental manipulations as in C testing activated BDC and nonspecific B6.g7 CD4 T cells.
IFN-γ Signaling Influences the Entry of Nonspecific T Cells.
The early entry of diabetogenic and nonspecific CD4 T cells into the islets in the presence or absence of IFN-γ signaling was examined. As described next, the localization of diabetogenic T cells resulted in expression of IFN-activated genes. Previously, we showed that the lack of the IFN-γ receptor (IFN-γR) in NOD Rag1−/− resulted in lower incidence of diabetes, although the islets showed inflammation. The transfer of diabetes required the expression of the IFN-γR on host myeloid cells but not β-cells (13).
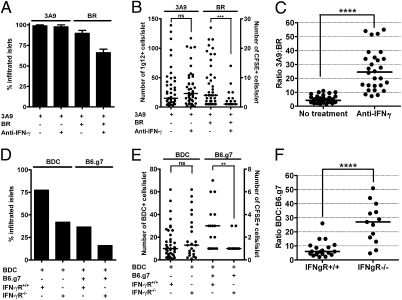
Neutralizing IFN-γ by mAbs did not influence the entry of 3A9 T cells into the islets of IP-HEL mice (Fig. 4 A and B). When activated, nonspecific CD4 T cells were coinjected with 3A9 T cells, the number of islets with nonspecific CD4 T cells was slightly reduced by anti–IFN-γ mAb (66% in the presence of anti–IFN-γ mAb from 93% in the untreated group), but the number of cells within them was clearly affected (Fig. 4 A and B). This effect of neutralizing IFN-γ can best be observed when estimating the relative numbers of specific and nonspecific CD4 T cells per islet (Fig. 4C). Although the control group showed a mean of four diabetogenic CD4 T cells for one nonspecific CD4+ T cell, this ratio was highly altered when IFN-γ was neutralized, showing 24 diabetogenic CD4 T cells to 1 nonspecific T cell.
Fig. 4.
Specific and nonspecific T-cell entry in the presence or absence of IFN-γ signaling. (A) Sublethally irradiated IP-HEL mice treated with or without the anti–IFN-γ neutralizing mAb received 3A9 T cells alone or together with nonspecific activated CFSE-labeled BR CD4 T cells. Percentages of infiltrated islets at 48 h postcell transfer are shown. 3A9 T-cell localizations are averages from three experiments, whereas 3A9 plus nonspecific BR T cells are averages from two experiments. Data represented as mean (± SEM). (B) Representative experiment from A evaluating the number of 3A9 and nonspecific BR T cells per infiltrated islet at 48 h postcell transfer. Left y axis is the number of 3A9 T cells, and right y axis is the number of BR T cells (CFSE-labeled) per islet. (C) Relative ratios of specific to nonspecific T cells from previous experiment (B). Data representative of two experiments. (D) Sublethally irradiated NOD.IFN-γR+/+ and NOD.IFN-γR−/− received either activated BDC T cells alone or together with nonspecific activated CFSE-labeled B6.g7 CD4 T cells as indicated. Percentages of infiltrated islets were evaluated at 48 h postcell transfer. Data representative of two experiments. (E) Representative experiment from D evaluating number of BDC and nonspecific B6.g7 T cells per infiltrated islet at 48 h postcell transfer. Left y axis is the number of BDC T cells, and right y axis is the number of B6.g7 T cells (CFSE-labeled) per islet. (F) Relative ratios of specific to nonspecific T cells from a previous experiment (E). Data representative of two experiments.
The transfer of activated BDC T cells into IFN-γR−/− mice reduced slightly the percentage of infiltrated islets compared with IFN-γR+/+ recipients (42% and 76%, respectively), but the number of cells per infiltrated islet remained about the same (Fig. 4 D and E). Activated nonspecific B6.g7 T-cell entry was affected in the absence of the IFN-γR when coinjected with BDC CD4 T cells (Fig. 4 D–F).
Specific CD4 T-Cell Entry Induces Rapid Changes in Gene Expression.
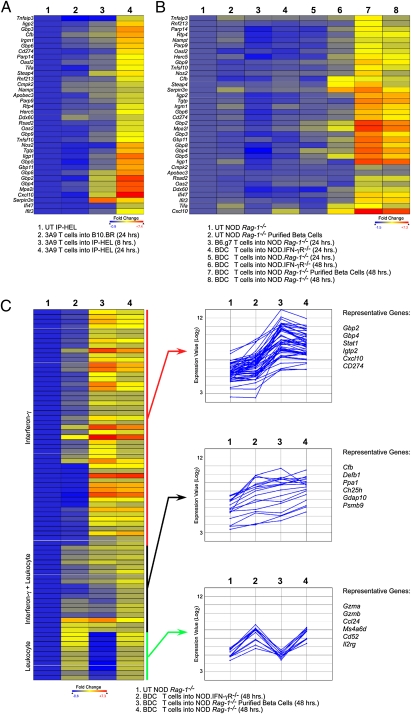
The pattern of transcriptional changes in the islets after T-cell transfer was examined. Within 8 h posttransfer of 3A9 T cells into IP-HEL, there was at least a fourfold up-regulation of six genes: Cxcl10 (5.2-fold), Serpin3n (5.1-fold), Steap4 (4.5-fold), Gbp4 (4.2-fold), Mpa2l (4.3-fold), and Gbp2 (4.8-fold) (Fig. 5A, column 3). More pointedly, at 24 h post-3A9 transfer, 355 genes were found to be up-regulated by at least fourfold. We confined our initial analysis to the most significant genes by performing moderated t test with Benjamini–Hochberg False Discovery Rate analysis (14). Thirty-six genes were up-regulated fourfold or more at a >90% confidence. Thirty of thirty-six genes were up-regulated by IFN signaling (Fig. 5A, column 4): 14 were GTPases, including the p47 and Gbp families of IFN-inducible GTPases (15). Type I IFN (Oas2) and IFN-γ (Icam1) -specific genes were up-regulated (16), but the majority of the genes were up-regulatable by both families of receptors. The most up-regulated transcript was for the chemokine Cxcl10 (∼150-fold up-regulation; P < 0.0001 by moderated t test). There was also up-regulation of Cxcl9 (∼18-fold) and Cxcl11 (∼fivefold). There were no significant changes in inflammatory gene expression when 3A9 T cells were injected into B10.BR mice (Fig. 5A, column 2).
Fig. 5.
IFN gene induction after transfer of diabetogenic T cells. (A) Heat maps of selected genes after T-cell transfer into mice. Untreated (UT) IP-HEL microarray data were compared with IP-HEL 24 h after 3A9 T-cell transfer. Genes were selected based on fourfold change and 90% confidence after moderated t test with Bonferroni–Hochberg False Discovery Rate analysis (FDR). Per row color scaling was used throughout to facilitate visualization. The untreated sample was set as the baseline for all scaling. Genes in the heat maps were grouped by hierarchical clustering with Euclidean distance metric. (B) The same gene list chosen in A was analyzed using the BDC T-cell transfer system using the same parameters as in A. (C) Genes were selected based on fourfold change between untreated NOD Rag1−/− mice and BDC T-cell transfer into NOD Rag1−/− mice. The heat map was grouped by Pearson's Correlation. The same gene list was clustered using k-means analysis and Pearson's Correlation with three gene clusters and 100 trials. Representative genes from each cluster are listed.
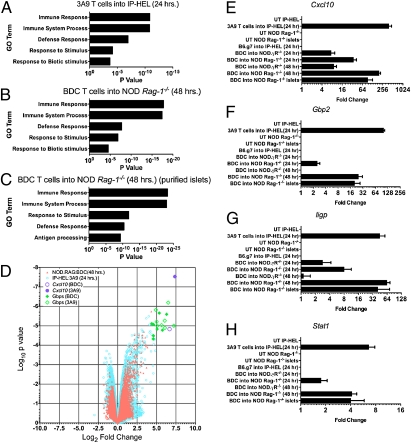
Examination of BDC T-cell transfer revealed a similar gene expression signature but delayed by 1 d (Fig. 5B). At 48 h, the strong IFN-signature transcriptional profile was found, with up-regulation of most of the same genes (Fig. 5B, column 8). The top-expressed transcripts included GTPases, Cxcl10 (∼79-fold; P < 0.0001 by moderated t test), and Cxcl9 (∼24-fold up-regulation; P < 0.0001). Again, Cxcl11 up-regulation was also detected (∼2.5-fold). Most of the IFN signature genes were reduced or absent in NOD.IFN-γR−/− mice after BDC transfer (Fig. 5B, column 6 and Table S1). Global gene expression patterns between the 3A9 and BDC CD4 T-cell transfer models were similar as noted when plotting the entire datasets as volcano plots relating the fold change and statistical significance by moderated t test (Fig. 6D). The Cxcl10 and Gbp genes are highlighted in the volcano plots to facilitate comparison of datasets.
Fig. 6.
Validation of microarray data after diabetogenic T-cell transfers. (A–C) Gene ontology term (GO term) classification of the gene list from Fig. 5A (3A9 T cells into IP-HEL) (A) or from genes found twofold changed from control after BDC T-cell transfer into NOD Rag1−/− mice (B) and from leukocyte-depleted islets (purified islets) after BDC T-cell transfer (C). (D) Genes were sorted into their GO terms, and P values were assigned using hypergeometric probability distribution. Volcano plot comparing the log2-fold change to the log10-moderated t test. P values of all genes from either the BDC or 3A9 T-cell transfers at the indicated times. Values were computed from BDC T-cell transfer into NOD Rag1−/− at 48 h or 3A9 T-cell transfer into IP-HEL mice at 24 h. (E–H) qPCR results for Cxcl10 (E), Gbp2 (F), Iigp (G), or Stat1 (H) for all of the indicated conditions. Leukocyte-depleted islet qPCR results from the untreated group (UT) and 48 h after BDC T-cell transfer are annotated as islets. Data represented as mean (± SEM).
To examine whether the transcriptional changes was a function of islet cells and/or the leukocyte population, whole islets were isolated after BDC T-cell transfer, dispersed, and depleted of the CD45+ and CD11c+ cells by magnetic bead isolation. The postenrichment purity was >99% β-cells, as determined by flow cytometry (Fig. S1). After depleting the contaminating leukocytes, 59 of 77 genes (76%) found at fourfold or higher up-regulation were maintained or increased in relative expression (Fig. 5C and Table S2). The IFN gene signature was evident in the leukocyte-depleted cells: the GTPases and Cxcl9/10 chemokines were detected at comparable levels after leukocytes depletion. Most of the remaining 18 genes were clearly leukocyte-specific gene products. Depletion of leukocytes abolished the detection of leukocyte-specific transcripts such as Gzma, Gzmb, Ms4a4c (all three genes are NK and T cell-specific), Cd53 (pan-leukocyte–specific), and Clec7a (macrophage and dendritic cell-specific). In addition to genes that were mostly IFN-γR–dependent or leukocyte-specific, we found a cluster of genes that were reduced in expression in both IFN-γR−/− recipients and leukocyte-depleted islet cells (compare columns 2 and 4 in Fig. 5C Right Middle). They most likely represent IFN-γ–dependent gene up-regulation on leukocytes, but additional experimentation would be required to validate this conclusion.
By gene ontology (GO) analysis, the top five most significant groupings from the infiltrated islets were immune response, immune system process, defense response, response to stimulus, and response to biotic stimulus (Fig. 6 A and B). The top five groupings from the leukocyte-depleted islet cells after BDC T-cells transfer were immune response, immune system process, response to stimulus, defense response, and antigen processing (Fig. 6C). This was determined by hypergeometric probability distribution, which examines the probability of randomly selecting a particular cluster of genes. There was no change in expression of key islet transcripts, such as glucagon and insulin, or in islet regeneration-related or apoptosis-related genes after T-cell transfer. Therefore, the transcriptional changes were confined to the earliest events in T-cell activation, homing, and entry.
The microarray results were validated by quantitative real time polymerase chain reaction (qRT-PCR). Fig. 6 E–H shows qPCR data for Cxcl10, Gbp2, Iigp, and Stat1. All four genes were found to be up-regulated at levels comparable with those seen in our microarray analyses. Irradiation in the 3A9 into IP-HEL transfer system did not caused changes in gene expression that might have altered the dynamics of the transfer system by inducing nonspecific inflammation. We compared the gene expression profiles of irradiated IP-HEL mice and nonirradiated NOD Rag−/− mice and found no significant difference in expression of inflammatory genes.
Discussion
In a rather short interval after localization of diabetogenic CD4 T cells, the islets developed profound changes and became receptive to cells other than those that originated the disease process. The changes involved three of the cells in the islets: the endothelium, which expressed both ICAM-1 and VCAM-1, the β-cells, expressing a number of genes as well as ICAM-1 (a situation that may makes them susceptible to CD8 T-cell attack), and the DCs themselves. Genes, many having an IFN signature, were very rapidly expressed after specific localization of the diabetogenic T cells. Many genes were expressed in the leukocyte-depleted islet cells, but others were expressed in the entire islet. Included were genes encoding several chemokines as well as a number of small GTPases of unknown function. How these gene products participate in the diabetic process, by protecting or favoring inflammation, needs to be determined. These results do not rule out that other cytokines may participate, perhaps through an analogous process, an issue currently under investigation.
Our microarray analysis was significantly different yet congruent with previous gene expression studies performed on islet cells (17). One study noted the induction of IFN-γ–dependent genes by islets after in vivo treatment with cyclophosphamide (18), attributing them to infiltrating leukocytes. We confirmed here the presence of leukocyte-specific genes, but these constituted a minority of the strongest transcriptional changes. In fact, the leukocyte-depleted islets were a major target for IFN responsiveness in vivo, with 73% of the genes up-regulated 48 h after T-cell injections.
The response to T-cell transfer was dominated by a few highly expressed gene products. Among the most highly up-regulated genes was Cxcl10. We also detected strong up-regulation of the other two CXCR3 chemokines, Cxcl9 and Cxcl11, both chemokines previously implicated in the pathogenesis of type I diabetes.
The abundance of GTPases after T-cell transfer is a clear indicator of IFN signaling. Previous work showed that GTPase up-regulation is a signature of both type I and type II IFN pathways (15). The bias to up-regulation of the p47 and p65 is a signature of the IFN-γ pathway (19). Although much is known about the expression and subcellular localization of p47 and p65 GTPases, their possible role in diabetes induction is unknown. The p47 family members are recruited to nascent phagosomes after infection with bacteria and parasites (15). The p65 family member Gbp1 is recruited to the Golgi after chemical activation (20). The potential biological outcome of p47 and p65 activation during microbial infection has been postulated to involve rapid killing/degradation and trafficking of the pathogen to the antigen-processing compartments. The islet response to IFN-γ signaling may be a preparation for infection with a pathogen. However, the cells of the islet are very rich in secretory components. Could the up-regulation of the GTPases affect the secretory activity of islet cells and contribute to the development of diabetes?
Natural NOD diabetogenesis was affected to variable degrees in situations where the IFN-γ receptor or the structural genes for IFN-γ were mutated. Clearly, other pathways of activation and effector functions are taking place during this chronic process, some of which may be independent of IFNs. We reviewed the influence of IFN-γ in normal diabetogenesis and in various experimental models in a previous study (13).
In brief, the end result of priming the islet was the entrance of nonspecific T cells by mechanisms distinctly different from the diabetogenic cells. It is likely that other cells will enter the primed islets after CD4 T cells: this study was limited to nonspecific CD4 T cells. The presence of Tregs and NK T cells has been documented in the early stages of diabetogenesis, but how they are guided into islets remains unknown (21–23).
Materials and Methods
See ref. 11 for details. For experiments using STZ, a dose of 50 mg/kg i.p. was administered for two consecutive days (24). PTx treatment was performed as in ref. 25 at 100 ng/ml. Microarray, qRT-PCR, evaluation of microarrays, and statistics are described in SI Materials and Methods.
Supplementary Material
Acknowledgments
See ref. 11. Siteman Cancer Center is supported in part by National Cancer Institute Cancer Center Support Grant P30 CA91842. This work was supported by National Institutes of Health Grants AI024742, DK058177, and P60DK20579; Juvenile Diabetes Research Foundation Grant JDRF 1-2007-731; and the Kilo Diabetes and Vascular Research Foundation.
Footnotes
The authors declare no conflict of interest.
Data deposition: The data reported in this paper have been deposited in the Gene Expression Omnibus (GEO) database, www.ncbi.nlm.nih.gov/geo (accession no. GSE26147).
This article contains supporting information online at www.pnas.org/lookup/suppl/doi:10.1073/pnas.1018975108/-/DCSupplemental.
References
- 1.Krishnamoorthy G, Wekerle H. EAE: An immunologist's magic eye. Eur J Immunol. 2009;39:2031–2035. doi: 10.1002/eji.200939568. [DOI] [PubMed] [Google Scholar]
- 2.Baron JL, Madri JA, Ruddle NH, Hashim G, Janeway CA., Jr Surface expression of α 4 integrin by CD4 T cells is required for their entry into brain parenchyma. J Exp Med. 1993;177:57–68. doi: 10.1084/jem.177.1.57. [DOI] [PMC free article] [PubMed] [Google Scholar]
- 3.Katz-Levy Y, et al. Endogenous presentation of self myelin epitopes by CNS-resident APCs in Theiler's virus-infected mice. J Clin Invest. 1999;104:599–610. doi: 10.1172/JCI7292. [DOI] [PMC free article] [PubMed] [Google Scholar]
- 4.Flügel A, et al. Migratory activity and functional changes of green fluorescent effector cells before and during experimental autoimmune encephalomyelitis. Immunity. 2001;14:547–560. doi: 10.1016/s1074-7613(01)00143-1. [DOI] [PubMed] [Google Scholar]
- 5.Greter M, et al. Dendritic cells permit immune invasion of the CNS in an animal model of multiple sclerosis. Nat Med. 2005;11:328–334. doi: 10.1038/nm1197. [DOI] [PubMed] [Google Scholar]
- 6.Kawakami N, et al. Live imaging of effector cell trafficking and autoantigen recognition within the unfolding autoimmune encephalomyelitis lesion. J Exp Med. 2005;201:1805–1814. doi: 10.1084/jem.20050011. [DOI] [PMC free article] [PubMed] [Google Scholar]
- 7.Goverman J. Autoimmune T cell responses in the central nervous system. Nat Rev Immunol. 2009;9:393–407. doi: 10.1038/nri2550. [DOI] [PMC free article] [PubMed] [Google Scholar]
- 8.Hickey WF, Hsu BL, Kimura H. T-lymphocyte entry into the central nervous system. J Neurosci Res. 1991;28:254–260. doi: 10.1002/jnr.490280213. [DOI] [PubMed] [Google Scholar]
- 9.Ransohoff RM, Kivisäkk P, Kidd G. Three or more routes for leukocyte migration into the central nervous system. Nat Rev Immunol. 2003;3:569–581. doi: 10.1038/nri1130. [DOI] [PubMed] [Google Scholar]
- 10.Archambault AS, Sim J, Gimenez MA, Russell JH. Defining antigen-dependent stages of T cell migration from the blood to the central nervous system parenchyma. Eur J Immunol. 2005;35:1076–1085. doi: 10.1002/eji.200425864. [DOI] [PubMed] [Google Scholar]
- 11.Calderon B, Carrero JA, Miller MJ, Unanue ER. Cellular and molecular events in the localization of diabetogenic T cells to islets of Langerhans. Proc Natl Acad Sci USA. 2011;108:1561–1566. doi: 10.1073/pnas.1018973108. [DOI] [PMC free article] [PubMed] [Google Scholar]
- 12.Calderon B, Suri A, Miller MJ, Unanue ER. Dendritic cells in islets of Langerhans constitutively present β cell-derived peptides bound to their class II MHC molecules. Proc Natl Acad Sci USA. 2008;105:6121–6126. doi: 10.1073/pnas.0801973105. [DOI] [PMC free article] [PubMed] [Google Scholar]
- 13.Calderon B, Suri A, Pan XO, Mills JC, Unanue ER. IFN-γ–dependent regulatory circuits in immune inflammation highlighted in diabetes. J Immunol. 2008;181:6964–6974. doi: 10.4049/jimmunol.181.10.6964. [DOI] [PMC free article] [PubMed] [Google Scholar]
- 14.Benjamini Y, Hochberg Y. Controlling the false discovery rate: A practical and powerful approach to multiple testing. J R Stat Soc Series B Stat Methodol. 1995;57:289–300. [Google Scholar]
- 15.MacMicking JD. IFN-inducible GTPases and immunity to intracellular pathogens. Trends Immunol. 2004;25:601–609. doi: 10.1016/j.it.2004.08.010. [DOI] [PubMed] [Google Scholar]
- 16.Der SD, Zhou A, Williams BR, Silverman RH. Identification of genes differentially regulated by interferon α, β, or γ using oligonucleotide arrays. Proc Natl Acad Sci USA. 1998;95:15623–15628. doi: 10.1073/pnas.95.26.15623. [DOI] [PMC free article] [PubMed] [Google Scholar]
- 17.Cardozo AK, Kruhøffer M, Leeman R, Orntoft T, Eizirik DL. Identification of novel cytokine-induced genes in pancreatic β-cells by high-density oligonucleotide arrays. Diabetes. 2001;50:909–920. doi: 10.2337/diabetes.50.5.909. [DOI] [PubMed] [Google Scholar]
- 18.Matos M, Park R, Mathis D, Benoist C. Progression to islet destruction in a cyclophosphamide-induced transgenic model: A microarray overview. Diabetes. 2004;53:2310–2321. doi: 10.2337/diabetes.53.9.2310. [DOI] [PubMed] [Google Scholar]
- 19.Klamp T, Boehm U, Schenk D, Pfeffer K, Howard JC. A giant GTPase, very large inducible GTPase-1, is inducible by IFNs. J Immunol. 2003;171:1255–1265. doi: 10.4049/jimmunol.171.3.1255. [DOI] [PubMed] [Google Scholar]
- 20.Modiano N, Lu YE, Cresswell P. Golgi targeting of human guanylate-binding protein-1 requires nucleotide binding, isoprenylation, and an IFN-γ-inducible cofactor. Proc Natl Acad Sci USA. 2005;102:8680–8685. doi: 10.1073/pnas.0503227102. [DOI] [PMC free article] [PubMed] [Google Scholar]
- 21.Cain JA, Smith JA, Ondr JK, Wang B, Katz JD. NKT cells and IFN-γ establish the regulatory environment for the control of diabetogenic T cells in the nonobese diabetic mouse. J Immunol. 2006;176:1645–1654. doi: 10.4049/jimmunol.176.3.1645. [DOI] [PubMed] [Google Scholar]
- 22.Tang Q, et al. Visualizing regulatory T cell control of autoimmune responses in nonobese diabetic mice. Nat Immunol. 2006;7:83–92. doi: 10.1038/ni1289. [DOI] [PMC free article] [PubMed] [Google Scholar]
- 23.Tang Q, et al. Central role of defective interleukin-2 production in the triggering of islet autoimmune destruction. Immunity. 2008;28:687–697. doi: 10.1016/j.immuni.2008.03.016. [DOI] [PMC free article] [PubMed] [Google Scholar]
- 24.Calderon B, Suri A, Unanue ER. In CD4+ T-cell-induced diabetes, macrophages are the final effector cells that mediate islet β-cell killing: Studies from an acute model. Am J Pathol. 2006;169:2137–2147. doi: 10.2353/ajpath.2006.060539. [DOI] [PMC free article] [PubMed] [Google Scholar]
- 25.Cyster JG, Goodnow CC. Pertussis toxin inhibits migration of B and T lymphocytes into splenic white pulp cords. J Exp Med. 1995;182:581–586. doi: 10.1084/jem.182.2.581. [DOI] [PMC free article] [PubMed] [Google Scholar]
Associated Data
This section collects any data citations, data availability statements, or supplementary materials included in this article.


