

Abstract
In cancer research, high-throughput genomic studies have been extensively conducted, searching for markers associated with cancer diagnosis, prognosis and variation in response to treatment. In this article, we analyze cancer prognosis studies and investigate ranking markers based on their marginal prognosis power. To avoid ambiguity, we focus on microarray gene expression studies where genes are the markers, but note that the methodology and results are applicable to other high-throughput studies. The objectives of this study are 2-fold. First, we investigate ranking markers under three commonly adopted semiparametric models, namely the Cox, accelerated failure time and additive risk models. Data analysis shows that the ranking may vary significantly under different models. Second, we describe a nonparametric concordance measure, which has roots in the time-dependent ROC (receiver operating characteristic) framework and relies on much weaker assumptions than the semiparametric models. In simulation, it is shown that ranking using the concordance measure is not sensitive to model specification whereas ranking under the semiparametric models is. In data analysis, the concordance measure generates rankings significantly different from those under the semiparametric models.
Keywords: cancer prognosis markers, semiparametric survival analysis, concordance measure
INTRODUCTION
Cancer research has entered the -omics era. High-throughput profiling studies have been extensively conducted, searching for markers associated with cancer diagnosis, prognosis and variation in response to treatment [1]. In this article, we analyze cancer prognosis studies with survival outcomes. To avoid ambiguity, we focus on microarray gene expression studies, where genes are the markers, but note that the methods and results are applicable to other high-throughput -omics studies.
Denote T as the survival time, which can be progression-free, overall, or other types of survival. Denote Z = (Z1, … , Zd) as the length d microarray gene expression measurements. Denote Cas the censoring time. Under right censoring, one observation consists of  where I is the indicator function. In a typical microarray study, d is of the order 103‐4. In other genomic (for example, genome wide association) studies, d can be even larger. In practice, it is not feasible to investigate all d genes in detail. More importantly, among the d genes, only a subset is cancer associated, whereas the rest are noises. Thus, it is of great interest to rank the d genes, and only the top-ranked genes are investigated in downstream analysis.
Ranking the marginal prognosis power of markers consists of the following steps.
- For j = 1, … , d,
- describe the relationship between marker j and event time T using the model
 where βj is the regression coefficient, and ϕ is the link function;
 - a statistic measuring the prognosis power of marker j is computed. Examples of the statistic include the magnitude of the estimate of βj, significance level (P-value) of the estimate, likelihood of the model and others. In this study, we use the P-value of the estimate as the ranking statistic, and refer to studies such as [2] for other ranking statistics;
All d markers are ranked based on the magnitudes of ranking statistics. When the P-values are used for ranking, the FDR (false discovery rate) approach can be used to determine a cutoff [3]. Only top-ranked markers with ranking statistics below the cutoff are studied in downstream analysis.
In published studies, the most extensively adopted prognosis model is the Cox proportional hazards model [4, 5]. Alternatives, including the accelerated failure time model, additive risk model and others have also been used. Our literature review suggests that quite often only a single prognosis model is used to rank markers, and there is insufficient model justification or diagnostics. As the first goal of this study, we show that rankings under different prognosis models can be significantly different. We note that, most cancer genomic studies are still at the marker identification stage, and the identified markers will not be used in clinical practice before they are validated in independent studies. However, failing to acknowledge the difference of rankings (under different prognosis models) and adopting inappropriate ranking methods can lead to the wrong sets of markers for downstream validation studies. With multiple candidate models, the ideal approach is to select the most appropriate model using data-adaptive approaches. However, available approaches (for example those in [4, 6]) are developed for data with a small number of markers. To the best of our knowledge, there is still no approach that can select the appropriate survival model for high dimensional cancer genomic data. ‘As an alternative and the second goal of this study, we introduce a nonparametric concordance measure for ranking markers'. This measure depends on weaker assumptions and hence can provide a more robust ranking.
In a recent study, Ma et al. [7] also investigated multiple prognosis models. Unlike in this study, in [7], a joint mode  is assumed. Denote Rn(β1, … , βd) as the log-likelihood function constructed using n iid observations. Ma et al. [7] investigated marker selection based on the Lasso penalized estimate
  and showed that under different prognosis models, the Lasso approach selected significantly different sets of markers. Although this study and [7] both investigate multiple prognosis models, they differ significantly from each other. More specifically, Ma et al. [7] investigated the joint effects of multiple markers, whereas this study focuses on the marginal prognosis power of markers. Both analyses of marginal and joint effects have been extensively conducted in the literature. They describe markers from different prospective and complement each other. In Ma et al. [7], marker selection is achieved using a penalization approach, whereas in this study, ranking statistics are computed for individual markers and marker selection is achieved using the FDR approach. In addition in this study, beyond the semiparametric prognosis models, we also introduce a nonparametric concordance measure, which can provide a more robust ranking of markers. Thus this study is warranted beyond [7].
RANKING PROGNOSIS MARKERS
When computing the ranking statistics, the first approach assumes a semiparametric model with an unknown regression coefficient for each marker. An estimate of the regression coefficient is then computed based on the likelihood or estimating equations, and its significance level is taken as the ranking statistic. An alternative approach assumes a nonparametric model. A nonparametric concordance measure can be computed, and its significance level is taken as the ranking statistic.
Ranking markers under semiparametric survival models
As parametric models are usually too restricted, we focus on semiparametric prognosis models. Among the many available models, the following have attracted the most attention.
Cox proportional hazards model
For marker  under the Cox model, the conditional hazard function is
Here λ0(t) is the unknown baseline hazard function, and βj is the regression coefficient. The Cox model has been extensively employed in gene expression studies [5, 8–10].
Assume n iid observations {(Yi, δi, Zi), i = 1…n}. For marker j, the log-partial likelihood function is  , where
  is the at-risk set at time Yi. Consider the maximum (partial) likelihood estimate
  . Its significance level can be computed using the martingale-based approach in [6]. Many software packages (for example the coxph function in R) can be used to compute the P-value.
AFT model
The AFT (accelerated failure time) model shares a similar spirit with the linear regression model [11]. For marker j under the AFT model,
where, αj is the intercept and εj is the random error with an unknown distribution. Here the logarithm transformation can be replaced by other known monotone transformations. Examples of the AFT model in gene expression studies include [12–15].
For subject i, define
 |
Here  and
and 
 is the KM (Kaplan–Meier) estimate of F, the distribution function of εj, based on the transformed data
  That is
 |
Define  The Buckley-James estimator of
  is defined as
  . Calculation of the significance level of
  is described in [16].
Additive risk model
For marker j, the additive risk model assumes that the conditional hazard function is
where notations have similar interpretations as under the Cox model [11]. The additive risk model has also been used extensively in gene expression studies [16, 17–19].
Define  For the ith subject, denote
  and
and  as the observed event process and the at-risk process, respectively. βj can be estimated by solving
 Here
Here  is the estimate of Λ0 satisfying
 . The resulting estimate of βj satisfies the estimating equation
 |
Inference for  is described in [20].
Remarks
There are other semiparametric prognosis models, including for example the proportional odds model, the accelerated hazard model and others. They are less extensively used and will not be discussed. Among the above three models, the Cox and AFT models belong to the family of transformation models. The Cox and additive risk models describe the conditional hazard function, whereas the AFT model describes the event time directly. A common advantage of the three models is that, although they are semiparametric, the regression coefficients can be estimated without estimating the nonparametric parameters, which significantly reduces the computational complexity. There are several software packages that can be used to compute the estimates and their significance level.
Under mild conditions, each βj can be consistently estimated. When  as
as  , the estimates of βjs are uniformly consistent. Similar results hold for the P-values. Thus, ranking the genes based on the P-values and the FDR approach is asymptotically valid [21].
Ranking markers using a nonparametric concordance measure
A drawback of ranking markers using semiparametric models is that the validity of ranking depends on the validity of model assumptions. With cancer genomic data, it is difficult to determine whether the model assumptions are appropriate. Below we describe a concordance measure, which was proposed in [X. Song et al., submitted for publication]. It relies on much weaker assumptions and hence provides a more robust way of ranking markers.
For marker j, assume that E(T|Zj) = ηj(Zj), where ηj is an unknown monotone function. Note that this model is generic and includes many existing parametric and semiparametric models as special cases. Without loss of generality, assume that ηj is an increasing function (a recoding  can be conducted if necessary). Intuitively, if marker j has prognosis power, the order of {T1, … , Tn} should be similar to that of
  . Thus, the prognosis power of a marker can be evaluated using the concordance between the ranking of event times and the ranking of marker values. Particularly, the nonparametric concordance measure is defined as
This measure has roots in the time-dependent receiver operating characteristic (ROC) techniques [X. Song et al., submitted for publication, 22]. The ROC approaches have been extensively used in evaluating the diagnosis and prognosis power of markers. With ROC, the diagnosis/prognosis power can be summarized with the area under curve (AUC). For marker j at time t, the AUC for the incident ROC curve is  The concordance measure τj is related to the AUC through the formula
  where w(t) = 2f(t)S(t), and f(t) and S(t) are the density and survival functions of the survival time T [23]. Thus the concordance measure can be viewed as a weighted average of the AUC over time. Unlike AUCj(t) which is a function of time, τj is time-independent. It thus can better summarize the prognosis performance of a marker and facilitate the comparison of markers.
Estimation and inference
Note that τj can be rewritten as
 |
If 
 Here SC is the survival function of the censoring time C. In addition, if C is independent of Z,
 Thus, τj can be estimated with
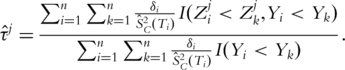 |
Here  is the KM estimate of SC. In [X. Song et al., submitted for publication], it is shown that
Hence  is n1/2 consistent and asymptotically normal. Inference can be based on the asymptotic normality result. For integrity of this article, we provide the definition of
  and outline of the proof of asymptotic properties in Supplementary Appendix I and refer to [X. Song et al., submitted for publication] for more details. Calculation of
  and its significance level can be realized using existing software. Sample R code is available from the authors.
SIMULATION
We conduct simulation study to better understand properties of different ranking approaches. We simulate expressions of 1000 genes for 100 subjects. Gene expressions have marginally standard normal distributions, and expressions of genes j and k have correlation coefficient 0.3|j‐k|. We intentionally set the distributions of gene expressions simpler than those observed in practice. Usually performance of marker identification methods decreases as the correlation structure and distributions of gene expressions become more complicated. Simpler distributions may better reveal the difference caused by ranking approaches. Among the 1000 genes, 30 have small, moderate and large prognosis power and the rest 970 are noises. The true underlying models are set as the Cox, AFT and additive risk models, respectively. We simulate and analyze 500 replicates and present the summary results in Supplementary Appendix II.
Simulation suggests that when the ranking approach matches the true data generating model, it can rank the genes properly. For example, when the Cox model is the true data generating model, ranking under the Cox model puts 23 true positives in the top 30. However, ranking under other semiparametric models is less satisfactory. Ranking under the AFT and additive risk models puts 13 and 15 true positives in the top 30, respectively. Under all three different data generating models, performance of the nonparametric concordance measure is satisfactory. It ranks 21, 22 and 20 true positives in the top 30, respectively. We also compute the Kendall tau rank correlation coefficient [24] between the following two rankings. The first is the ranking of the 30 true positives under the approach that matches the data generating model (i.e. ranking under the optimal ranking approach). The second is the ranking of the true positives under an alternative approach. The Kendall tau correlation is adopted as the ranks are discrete. Supplementary Appendix II suggests that ranking using the nonparametric concordance has a high correlation with ranking under the optimal approach.
Simulation shows that ranking using semiparametric models may be subject to model misspecification. In contrast, ranking using the nonparametric concordance measure is more robust. Even though it is asymptotically consistent, ranking using the concordance measure still differs from ranking under the optimal approach. This finding is not surprising. The concordance measure is nonparametric, which makes it less efficient particularly under small to moderate sample sizes. This explains why the nonparametric approach ranks slightly fewer true positives in the top 30.
DATA ANALYSIS
Data collection and processing
MCL study
Rosenwald et al. [25] reported a study using microarray gene expression analysis in mantle cell lymphoma (MCL). Among 101 untreated patients with no history of previous lymphoma, 92 were classified as having MCL based on established morphologic and immunophenotypic criteria. Survival times of 64 patients were available and 28 patients were censored. The median survival time was 2.8 years (range 0.02–14.05 years). Lymphochip DNA microarrays were used to quantify mRNA expressions in the lymphoma samples from the 92 patients. Data that contains expression values of 8810 cDNA elements is available at http://llmpp.nih.gov/MCL.
DLBCL study
Rosenwald et al. [26] reported a diffuse large B-cell lymphoma (DLBCL) prognosis study. This study retrospectively collected tumor biopsy specimens and clinical data for 240 patients with untreated DLBCL. The median follow up is 2.8 years, with 138 observed deaths. Lymphochip cDNA microarray is used to measure the expressions of 7399 genes. Raw data and detailed experiment protocol are available at http://llmpp.nih.gov/DLBCL/.
Follicular lymphoma study
A study was conducted to determine whether the survival risks of patients with follicular lymphoma (FL) can be predicted by gene expression profiles of the tumors [27]. Fresh-frozen tumor-biopsy specimens from 191 untreated patients who had received a diagnosis of FL were obtained. The median age at diagnosis was 51 years, and the median follow-up time was 6.6 years. Affymetrix U133A and U133B microarray genechips were used to measure expressions of 44928 probes. Detailed experimental setup and the raw data can be accessed at http://llmpp.nih.gov/FL/.
Breast cancer study by van’t Veer et al.
Breast cancer is the second leading cause of death from cancer among women in the United States. Despite major progress in breast cancer treatment, the ability to predict metastasis of the tumor remains limited. van't Veer et al. [28] reported a breast cancer prognosis study investigating the time to distant metastasis. About 97 lymph node-negative breast cancer patients, 55-years old or younger, participated in this study. Among them, 46 developed distant metastases within 5 years. Expression levels for 24 481 gene probes were collected. Data is available at http://www.rii.com/publications/2002/vantveer.html.
Breast cancer study by Sorlie et al.
The original goal of the breast cancer study conducted by Sorlie et al. [29] was to classify breast tumors based on the gene expression patterns derived from cDNA microarrays. A total of 85 cDNA microarray experiments representing 78 cancers were conducted. Survival data is available for 76 patients. Four of these patients were excluded, because the microarray data was from samples obtained after treatment.
Breast cancer study by Huang et al.
The goal of the study reported in Huang et al. [30] was to predict metastasis of breast tumor using gene expressions. Affymetrix genechips were used for the profiling of 71 samples. Expression measurements on 12 625 probes are available.
Breast cancer study in Sotiriou et al.
Sotiriou et al. [31] reported a study correlating gene expression measurements generated using cDNA with clinico-pathological characteristics and clinical outcomes in an unselected group of 99 breast cancer patients. In the original analysis, the Cox model was used to identify genes that were marginally significantly associated with relapse-free survival. In this study, we analyze the 98 patients with complete survival information.
For each data set, we fill in missing expressions using medians across samples. Since usually researchers are more interested in genes with a higher level of variations of expressions, we conduct an unsupervised screening and select the 2000 genes with the largest variances of expressions. We normalize the gene expressions to have median zero and variance one.
RESULTS
We rank markers under the three specific semiparametric models and using the nonparametric concordance measure. Analysis results are presented in Supplementary Appendix III.
In the first set of analysis, we construct the complete ranking of all the 2000 markers. We evaluate the (dis)similarity among the rankings using the Kendall tau rank correlation coefficient [24]. Our data analysis suggests that different rankings are moderately to strongly correlate. Consider for example the MCL data, the rank correlation coefficient ranges from 0.546 to 0.902. With the seven data sets, the smallest rank correlation coefficient is only 0.293 (DLBCL data, the rankings under the AFT model and using the concordance measure). We conclude that the ranking of markers highly depends on the ranking methods and underlying prognosis model.
As the P-value is adopted as the ranking statistic, it is possible to apply the FDR approach and identify markers with significant prognosis power. We adopt the approach in [3] and set the target FDR = 0.1. Results on the numbers of markers identified are provided in Supplementary Appendix III. We find that the numbers of markers identified also highly depend on the ranking methods and prognosis models. For example, with the breast cancer data in [26], the four ranking methods identify 18 (nonparametric concordance), 3 (Cox), 51 (AFT) and 1 (additive) markers. The sets of significant markers identified using different approaches can be significantly different. For example with the breast cancer data in [29], using the nonparametric concordance measure, 20 genes are identified. Under the AFT model, 5 genes are identified. However, the two sets only have 1 gene in common.
We examine the top 100 markers ranked using different methods and find that they have overlaps but can be significantly different. For example, with the DLBCL data, the set of top 100 markers ranked using the nonparametric concordance measure has 56 (Cox), 26 (AFT), 47 (additive) overlapped markers with those ranked under semiparametric models.
DISCUSSION
In cancer genomic studies, it is of interest to rank markers based on their marginal prognosis power. Top ranked markers will be investigated in detail in downstream analysis. When ranking markers, the most commonly adopted approach assumes a specific (semi-, non-)parametric model, computes a statistic from the model, and uses that statistic for ranking. In this article, we review the three most commonly adopted semiparametric prognosis models. Analysis of multiple cancer microarray data sets shows that the ranking may vary significantly under different prognosis models. Under a very weak conditional expectation assumption, we propose using a nonparametric concordance measure to rank markers. As much weaker assumptions are made, the concordance measure provides a more robust way of ranking markers. Another advantage of ranking based on τj is that the ranking is invariant under monotone increasing transformations of Zj. Thus it is capable of accommodating nonlinear effects of markers. Because of the nonparametric nature, a drawback of the concordance measure is its lack of efficiency. Simulation suggests the satisfactory performance of the concordance measure. Data analysis suggests that ranking using the concordance measure can be significantly different from those under specific semiparametric models. Considering the robustness and slight lack of efficiency of the concordance measure, we suggest the following approach in practical data analysis. Ranking using the concordance measure is first conducted. Then multiple parametric and semiparametric models can be used to rank the genes. The Kendall tau rank correlations between the concordance measure ranking and the parametric or semiparametric model rankings are computed. If there is a parametric or semiparametric model rankings close enough to the concordance measure ranking, the corresponding model can be used in downstream analysis. If there is no such parametric or semiparametric model ranking, then the nonparametric concordance measure ranking should be used.
In this study, our conclusions are drawn from both simulation and analysis of real data. The seven data sets focus on lymphoma and breast cancer. We expect similar results to hold with other types of cancers. All four breast cancer studies investigate prognosis free survival. However, we note that all four studies are retrospective, with considerable differences among the demographic characteristics of patients and experimental settings. Thus, it is unclear whether it is appropriate to compare results of the four data sets. It is nontrivial to conduct meta-analysis that can accommodate multiple data sets or extend the nonparametric concordance measure to multi-data sets cases.
In this article, our presentation is in the context of cancer microarray studies. We expect similar conclusions to hold for other profiling platforms and other diseases. We adopt the significance level as the ranking statistic, which can be naturally coupled with the FDR approach to identify significant markers. We have experimented with other ranking statistics (for example the magnitude of the estimated regression coefficients) and reached similar conclusions. Ranking markers is also of great importance in diagnosis and treatment selection studies. In other types of studies and with other types of outcomes/phenotypes, similar ranking problems are also worth investigation. However, it is beyond the scope of this article and hence will not be pursued.
SUPPLEMENTARY DATA
Supplementary data are available online at http://bib.oxfordjournals.org/.
Key Points.
In cancer genomic studies, it is of interest to rank the marginal prognosis power of genomic markers.
There are multiple ways of ranking markers. Numerical studies suggest that different methods may lead to significantly different rankings.
Ranking can also be based on a nonparametric concordance measure, which depends on weaker data and model assumptions and hence can be more robust.
In practical data analysis, more attention needs to be paid to the ranking methods and underlying prognosis models.
FUNDING
National Institutes of Health (grant CA142774 to S.M.); National Science Foundation (NSF) (grant DMS 0904181 to S.M.).
Acknowledgements
The authors thank the editor and three referees for their careful review and insightful comments, which have led to significant improvement of the article.
Biographies
Shuangge Ma obtained his Ph.D. in Statistics from University of Wisconsin, Madison. He is an Assistant Professor in School of Public Health, Yale University.
Xiao Song obtained her Ph.D. in Statistics from North Carolina State University. She is an Assistant Professor in Department of Epidemiology and Biostatistics, College of Public Health, University of Georgia.
References
- 1.Knudsen S. Hoboken, New Jersey: John Wiley and Sons; 2006. Cancer Diagnostics with DNA Microarrays. [Google Scholar]
- 2.Dunkler D, Schemper M, Heinze G. Gene selection in microarray survival studies under possibly non-proportional hazards. Bioinformatics. 2010;26:784–90. doi: 10.1093/bioinformatics/btq035. [DOI] [PubMed] [Google Scholar]
- 3.Benjamini Y, Yekutieli D. The control of the false discovery rate in multiple testing under dependency. Ann Stat. 2001;29:1165–88. [Google Scholar]
- 4.Klein JP, Moeschberger ML. Survival Analysis. New York: Springer; 2003. [Google Scholar]
- 5.Gui J, Li H. Penalized Cox regression analysis in the high dimensional and low-sample size settings, with applications to microarray gene expression data. Bioinformatics. 2005;21:3001–8. doi: 10.1093/bioinformatics/bti422. [DOI] [PubMed] [Google Scholar]
- 6.Fleming TR, Harrington DP. Counting Processes and Survival Analysis. New York: Wiley Interscience; 1991. [Google Scholar]
- 7.Ma S, Huang J, Shi M, et al. Semiparametric prognosis models in genomic studies. Bioinformatics. 2010;11:385–93. doi: 10.1093/bib/bbp070. [DOI] [PMC free article] [PubMed] [Google Scholar]
- 8.Engler D, Li Y. Survival analysis with high-dimensional covariates: an application in microarray studies. Stat Appl Genet Mol Biol. 2009;8:14. doi: 10.2202/1544-6115.1423. [DOI] [PMC free article] [PubMed] [Google Scholar]
- 9.Ma S, Huang J, Shen S. Identification of cancer-associated gene clusters and genes within clusters via clustering penalization. Stat Interface. 2009;2:1–11. doi: 10.4310/sii.2009.v2.n1.a1. [DOI] [PMC free article] [PubMed] [Google Scholar]
- 10.Shoemaker JS, Lin SM. Methods of Microarray Data Analysis IV. New York: Springer; 2004. [Google Scholar]
- 11.Therneau TM, Grambsch RM. Modeling Survival Data: Extending the Cox Model. New York: Springer; 2001. [Google Scholar]
- 12.Datta S, Le-Rademacher J, Datta S. Predicting patient survival from microarray data by accelerated failure time modeling using partial least squares and LASSO. Biometrics. 2007;63:259–71. doi: 10.1111/j.1541-0420.2006.00660.x. [DOI] [PubMed] [Google Scholar]
- 13.Huang J, Ma S, Xie H. Regularized estimation in the accelerated failure time model with high dimensional covariates. Biometrics. 2006;62:813–20. doi: 10.1111/j.1541-0420.2006.00562.x. [DOI] [PubMed] [Google Scholar]
- 14.Schmid M, Hothorn T. Flexible boosting of accelerated failure time models. BMC Bioinformatics. 2008;9:269. doi: 10.1186/1471-2105-9-269. [DOI] [PMC free article] [PubMed] [Google Scholar]
- 15.Sha N, Tadesse MG, Vannucci M. Bayesian variable selection for the analysis of microarray data with censored outcomes. Bioinformatics. 2006;22:2262–8. doi: 10.1093/bioinformatics/btl362. [DOI] [PubMed] [Google Scholar]
- 16.Jin Z, Lin DY, Ying Z. On least-squares regression with censored data. Biometrika. 2006;93:147–61. [Google Scholar]
- 17.Ma S, Kosorok MR, Fine JP. Additive risk models for survival data with high-dimensional covariates. Biometrics. 2006;62:202–10. doi: 10.1111/j.1541-0420.2005.00405.x. [DOI] [PubMed] [Google Scholar]
- 18.Martinussen T, Scheike TH. The additive hazards model with high-dimensional regressors. Lifetime Data Anal. 2009;15:330–42. doi: 10.1007/s10985-009-9111-y. [DOI] [PubMed] [Google Scholar]
- 19.Zhao Y, Zhou Y, Zhao M. Analysis of additive risk model with high-dimensional covariates using partial least squares. Stat Med. 2009;28:181–93. doi: 10.1002/sim.3412. [DOI] [PubMed] [Google Scholar]
- 20.Lin DY, Ying Z. Semiparametric analysis of the additive risk model. Biometrika. 1994;81:61–71. [Google Scholar]
- 21.Kosorok MR, Ma S. Marginal asymptotics for the “large p, small n” paradigm: with applications to microarray data. Ann Stat. 2007;35(4):1456–86. [Google Scholar]
- 22.Pepe MS. The Statistical Evaluation of Medical Tests for Classification and Prediction. Oxford: Oxford University Press; 2003. [Google Scholar]
- 23.Heagerty PJ, Zheng Y. Survival model predictive accuracy and ROC curves. Biometrics. 2005;61:92–105. doi: 10.1111/j.0006-341X.2005.030814.x. [DOI] [PubMed] [Google Scholar]
- 24.Prokhorov AV. Encyclopedia of Mathematics. Springer; 2001. Kendall coefficeint of rank correlation. [Google Scholar]
- 25.Rosenwald A, Wright G, Wiestner A, et al. The proliferation gene expression signature is a quantitative integrator of oncogenic events that predicts survival in mantle cell lymphoma. Cancer Cell. 2003;3:185–97. doi: 10.1016/s1535-6108(03)00028-x. [DOI] [PubMed] [Google Scholar]
- 26.Rosenwald A, Wright G, Chan W, et al. The use of molecular profiling to predict survival after chemotherapy for diffuse large-B-cell lymphoma. N Engl J Med. 2002;346:1937–47. doi: 10.1056/NEJMoa012914. [DOI] [PubMed] [Google Scholar]
- 27.Dave SS, Wright G, Tan B, et al. Prediction of survival in follicular lymphoma based on molecular features of tumor-infiltrating immune cells. N Eng J Med. 2004;351:2159–69. doi: 10.1056/NEJMoa041869. [DOI] [PubMed] [Google Scholar]
- 28.van't Veer LJ, Dai H, van de Vijver, et al. Gene expression profiling predicts clinical outcome of breast cancer. Nature. 2002;415:530–6. doi: 10.1038/415530a. [DOI] [PubMed] [Google Scholar]
- 29.Sorlie T, Perou CM, Tibshirani R, et al. Gene expression patterns of breast carcinomas distinguish tumor subclasses with clinical implications. PNAS. 2001;98:10869–74. doi: 10.1073/pnas.191367098. [DOI] [PMC free article] [PubMed] [Google Scholar]
- 30.Huang E, Cheng SH, Dressman H, et al. Gene expression predictors of breast cancer outcomes. Lancet. 2003;361:1590–6. doi: 10.1016/S0140-6736(03)13308-9. [DOI] [PubMed] [Google Scholar]
- 31.Sotiriou C, Neo SY, McShane LM, et al. Breast cancer classification and prognosis based on gene expression profiles from a population based study. PNAS. 2003;100:10393–8. doi: 10.1073/pnas.1732912100. [DOI] [PMC free article] [PubMed] [Google Scholar]
Associated Data
This section collects any data citations, data availability statements, or supplementary materials included in this article.