

Abstract
BACKGROUND AND PURPOSE
Mistletoe lectin-I (ML-I), the main anti-cancer component of mistletoe extracts, was originally thought to act exclusively on 28S rRNA. Here, we investigate the down-regulating effect and mechanism of CM-1, an ML-I isolated from Chinese mistletoe, on some miRNAs.
EXPERIMENTAL APPROACH
The anti-cancer effects of CM-1 were assessed in vitro and in vivo in colorectal cancer cells. The miRNAs down-regulated by CM-1 were identified by miRNA microarray assay and validated by qRT-PCR analysis. The suppression of host gene transcription or by degradation of precursors was determined by qRT-PCR and enzyme activity assays respectively. The qRT-PCR, Western blot and immunohistochemistry were used to examine the expression of their target gene and related downstream effector. Cell proliferation was assayed in stably transfected HEK-293 cells with different levels of these miRNAs.
KEY RESULTS
CM-1 showed prominent anti-neoplastic activity towards CLY and HT-29 cells both in vitro and in vivo. The miR-135a&b were the miRNAs most down-regulated by CM-1. Their host gene transcription was largely up-regulated, while their precursors were degraded directly by CM-1. The expression of their target gene adenomatous polyposis coli and the phosphorylation of related effector β-catenin were both significantly up-regulated. The IC50 values of CM-1 on derivative HEK-293 cells with high miR-135a&b levels were 2–4 times lower than that of control cells.
CONCLUSIONS AND IMPLICATIONS
CM-1 down-regulated some miRNAs by degrading their precursors, which contributes to its prominent anti-cancer activity.
LINKED ARTICLE
This article is commented on by Rushworth, pp. 346–348 of this issue. To view this commentary visit http://dx.doi.org/10.1111/j.1476-5381.2010.01075.x
Keywords: mistletoe lectin-I, colorectal cancer, miR-135a&b, adenomatous polyposis coli, Wnt signalling pathway
Introduction
The mistletoe (Viscum album) is a semi-parasitic plant widely spread over Europe and parts of Asia. Aqueous mistletoe extracts have been used as a complementary cancer drug for almost a century (Li, 2002). The main biological activity of the extracts has now been attributed to the mistletoe lectin-I (ML-I) (Hajto et al., 1989). ML-I consists of two subunits (A and B) and belongs to the family of ribosome inactivating proteins (RIPs), type II (Barbieri et al., 1993). Subunit A exhibits RNA N-glycosidase activity and selectively cleaves the N-glycosidic bond of the adenine-4324 residue in the conserved GAGA hairpin loop of 28S rRNA (Endo et al., 1987). This effect leads to a catalytical inactivation of ribosomes, thereby inhibiting translation and protein synthesis (Endo and Tsurugi, 1988). The B subunit binds to galactose-containing cell surface receptors of glycoproteins and glycolipids, thereby facilitating penetration of the toxic A-chain to the cytosol and promoting subsequent ribosome inactivation (Lord et al., 1994). RIPs were originally thought to act exclusively on ribosomes or rRNA. Recently, evidence is accumulating that RIPs are also capable of inactivating many non-ribosomal nucleic acid substrates. DNA, tRNA and even a synthetic 35-residue oligoribonucleotide that mimics the single-stranded GAGA loop, can also serve as the substrates for RIP activity (Endo et al., 1991; Barbieri et al., 1997; Hudak et al., 2000). Therefore, it is reasonable to hypothesize that other important RNAs, such as micro-RNA (miRNA), may also be substrates for RIPs.
miRNAs are a class of small non-coding RNAs that negatively regulate gene expression (Ambros, 2003). The genes encoding miRNAs are typically transcribed by RNA polymerase II or III as primary miRNAs (pri-miRNAs), which range from a few hundred to thousand of nucleotides (nt) in length (Esquela-Kerscher and Slack, 2006; Zhao and Srivastava, 2007). The pri-miRNA of each miRNA has a characteristic stem-loop structure that can be recognized and cleaved by ribonuclease Drosha within the nucleus (Esquela-Kerscher and Slack, 2006; Zhao and Srivastava, 2007). The cleavage product, a ∼70-nt precursor miRNA (pre-miRNA) hairpin, is exported from the nucleus and further processed by the ribonuclease Dicer into its mature miRNA (∼21 nt) in the cytoplasm (Esquela-Kerscher and Slack, 2006; Zhao and Srivastava, 2007). The mature single-strand miRNA is incorporated into the RNA-induced silencing complex (RISC), where it guides RISC to silence target mRNAs through mRNA cleavage, translational repression or deadenylation (Esquela-Kerscher and Slack, 2006; Zhao and Srivastava, 2007). In view of the ability of RIPs to remove an adenine in a conserved loop in the 28S rRNA (Endo et al., 1987), we hypothesized that some pri-miRNAs or pre-miRNAs could also be the substrates for RIPs (such as ML-I) owing to their characteristic stem-loop structures, and their corresponding mature miRNAs levels would be down-regulated eventually due to the destruction of the precursors.
Many investigators have reported the significant anti-cancer activity of ML-I on various tumours, including colorectal cancers (CRCs) (Valentiner et al., 2002; Khil et al., 2007). CRC is the third most common cancer worldwide (Parkin et al., 2005). Molecular studies have pinpointed activating mutations of the Wnt signalling pathway as the cause of approximately 90% of CRC (Paul and Dey, 2008). Wnt signalling regulates gene expression by controlling β-catenin levels (Behrens and Lustig, 2004; Paul and Dey, 2008). In the absence of Wnt signalling, cytoplasmic β-catenin is phosphorylated at specific serine and threonine residues by the destruction complex and then undergoes ubiquitination-mediated degradation (Behrens and Lustig, 2004; Paul and Dey, 2008). As a result, no β-catenin travels to the nucleus to regulate the expression of the Wnt target genes (Behrens and Lustig, 2004; Paul and Dey, 2008). In contrast, if Wnt factors are present in the extracellular matrix, stimulation of the Wnt receptors causes loss of activity of the destruction complex (Behrens and Lustig, 2004; Paul and Dey, 2008). Consequently, unphosphorylated β-catenin accumulates and travels to the nucleus and induces the expression of the Wnt target genes (Behrens and Lustig, 2004; Paul and Dey, 2008). Of note, adenomatous polyposis coli (APC), an important tumour suppressor for CRC, is a key component of the destruction complex mentioned previously (Behrens and Lustig, 2004; Paul and Dey, 2008). The role of APC, as a scaffold in the formation of a Wnt-regulated destruction complex that mediates the phosphorylation and therefore degradation of β-catenin, is well established (Fodde, 2002). Loss of APC leads to inappropriate stabilization of β-catenin protein, thus contributing to β-catenin nuclear translocation and constitutive activation of Wnt target genes (Phelps et al., 2009). In addition to mutation and hypermethylation in the APC gene (Rubinfeld et al., 1997; Arnold et al., 2004), miRNA-mediated suppression is also responsible for the low levels of APC in CRC (Nagel et al., 2008). Nagel et al. (2008) have reported that miR-135a&b decrease the translation of the APC transcript by targeting its 3′-untranslated region. Because of the prominent anti-cancer effects of ML-I on CRC cells both in vitro and in vivo (Valentiner et al., 2002; Khil et al., 2007), we are interested to determine whether ML-I would regulate the expression of some important genes (such as Wnt components) in CRC cells through miRNA-mediated suppression.
In an earlier study, an ML-I named CM-1 was purified from Chinese mistletoe and CM-1 showed more than 90% of identity to European ML-I (EML-I) at primary structure level (Kong et al., 2005). The first aim of this study was to analyse the anti-cancer effects of purified CM-1 on CRC cell growth. The second aim was to identify the potential substrate miRNAs for CM-1 and analyse the mechanisms responsible for their down-regulation. The third aim was to investigate the down-regulating effects of the substrate miRNAs on their target genes and downstream signalling pathways. Furthermore, the correlation between the substrate miRNA levels and CM-1 cytotoxic sensitivity has also been investigated in this study.
Methods
Isolation of CM-1
CM-1 was isolated from leaves of the Chinese mistletoe [Viscum coloratum (Komar.) Nakai] harvested from poplar and purified using affinity chromatography and cation exchange chromatography as described previously (Kong et al., 2005). Briefly, mistletoe leaves harvested from poplar trees were powdered, blended and extracted in 0.15 mol·L−1 NaCl–10 mmol·L−1 phosphate-buffered saline (PBS, pH 7.2) overnight at 4°C. After centrifugation, the supernatant was adjusted to be saturated with 70% ammonium sulfate and left for 2–3 h at 4°C. The precipitate was dissolved in PBS, dialyzed several times against the same buffer and then applied to an acid-treated Sepharose column. After washing the column with PBS to remove unbound protein, the bound proteins (CM-1) were eluted with 0.1 mol·L−1 galactose in PBS. The fractions were pooled and dialyzed against PBS. The purification process was performed using cation exchange chromatography under acidic conditions (0.01 mol·L−1 sodium acetate, pH 5.0). Fractions were analysed by sodium dodecyl sulphate (SDS)-polyacrylamide gel electrophoresis (PAGE), and fractions containing 55 kDa protein were pooled, dialyzed against water and freeze dried.
Cell lines and cell culture
The human CRC cell line CLY was established from liver metastases of a CRC patient and characterized with a hyperactive Wnt pathway (Li et al., 2007). The human CRC cell line HT-29 and the human embryonic kidney cell line HEK293 were obtained from the American Type Culture Collection (Manassas, VA, USA). HT-29 was established from the primary tumour of a Caucasian woman with colon adenocarcinoma. All cell lines were cultured in Dulbecco's modified Eagle's medium supplemented with 10% fetal bovine serum, 2 mmol·L−1 L-glutamine, 100 U·mL−1 penicillin and 100 µg·mL−1 streptomycin (Gibco, Paisley, Scotland, UK) in a humidified atmosphere with 5% CO2 at 37°C.
miRNA microarray assay
After incubation with 1.0 ng·mL−1 CM-1 for 72 h, total RNAs from CM-1-treated HT-29 and CLY cells, as well as untreated HT-29 and CLY cells, were isolated using TRIzol reagent (Invitrogen, Carlsbad, CA, USA). Two µg of total RNA from each sample were labelled using the miRCURY™ Hy3™/Hy5™ labelling kit and hybridized on the miRCURY™ LNA Array version 10.0 (Exiqon, Vedbaek, Denmark) using a Tecan HS4800 hybridization station (Tecan Systems, San Jose, CA, USA). The microarray slides were scanned using the Genepix 4000B (Axon Instruments, Sunnyvale, CA, USA) and the data were analysed in Genepix Pro 6.0 (Axon Instruments). The quantified signals were normalized using intensity-dependent global locally weighted scatterplot smoothing regression algorithm (Yang et al., 2002). Differentially expressed miRNAs were identified using one-way analysis of variance (anova). Changes in expression, either twofold greater or less, were considered to be differentially expressed.
Cell proliferation assay
Cells were seeded in 96-well plates at a density of 3000 cells per well. After 24 h culture in the normal growth medium, the cells were exposed to graded concentrations of CM-1 or blank medium (control) for 96 h. After treatment, the viability of the cells was determined by MTT assay. Briefly, MTT (5 mg·mL−1) was added and cells were incubated for 4 h at 37°C. After removing the supernatant, the produced formazan crystals were dissolved in DMSO (Fluka, Buchs, Switzerland) and the absorbance at 570 nm was determined by a microplate reader (Thermo Labsystems, Helsinki, Finland). Absorbance of the untreated control cells was taken as 100% and absorbance of CM-1-treated cells was taken as percentage survival. The 50% inhibitory concentration (IC50) was determined by non-linear regression analysis of the dose-response curves (Microcal Origin 7.0 software, Microcal Software, Inc., Northampton, MA, USA).
In vivo anti-cancer effect assay
All animal care and experimental procedures conformed to the Guide for the Care and Use of Laboratory Animals as adopted and promulgated by Beijing Medical Experimental Animal Care Commission. Six-week-old female athymic nude mice (Balb/c nu/nu) were obtained from Vital River (Beijing, China), housed in controlled specific-pathogen-free conditions (25 ± 1°C constant temperature, 40–60% relative humidity, 12 h lighting cycle) and allowed free access to food (standard rodent chow) and water during the study period.
CRC cells (2 × 10⁶) were injected subcutaneously into the right abdominal flanks of the nude mice (n = 30). Tumour growth was measured with a slide caliper and the volumes were estimated according to the following formula: Tumour volume (mm3) = L × W2/2, where L is length and W is width. When the tumour volume reached about 100 mm3, the mice were separated into two treatment groups and one control group with almost equal mean tumour sizes. The mice in the two CM-1 treatment groups were given CM-1 i.v. at doses of 20 µg·kg−1 every 10 days or 10 µg·kg−1 every 3 days respectively. Control mice were treated the same way, receiving vehicle solution (PBS) only. The experiment was stopped when the tumour volumes of the control mice reached about 1500 mm3. At the end of the treatment, the mice were killed for autopsy and the tumours were recovered and weighed. The tumour growth inhibitory rate was calculated as follows: Inhibitory rate (%) =[1 − (mean tumour weight of treated group)/(mean tumour weight of control group)]× 100.
miRNA and mRNA expression assay
miRNAs from cultured cells or xenograft tissues were extracted using PureLink™ miRNA Isolation Kit (Invitrogen). The extracted miRNAs were polyadenylated and reverse-transcribed to cDNA using the NCode™ miRNA First-Strand cDNA Synthesis kit (Invitrogen). Real-time qPCR was performed using SYBR Green qPCR SuperMix kit (Invitrogen), with the universal qPCR primer and the miRNA-specific forward primers provided by the manufacturer in ABI PRISM 7900 Real-time PCR system (Applied Biosystems, Foster City, CA, USA). The miRNA-specific primer sequences were as follows: miR-135a, 5′- TATGGCTTTTTATTCCTATGTGA-3′; miR-135b, 5′-TATGGCTTTTCATTCCTATGTGA-3′; miR-200c 5′-TAATACTGCCGGGTAATGATGGA-3′; 5s rRNA 5′-GTCTACGGCCATACCACCCTGAAC-3′. The expression levels of miRNAs were normalized to 5s rRNA. Each sample was run in triplicate for analysis.
Total RNAs from cultured cells or xenograft tissues were extracted using Trizol reagent (Invitrogen). Extracted RNA samples were reverse-transcribed to cDNA using the SuperScript III first-strand synthesis system (Invitrogen). mRNA levels were analysed by SYBR Green qPCR SuperMix kit (Invitrogen) and ABI PRISM 7900 Real-time PCR system (Applied Biosystems). The primers used in this experiment are indicated in Table S1. The average of three independent analyses for each gene and sample was calculated and was normalized to the endogenous reference control gene β-actin.
Analysis of CM-1 enzyme activity on pre-miRNA mimics
CM-1 was resuspended in 10 mmol·L−1 HEPES (pH 7.0) and the protein concentration was determined using a protein assay kit (Bio-Rad, Richmond, CA, USA). The single-stranded RNA-oligonucleotides mimicking the stem-loop structures of pre-miRNAs were purchased from Guangzhou RiboBio (Guangzhou, China). The sequences of these RNA-oligonucleotides were as follows: pre-miR135a1, 5′-AUUCCUAUGUGAUUCUACUGCUCACUCAUAUAGGGAU-3′; pre-miR135a2, 5′-AUUCCUAUGUGAUAGUAAUAAAGUCUCAUGUAGGGAU-3′; pre-miR135b, 5′-UCCUAUGUGAUUGCUGUCCCAAACUCAUGUAGGG-3′; pre-miR200c, 5′-GCAGUGUUUGGGUGCGGUUGGGAGUCUCUAAUACUGC-3′. To form the stem-loop structure, the annealing reaction was performed by diluting the RNA-oligonucleotides with 5× annealing buffer (50 mmol·L−1 Tris, pH 8.0, 100 mmol·L−1 NaCl), incubating them at 95°C for 2 min and cooling slowly to room temperature. The enzyme activity analysis was performed by mixing the annealed RNA-oligonucleotides and CM-1 in the reaction buffer (10 mmol·L−1 HEPES, pH 7.0, 2 mmol·L−1 ZnCl2, 2% β-mercaptoethanol) as described previously (Nicolas et al., 2000). The concentration of RNA-oligonucleotides was 10 µmol·L−1 and CM-1 concentrations varied from 2 to 0.2 µmol·L−1 as indicated in Figure 4. To exclude the effect of RNase contamination, 5 U RNase If (NEB, Beverly, MA, USA), as a positive control, was used to treat the same amount of RNA-oligonucleotides. After incubation at 37°C for 30 min, the samples were post-treated with a reducing agent (100 mmol·L−1 NaBH4, 15 min on ice). Assays were terminated by the addition of formamide loading dye. The distribution of substrate and product(s) was resolved by gel electrophoresis in a 15% polyacrylamide-urea gel and visualized using rapid silver stain kit (Tiandz, Beijing, China).
Figure 4.
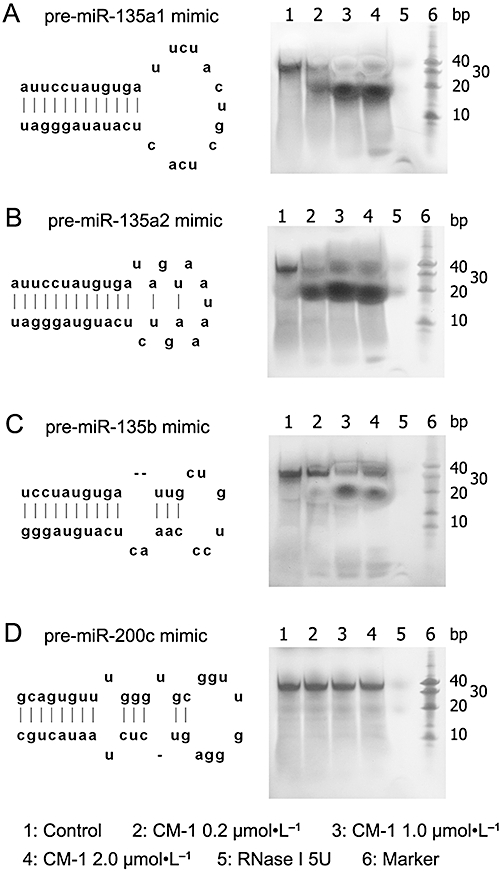
(A–D) The degrading effects of CM-1 on pre-miRNA mimics. Left panels show predicted stem-loop formation of pre-miRNA mimics obtained from miRBase database (http://www.mirbase.org). Right panels, following CM-1 or RNase If treatment, the distribution of substrates (pre-miRNA mimics) and their degradation products were resolved by polyacrylamide-urea gel electrophoresis and visualized by silver staining. All data are representative of three independent experiments.
Western blot analysis
Cultured cells and xenograft tissues were homogenized in RIPA lysis buffer containing 50 mmol·L−1 Tris-HCl (pH 8.0), 150 mmol·L−1 NaCl, 0.02% NaF, 1% NP-40, 0.1% SDS, 0.5% sodium deoxycholate and protease inhibitor cocktail (Roche, Mannheim, Germany). The lysate proteins were resolved by SDS-PAGE, transferred to the Immobilon-P membranes (Millipore, Billerica, MA, USA), blocked with 5% dried skim milk powder in Tris-buffered saline (TBS), and immunoblotted with the antibodies against β-actin, β-catenin, APC (Santa Cruz Biotechnology, Inc., Santa Cruz, CA, USA) and phospho-β-catenin (Cell Signaling Technology, Beverly, MA, USA). The antibodies were detected by enhanced chemiluminescent staining using horseradish peroxidase-conjugated secondary antibodies (Santa Cruz).
Immunohistochemical staining
The tumour tissues were formalin fixed, paraffin embedded and sectioned into 4 µm slices. The tissue sections were deparaffinized, rehydrated and blocked with 3% H2O2 to quench the endogenous peroxidase activity. Antigen retrieval was performed by boiling slides in sodium citrate buffer (10 mmol·L−1, pH 6.0). β-Catenin antibody and APC antibody (Zymed, San Francisco, CA, USA) were used as primary antibodies and detected with horseradish peroxidase-conjugated secondaries and diaminobenzidine (Santa Cruz). Negative controls were treated the same way except replacing the primary antibody by the isotype-matched IgG.
Plasmid vector construction
The plasmids pCDNA3 encoding miR-135a1 and miR-135b were kindly provided by Dr Xiao-fei Zheng (Beijing Institute of Radiation Medicine, Beijing, China) and have been described elsewhere (Cui et al., 2007). The pCDNA3-miR-135a2 and pCDNA3-miR-200c were constructed by cloning the flanking regions of the mature miRNAs between HindIII and XhoI restriction sites of the pCDNA3 vector as described previously (Cui et al., 2007). The flanking regions of the mature miRNAs were amplified from genomic DNA using the following primers: mir-135a2, 5′-TAGAAGCTTAGCGTGAAATGATTGGTTAG-3′ (sense), 5′-TATCTCGAGACACAAGGCAGGTAGCAGAG-3′ (antisense); mir-200c, 5′-TAGAAGCTTAGCAGGGCTCACCAGGAAG-3′ (sense), 5′-TATCTCGAGCAGTCAACCAACAAGAACCAC-3′ (antisense).
Transfections
Stable transfection of miRNAs
For miRNA overexpression studies, HEK293 cells were seeded in 24-well plates and transfected with expression plasmids using Lipofectamine™ 2000 (Invitrogen). The cells were then exposed to a selective concentration (as determined by ‘a killing curve’) of 600 µg·mL−1 geneticin (G418-sulfate; Invitrogen) to isolate stably transfected cells. The mature miRNA expression in the selected clones was assessed by qRT-PCR as described previously.
Transient transfection of miRNA inhibitors
For miRNA inhibition assays, CLY, HT-29, HEK293 and HEK293 derivative cells were seeded in 6-well plates and transfected with specific antagomirs or scrambled negative control (Shanghai GenePharam, Shanghai, China) using Lipofectamine™ 2000. Cells were harvested 48 h after transfection and assayed for miRNA, mRNA and protein expression. The sequences of antagomirs and negative control were as follows: antagomir-135a, 5′-UCACAUAGGAAUAAAAAGCCAUA-3′; antagomir-135b, 5′-UCACAUAGGAAUGAAAAGCAUA-3′; antagomir-200c (control), 5′-UCCAUCAUUACCCGGCAGUAUUA-3′; scrambled negative control, 5′-CAGUACUUUUGUGUAGUACAA-3′.
Statistical analysis
Data were expressed as mean ± SD of at least three independent experiments. One-way anova test followed by Tukey's comparison was performed to ascertain statistical differences between the different treatment groups. Differences were considered statistically significant at P < 0.05.
Results
Anti-cancer activity of CM-1 on CRC cell lines in vitro and in vivo
To determine the cytotoxic effects of CM-1 on CRC cells, CLY and HT-29 cells were treated with CM-1 for 72 h and cell viability was examined by MTT assay. As shown in Figure 1A, CM-1 inhibited the growth of the two cell lines in a concentration-dependent manner. The IC50 values of CM-1 in CLY and HT-29 cells were 0.68 ± 0.07 and 1.62 ± 0.16 ng·mL−1 respectively.
Figure 1.
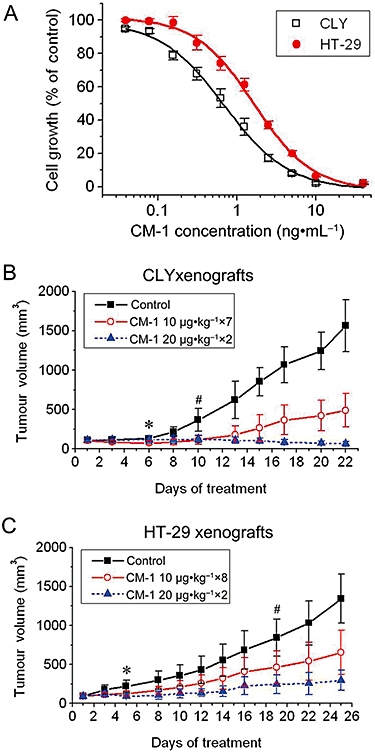
Anti-cancer effect of CM-1 on colorectal cancer cell lines. (A) Anti-cancer effect of CM-1 in vitro. CLY and HT-29 cells were treated with graded concentrations of CM-1 for 72 h, and then cell growth was determined by MTT assay. Experiments were performed in triplicate and IC50 values were determined by non-linear regression with dose-response curve fitting. Anti-tumour effect of CM-1 on CLY (B) and HT-29 (C) xenografts. Nude mouse xenograft models of CLY and HT-29 were established and treated with CM-1. Tumour volume was measured and compared every 2 or 3 days. The initial days showing significant differences between mice treated with 20 µg·kg−1 CM-1, those given 10 µg·kg−1 and the control untreated group are indicated as (*) and (#), respectively (one-way analysis of variance with Tukey's post hoc test, P < 0.05).
To determine whether CM-1 showed anti-cancer activity in vivo, nude mouse xenograft models of CLY and HT-29 were established and treated with CM-1, as described under Methods. Tumours of control groups grew rapidly, increasing in average volume by approximately 15-fold (Figure 1B,C). A statistically significant decrease in the rate of tumour growth compared with the controls was observed in CM-1 groups, with tumours increasing in volume by three to sevenfold during treatment (Figure 1B,C). It was noteworthy that the average CLY tumour growth in animals treated with 20 µg·kg−1 CM-1 was completely inhibited, and in fact these tumours shrank in volume, resulting in a twofold decrease in tumour volume during treatment (Figure 1B). At the end of the treatment, the tumours were recovered and weighed. For CLY xenografts, the average tumour weights of 10 µg·kg−1 group and 20 µg·kg−1 group were 0.47 ± 0.21 and 0.06 ± 0.05 g, respectively, which were much less than that of control group (1.50 ± 0.32 g), and the tumour growth inhibitory rates were 68.5 and 95.8% respectively. Similarly, CM-1 significantly inhibited the growth of HT-29 xenografts. The tumour weights of control group, 10 µg·kg−1 group and 20 µg·kg−1 group were 1.49 ± 0.39, 0.74 ± 0.29 and 0.33 ± 0.15 g respectively. The tumour growth inhibitory rates of 10 µg·kg−1 group and 20 µg·kg−1 group amounted to 50.5 and 78.1% respectively.
Identification of miRNAs down-regulated by CM-1
To identify the miRNAs in CRC cell lines affected by CM-1 treatment, we used miRCURY™ LNA microRNA Arrays to profile miRNA expression in control and CM-1-treated CRC cells. The spotted LNA oligonucleotide arrays contain capture probes for all annotated human miRNAs in the miRNA database miRBase Release 10.0 (http://www.mirbase.org). Among the 428 human mature miRNAs analysed, 22 miRNAs were found to be down-regulated by more than twofold as compared with controls in CM-1-treated CLY cells, and 18 in CM-1-treated HT-29 cells (Table S2). It was worth noting that 12 miRNAs were down-regulated synchronously in the two CM-1-treated CRC cell lines, and miR-135a was the most down-regulated (Table S2). However, only 1 and 3 miRNAs were significantly up-regulated in CM-1-treated CLY and HT-29 cells, respectively (Table S2).
Nagel et al. (2008) have described the elevation of miR-135a&b as a commonly occurring event in CRC pathogenesis. According to the miRNA microarray profiling described previously, miR-135a was the most down-regulated miRNA following CM-1 treatment in both CLY and HT-29 cells, which suggested a potential correlation between miR-135a expression and the anti-cancer mechanism of CM-1. Next, we focused on miR-135a&b and confirmed the down-regulation by CM-1, using qRT-PCR analysis. In vitro, CLY and HT-29 cells were treated with 1.0 or 2.0 ng·mL−1 CM-1 for 72 h and then the miR-135a and miR-135b expression levels of these cells were evaluated. At the same time, miR-200c (showing no significant changes following CM-1 treatment according to microarray profiling) expression level was tested as a negative control of miR-135a&b. As further controls, the effects of antagomir-135a, antagomir-135b (positive controls of CM-1) and antagomir-200c (negative control of CM-1) on CLY and HT-29 cells were analysed. As shown in Figure 2A and B, miR-135a and miR-135b expression levels largely decreased upon CM-1 treatments in both CLY and HT-29 cells. Antagomir-135a and antagomir-135b also induced the degradation of miR-135a and miR-135b (Figure 2A,B). Levels of miR-200c were not changed following the different treatments, with the exception of the transfection of antagomir-200c (Figure 2A,B). In vivo, nude mice with CLY and HT-29 tumour xenografts were treated with 10 or 20 µg·kg−1 CM-1. Three weeks later, the tumours were recovered and miRNAs extracted from these tumour tissues were evaluated. Compared with control group (treated with PBS only), the miR-135a and miR-135b expression levels of CM-1 groups were substantially decreased in both CLY and HT-29 xenografts (Figure 2D,E). However, CM-1 treatment did affect miR-200c levels (Figure 2D,E). Taken together, our results suggested that CM-1 was able to induce the down-regulation of miR-135a&b.
Figure 2.
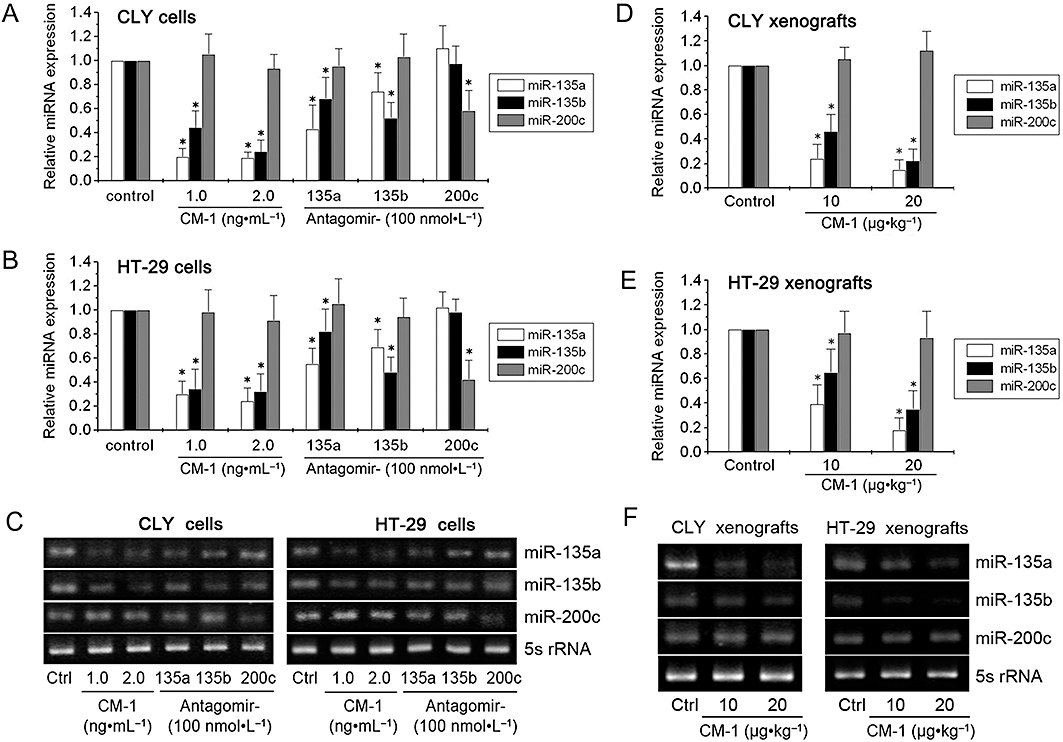
Down-regulation by CM-1 of miR-135a&b. qRT-PCR analysis of miR-135a, miR-135b and miR-200c (as a negative control) in CLY (A) and HT-29 (B) cells treated with PBS, CM-1, antagomir-135a, antagomir-135b, or antagomir-200c. qRT-PCR analysis of miR-135a, miR-135b and miR-200c (as a negative control) in CLY (D) and HT-29 (E) tumour xenografts from nude mice treated with PBS or CM-1. In panels A, B, D and E, data shown are means from three independent experiments after normalization to the internal control 5s rRNA. *P < 0.05, significantly different from the respective controls; one-way analysis of variance with Tukey's post hoc test. (C and F) Electrophoresis of the PCR products was performed to check PCR specificity.
CM-1 down-regulated miR-135a&b not by suppressing transcription
The down-regulation of specific miRNAs induced by CM-1 could be caused by degrading their precursors through deadenylation or by suppressing the expression of their primary transcripts. To understand the exact mechanism, first we used qRT-PCR analysis to determine whether the transcription of pri-miR-135a&b was suppressed. In vitro, the expression levels of pri-miR-135a1, pri-miR-135a2 and pri-miR-135b were not decreased but largely increased upon CM-1 treatments in both CLY and HT-29 cells (Figure 3A,B), which was contrary to the effects of antagomir-135a and antagomir-135b treatment. However, pri-miR-200c levels showed no significant changes following the different treatments, with the exception of the transfection of antagomir-200c (Figure 3A,B). In vivo, CM-1 treatment also significantly enhanced the transcription of pri-miR-135a1, pri-miR-135a2 and pri-miR-135b in both CLY and HT-29 tumour xenografts (Figure 3D,E). But the up-regulation was not observed in pri-miR-200c levels (Figure 3D,E). Overall, CM-1 treatment did not suppress but actually enhanced the transcription of pri-miR-135a&b.
Figure 3.
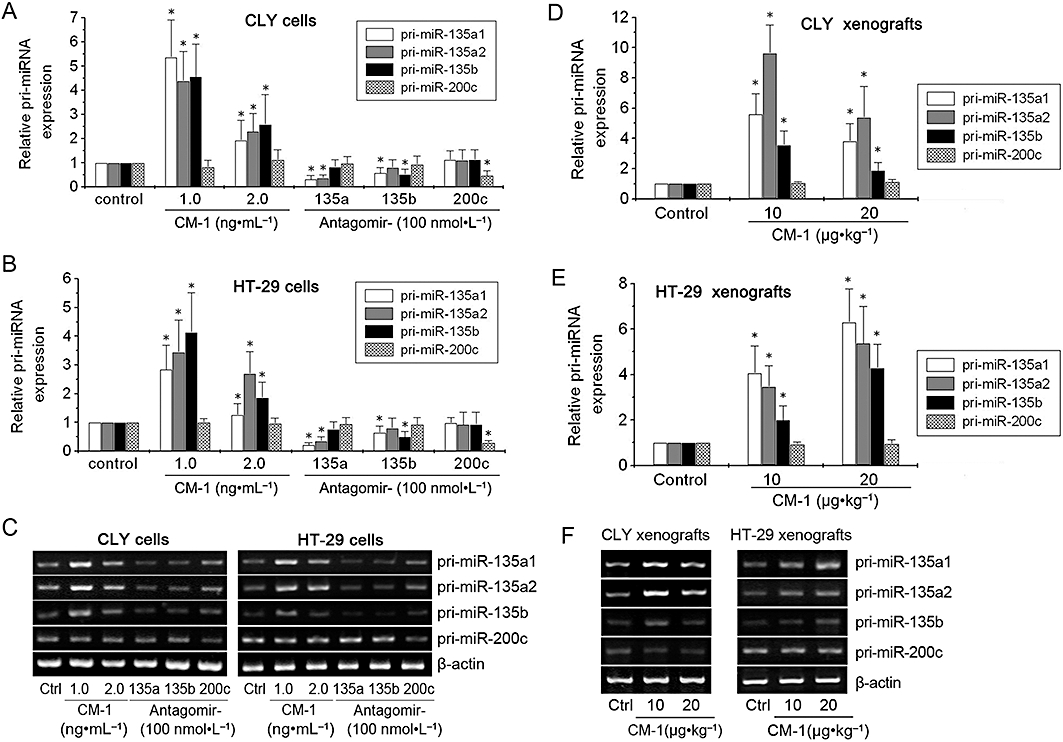
CM-1 down-regulated miR-135a&b without suppressing transcription. qRT-PCR analysis of pri-miR-135a1, pri-miR-135a2, pri-miR-135b and pri-miR-200c (as a negative control) in CLY (A) and HT-29 (B) cells treated with PBS, CM-1, antagomir-135a, antagomir-135b, or antagomir-200c. qRT-PCR analysis of pri-miR-135a1, pri-miR-135a2, pri-miR-135b, and pri-miR-200c (as a negative control) in CLY (D) and HT-29 (E) tumour xenografts from nude mice treated with PBS or CM-1. In panels A, B, D and E, data shown are means from three independent experiments after normalization to the internal control β-actin. *P < 0.05, significantly different from the respective controls; one-way analysis of variance with Tukey's post hoc test. (C and F) Electrophoresis of the PCR products was performed to check PCR specificity.
CM-1 down-regulated miR-135a&b by degrading their precursors
Next, we were interested to determine whether CM-1 could directly induce degradation of miR-135a&b precursors. According to miRBase database (http://www.mirbase.org), we designed some single-stranded RNA-oligonucleotides mimicking the stem-loop structures of pre-miR-135a1, pre-miR-135a2, pre-miR-135b and pre-miR-200c respectively. Following the annealing reaction, 10 µmol·L−1 RNA-oligonucleotides with stem-loop structures were incubated with varying concentrations of CM-1 at 37°C for 30 min. The ratios of CM-1/RNA-oligonucleotides were 0.02, 0.1 and 0.2 respectively. Thereafter, the distribution of substrates and possible products were resolved by polyacrylamide-urea gel electrophoresis and visualized by silver stain. As Figure 4A–C showed, untreated controls (lane 1) exhibited sharp and strong bands between 40 and 30 bp, which represented un-degraded pre-miRNA mimics and were identified as the substrate bands. With the increasing concentration of CM-1, the weakening of the substrate bands and the enhancement of faster migrating product bands (∼20 bp) were observed in pre-miR-135a1, pre-miR-135a2 and pre-miR-135b mimics (Figure 4A–C, lanes 2–4). However, there were no significant changes in banding patterns of CM-1 treated pre-miR-200c mimics (Figure 1D). To further exclude the effect of RNase contamination, 5 U RNase If, as a positive control, was used to treat the same amount of RNA-oligonucleotides. As a result, no perceptible bands were observed in all RNase If treated pre-miRNA mimics (Figure 4, lane 5), which indicated the complete degradation of these RNA oligonucleotides.
CM-1 up-regulated APC expression and β-catenin phosphorylation
Nagel et al. (2008) have reported miR-135a&b target the 3′ untranslated region of APC and suppress its expression. APC, as it is well known, is a scaffold protein for the β-catenin-destruction complex and can facilitate phosphorylation of β-catenin, thereby targeting it for ubiquitination and proteasomal degradation (Fodde, 2002). So we determined whether the down-regulation of miR-135a&b induced by CM-1 could improve APC expression and further affect the stabilization of β-catenin correspondingly. In vitro, CM-1 treatment was associated with a marked increase in APC mRNA levels, which was similar to the effects of antagomir-135a and antagomir-135b treatments (Figure 5A). In contrast, antagomir-200c, as a negative control inhibitor, did not affect APC mRNA expression (Figure 5A). APC protein levels also increased upon the treatments with CM-1, antagomir-135a and antagomir-135b, except antagomir-200c (Figure 5D). As for phospho-β-catenin, a low endogenous level was detected in control CLY and HT-29 cells, and a clear induction was found in both CLY and HT-29 cells treated with CM-1, antagomir-135a or antagomir-135b (Figure 5D), although no significant changes in β-catenin mRNA and total protein levels were observed (Figure 5B,D). However, antagomir-200c, as a negative control inhibitor, had no effect on the phosphorylation status of β-catenin (Figure 5D). In vivo, CM-1 treatment also induced an apparent increase in APC expression and β-catenin phosphorylation (Figure 5E,H). Furthermore, a marked decrease in the total β-catenin protein levels was observed in tumours treated with 20 µg·kg−1 CM-1 (Figure 5H). The results of immunohistochemistry substantiated the effects of CM-1 on APC and β-catenin expression. Following CM-1 treatment, there was a significantly enhanced nuclear and cytoplasmic staining of APC in both CLY and HT-29 tumour tissues (Figure 5I). As for β-catenin, CLY and HT-29 tumour tissues of control groups exhibited nuclear and membranous staining, respectively, and no significant changes were observed in tumour tissues of mice treated with 10 µg·kg−1 CM-1 (Figure 5I). However, tumour tissues of the group treated with 20 µg·kg−1 did not show any perceptible β-catenin staining (Figure 5I). CM-1 treatment increased APC expression, improved β-catenin phosphorylation and further degradation.
Figure 5.
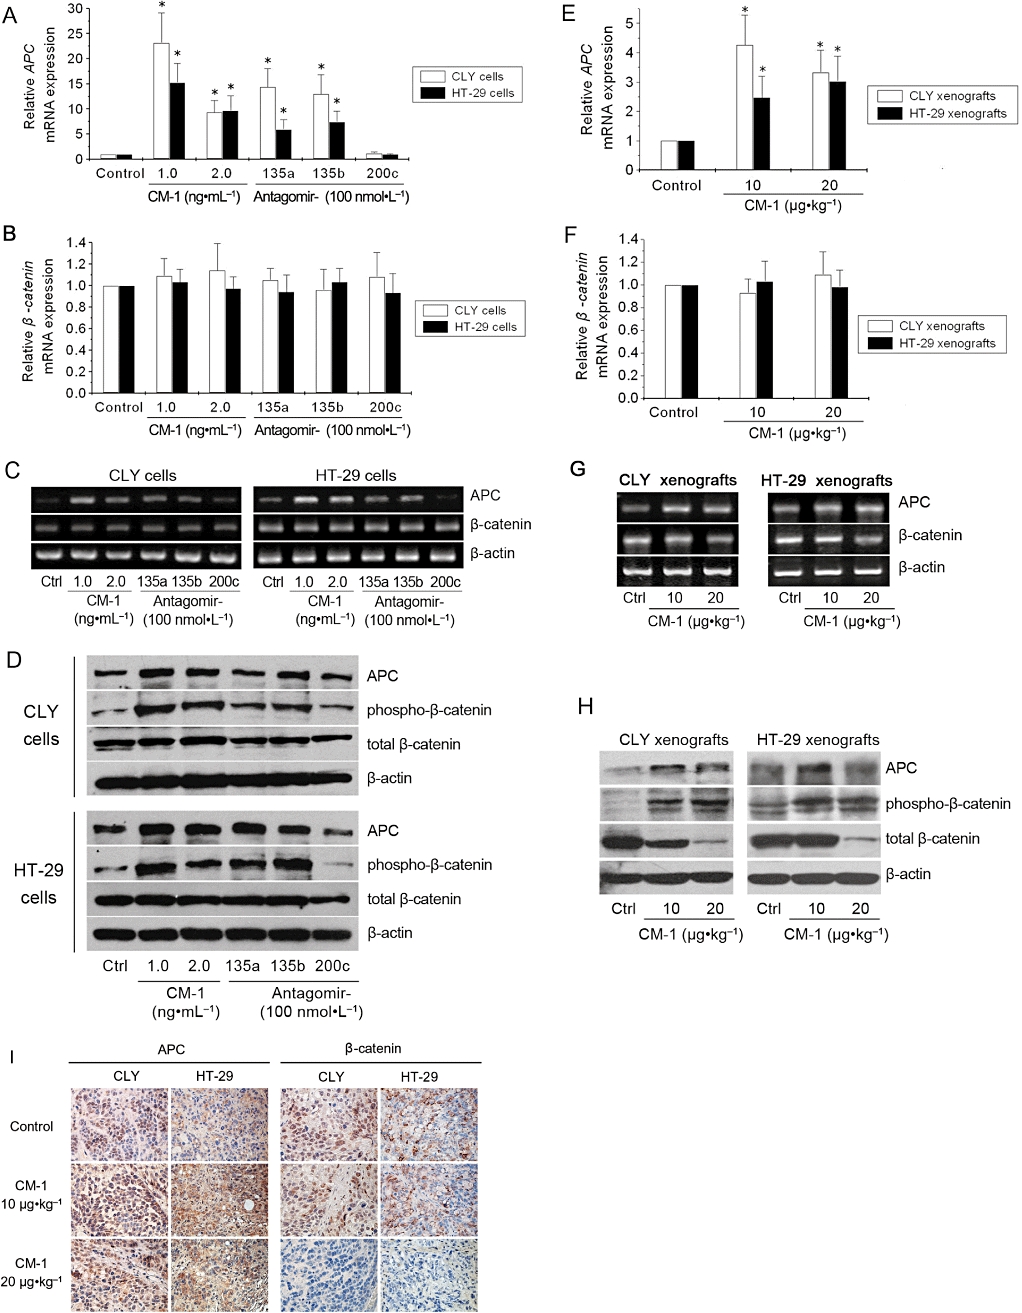
CM-1 upregulated adenomatous polyposis coli (APC) expression and β-catenin phosphorylation. qRT-PCR analysis of APC and β-catenin mRNA levels in CLY (A) and HT-29 (B) cells treated with PBS, CM-1, antagomir-135a, antagomir-135b, or antagomir-200c. qRT-PCR analysis of APC and β-catenin mRNA levels in CLY (E) and HT-29 (F) tumour xenografts from nude mice treated with PBS or CM-1. In panels A, B, E and F, data shown are means from three independent experiments after normalization to the internal control β-actin. *P < 0.05, significantly different from the respective controls; one-way analysis of variance with Tukey's post hoc test. (C and G) Electrophoresis of the PCR products was performed to check PCR specificity. (D) Western blot analysis of APC, phospho-β-catenin and total β-catenin protein levels in CLY and HT-29 cells treated with PBS, CM-1, antagomir-135a, antagomir-135b, or antagomir-200c. (H) Western blot analysis of APC, phospho-β-catenin and total β-catenin protein levels in CLY and HT-29 tumour xenografts from nude mice treated with PBS or CM-1. In panels D and H, β-actin was used as the internal control for normalization and data shown are representative of three independent experiments. (I) Immunohistochemical analysis of APC and β-catenin in CLY and HT-29 tumour xenografts (original magnification, ×220).
Effects of miR-135a&b expression levels on CM-1 cytotoxicity in HEK293 cells
Next, we determined whether the sensitivity to CM-1 was dependent on the miR-135a&b expression levels. We chose the HEK293 cell line, which expresses very low levels of miR-135a&b (Nagel et al., 2008) and stably transfected it with different expression plasmids (pCDNA3-miR-135a1, pCDNA3-miR-135a2, pCDNA3-miR-135b or pCDNA3-miR-200c). Following clonal selection, derivative cell lines with high miR-135a, miR-135b or miR-200c levels were generated and termed HEK293-135a1, HEK293-135a2, HEK293-135b or HEK293-200c respectively. These derivative cell lines, as well as two negative controls (HEK293 cells and HEK293 cells transfected only with pCDNA3), were treated with different concentrations of CM-1 for 96 h and then cell viability was examined by MTT assay. The proliferation assays revealed that the derivative cell lines HEK293-135a1, HEK293-135a2 and HEK293-135b, with high miR-135a or miR-135b levels, were more sensitive to CM-1 treatment than control cells (HEK293 and HEK293-pCDNA3) (Figure 6). However, the cell line with high miR-200c level (HEK293-200c) was comparatively insensitive to CM-1 treatment and displayed IC50 values similar to those seen with HEK293 and HEK293-pCDNA3 cells (Figure 6). Moreover, the IC50 values of HEK293-135a1, HEK293-135a2 and HEK293-135b cells were 2–4 times lower than that of control cells (HEK293, HEK293-pCDNA3 and HEK293-200c cells) (Figure 6C).
Figure 6.
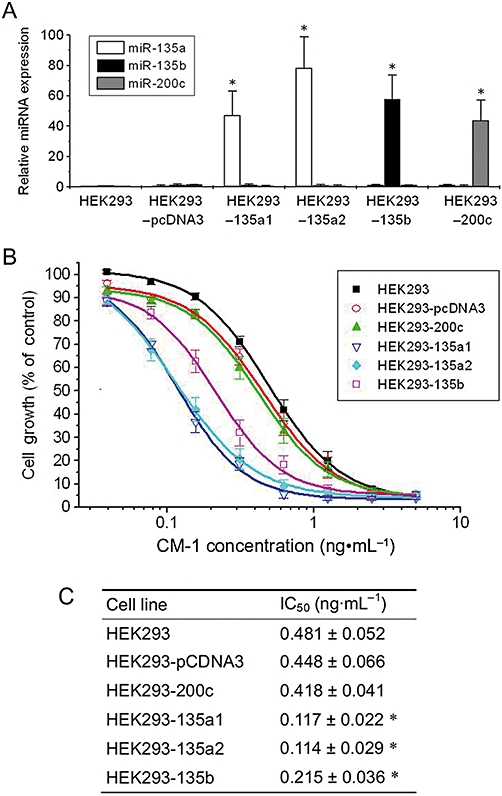
Effects of miR-135a&b expression levels on CM-1 cytotoxicity in HEK293 cells. (A) By stable transfection of expression plasmid DNA (pCDNA3, pCDNA3-miR-135a1, pCDNA3-miR-135a2, pCDNA3-miR-135b or pCDNA3-miR-200c) and clonal selection, HEK293 cell lines with high levels of miR-135a, miR-135b or miR-200c expression were generated and analysed by qRT-PCR analysis. Data shown are means from three independent experiments after normalization to the internal control 5s rRNA. *P < 0.05, significantly different from the respective controls; one-way analysis of variance with Tukey's post hoc test. (B and C) These derivative cell lines, as well as control HEK293 cells, were treated with graded concentrations of CM-1 for 96 h and then cell viability was examined by MTT assay. Experiments performed in triplicate IC50 values were determined by non-linear regression with dose-response curve fitting. *P < 0.05, significantly different from the values for HEK293 cells; one-way analysis of variance with Tukey's post hoc test.
The sensitive cell line HEK293-135a1, compared with control cells (HEK293 and HEK293-pCDNA3), exhibited a marked increase in both miR-135a and pri-miR-135a1 levels (Figure 7C,D). Following CM-1 treatment, the miR-135a levels of HEK293-135a1 cells decreased significantly, while the pri-miR-135a1 levels showed an apparent increase under the same conditions (Figure 7C,D). With the down-regulation of miR-135a, its target gene APC showed a corresponding increase in mRNA and protein levels (Figure 7B,E), which was associated with the increase in phospho-β-catenin protein levels (Figure 7B). No significant changes in β-catenin mRNA levels and total protein levels were observed (Figure 7B,F). Similar changes in miR-135a, APC and β-catenin expression were evident following the positive control antagomir-135a treatment (Figure 7B,C,E,F). However, antagomir-135a treatment induced a reduction in pri-miR-135a1 levels (Figure 7D), which was opposite to the effect of CM-1 treatment. As for the negative control antagomir-NC, no significant changes were observed in miR-135a, pri-miR-135a1, APC and β-catenin expression (Figure 7). Furthermore, all the effects mentioned previously were also evident in the sensitive cell lines HEK293-135a2 (Figure S1) and HEK293-135b (Figure S2). In the insensitive cell line HEK293-200c, miR-200c levels showed no significant changes following the different treatments with the exception of the transfection of antagomir-200c (Figure S3). Similar changes in pri-miR-200c levels were observed under the same conditions (Figure S3). As for APC and β-catenin expression, there were no appreciable differences between the different treatments (Figure S3). In summary, CM-1 treatment decreased miR-135a or miR-135b levels of sensitive cell lines (HEK293-135a1, HEK293-135a2 and HEK293-135b) characterized with high miR-135a or miR-135b levels, increased their APC expression, and improved their β-catenin phosphorylation.
Figure 7.
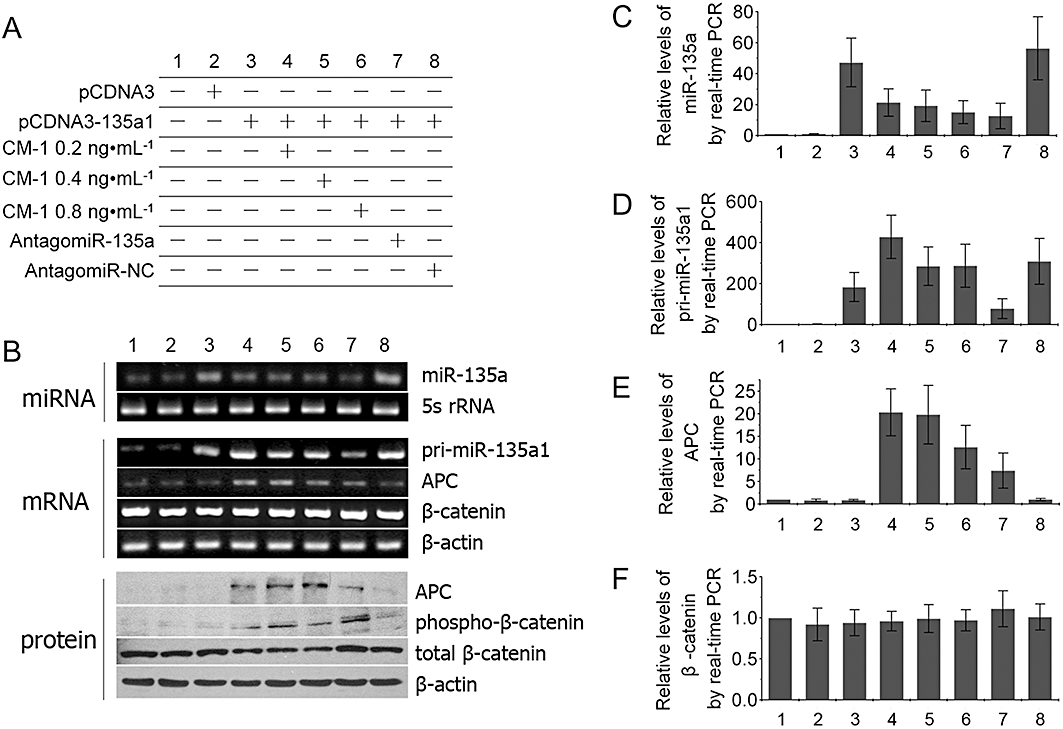
Effects of CM-1 on CM-1 sensitive cell line HEK293-135a1. (A) Cell treatments. miR-135 (C), pri-miR-135a1 (D), APC mRNA (E) and β-catenin mRNA (F) levels were analysed in HEK293-135a1 cells by qRT-PCR analysis. Adenomatous polyposis coli (APC), phospho-β-catenin and total β-catenin protein levels (B) were analysed in HEK293-135a1 cells by Western blot analysis. miRNA, mRNA and protein expression were normalized against 5s rRNA, β-actin mRNA and β-actin protein levels respectively. Each experiment was performed in triplicate.
Discussion
Mistletoe extracts are widely used in complementary cancer therapy. The composition of mistletoe extracts is very complex and some components even show additional or opposing biological effects on tumour cells (Melzer et al., 2009). Hence, the anti-cancer activity of purified ML-I, the main therapeutic components of mistletoe extracts, is of considerable clinical interest. In an earlier study, a mistletoe lectin named CM-1 was isolated from Chinese mistletoe (Kong et al., 2005) and CM-1 showed 91% of identity to EML-I at primary structure level and its key active site residues Tyr76, Tyr115, Glu165, Arg168 and Trp199, essential for the RNA N-glycosidase activity, were not mutated (Kong et al., 2005).
In this study, we evaluated the anti-cancer effect of CM-1 on CRC cells. Both in vitro and in vivo, CM-1 significantly inhibited the growth of CLY and HT-29 cells in a dose-dependent manner. However, some investigators have reported that the anti-proliferative and anti-metastatic effects of ML-I on melanoma xenografts were only achieved at low doses (30 ng·kg−1), but not at higher doses (150 and 500 ng·kg−1) (Thies et al., 2008). Following ML-I administration at 30 ng·kg−1 daily for 19 days, the maximum tumour growth inhibitory rate amounted to 35%, which was attributed to immunomodulatory effects by the investigators (Thies et al., 2008). At present, a pharmacologically oriented view indicates that for immunomodulatory effects of mistletoe therapy, relatively low dose preparations have to be used (Melzer et al., 2009). However, to achieve anti-neoplastic (e.g. pro-apoptotic, cytotoxic) effects, much higher doses may be required (Melzer et al., 2009). In this study, we focused on the anti-neoplastic effects of CM-1 and made efforts to analyse the mechanisms responsible for the prominent cytotoxic effects on CRC cells.
As is well known, ML-I is classified with the type II RIPs that were originally thought to act exclusively on the conserved GAGA hairpin loop of 28S rRNA. In this study, we determined whether some pre-miRNAs could be the substrate for RIPs due to their characteristic stem-loop structures. At first, we identified the down-regulated mature miRNAs induced by CM-1 using miRNA microarray analysis. In fact, the distribution of miRNAs in CRC and normal colonic tissue has been studied by several groups over the last few years and the overexpression of some miRNAs in CRC, including let-7g, miR-21, miR-20a, miR-31, miR-135, miR-181b and miR-200c, has been confirmed (Faber et al., 2009). Except for miR-135, the expression levels of all the other miRNAs mentioned previously showed no significant changes following CM-1 treatment, according to our miRNA microarray profiling. Actually, miR-135a was the most down-regulated one and chosen for further study here. The next qRT-PCR analysis confirmed the significant down-regulation by CM-1 of miR-135a&b both in vitro and in vivo.
To analyse the exact mechanism of the down-regulation of miR-135a&b induced by CM-1, we first used qRT-PCR analysis to determine whether the transcription of their host genes was suppressed. Both in vitro and in vivo, a remarkable increase was observed in pri-miR-135a1, pri-miR-135a2 and pri-miR-135b levels following CM-1 treatment, which might be a negative feedback elicited by the down-regulation of mature miR-135a&b. However, antagomir-135a&b decreased the expression levels of these primary transcripts, which was contrary to the effects of CM-1 treatment and remains to be further explored. As for pri-miR-200c levels, no significant change was observed following the said treatments, with the exception of the transfection of antagomir-200c. So the enhancement of primary miR-135a&b transcript by CM-1 was not a general, but a specific, effect. Overall, down-regulation by CM-1 of miR-135a&b was not induced by suppressing the transcription of their host genes. Next, we investigated the direct degrading effects of CM-1 on some pre-miRNA mimics. After incubation with CM-1 and electrophoresis under denaturing conditions, we observed the disappearance of some substrate pre-miRNA mimics (∼37bp) and the appearance of faster migrating products (∼20bp), which suggested that some cleavage of the pre-miRNA mimics occurred during the reaction and that the cleavage sites might be present in the single-stranded loop region. Thus, the pre-miRNA degradation induced by CM-1 could hinder miRNA processing step and reduce mature miRNA formation. Thus, the down-regulation of specific miRNAs induced by CM-1 was not due to the suppression of their host gene transcription, but rather to the direct degradation of their precursors. However, whether the degradation was initiated by site-specific deadenylation remains to be further investigated through more accurate methods, such as high-performance liquid chromatography fluorescence-based methods (Barbieri et al., 1997). Of note, not all pre-miRNA mimics tested here were degraded by CM-1 treatment. No significant changes were observed in the banding patterns of CM-1 treated pre-miR-200c mimics. For most RIPs, the specific action site is usually present in a conserved GAGA loop (Endo et al., 1987). However, no significant similarities can be concluded now between the GAGA loop and stem-loop structures of pre-miR-135a1, pre-miR-135a2 and pre-miR-135b mimics. So the marked substrate specificity of CM-1 towards different pre-miRNAs may be more complicated than we understand at present and needs further investigation. Actually, it is now generally accepted that all RIPs have multiple enzymic activities in addition to their classical RNA N-glycosidase and these presumed novel enzymic activities, especially those related to diverse nuclease activities, play an important role in various biological activities of RIPs (Douglas et al., 2004). Compared with the total degradation by RNase If of all types of RNA, CM-1 showed relatively weak enzyme activity on specific RNA structures. So, next, we investigated the biological activities induced by CM-1 through the down-regulation of specific miRNAs.
Nagel et al. (2008) have reported that miR-135a&b can target the 3′ untranslated region of APC, suppress its expression, and induce downstream Wnt pathway activity independent of accumulation of APC mutation or promoter methylation status. In this study, CM-1 treatment was associated with a marked increase in APC levels both in vitro and in vivo. In principle, an increased level of APC can enhance the phosphorylation and thereafter degradation of β-catenin. Actually, in vitro, a clear induction of phosphorylated β-catenin was found in the presence of CM-1, although no significant changes in the total amount of β-catenin were observed. Some data have indicated that phosphorylated β-catenin can accumulate in the cells and result in reduced signalling activity (Peumans et al., 2001). Therefore, the phosphorylation might have a regulatory role in β-catenin signalling in addition to its effect on protein stability. This notion is supported by a recent report demonstrating that phosphorylated β-catenin forms a transcriptionally inactive complex with lymphoid enhancer-binding factor-1, although it can accumulate in the nucleus (Sadot et al., 2002). Of note, a marked decrease in the total β-catenin protein levels was observed in tumour tissues treated with 20 µg·kg−1 CM-1, which may partly reflect the induction of ubiquitination-mediated degradation, and depend much more on the inhibition of protein synthesis caused by catalyzing an irreversible damage to ribosomes. Due to the absence of its main effector β-catenin, the downstream activity of the Wnt pathway should be largely repressed. From our data, CM-1 treatment increased APC expression, improved β-catenin phosphorylation and its further degradation, which may ultimately attenuate the downstream Wnt pathway activity but this remains to be confirmed.
To further analyse the role of miR-135a&b expression in the cellular sensitivity towards CM-1, we established several stably transfected cell lines with different miR-135a&b levels and tested the cytotoxicity of CM-1 on these cells. The derivative cell lines with high miR-135a or miR-135b levels were more sensitive to CM-1 treatment, which indicated a direct correlation between miR-135a&b levels and cellular sensitivity towards CM-1. Further studies indicated that. in the sensitive cell lines, such as HEK293-135a1, CM-1 treatment down-regulated the high miR-135a level without inhibiting the expression of its primary transcript, which further substantiated that the down-regulating effect of CM-1 on miR-135a was not induced by suppressing its host gene transcription. Moreover, CM-1 treatment increased APC expression and β-catenin phosphorylation, which validated the inhibitory effect of CM-1 on downstream Wnt pathway activity. All these data substantiated the direct correlation between miR-135a&b levels and cytotoxic sensitivity towards CM-1.
In conclusion, CM-1 showed remarkable anti-neoplastic activity towards CRC cells both in vitro and in vivo, which was partly due to its ability to down-regulate miR-135a&b expression, subsequently up-regulate their target gene APC expression, and eventually attenuate downstream Wnt pathway activity by increasing the phosphorylation of the major effector, β-catenin. Of note, the down-regulation of miR-135a&b induced by CM-1 was not due to the suppression of their host gene transcription, but rather to the direct degradation of their precursors. Furthermore, there was a direct correlation between miR-135a&b levels and cellular sensitivity towards CM-1. Beyond its relevance for cancer research, these results are also of interest for basic cell biology.
Acknowledgments
The authors thank Dr Xiao-fei Zheng (Beijing Institute of Radiation Medicine, Beijing, China) for the kind gift of the plasmids pCDNA3 encoding miR-135a1 and miR-135b. The study was supported by the National Natural Science Foundation of China (NSFC) (No. 30701096 and no. 30801533).
Glossary
Abbreviations
- APC
adenomatous polyposis coli
- CRC
colorectal cancer
- ML-I
mistletoe lectin-I
- pre-miRNA
precursor microRNA
- pri-miRNA
primary microRNA
- RIPs
ribosome inactivating proteins
- RISC
RNA-induced silencing complex
Conflict of interest
None
Supporting Information
Additional Supporting Information may be found in the online version of this article:
Teaching Materials; Figs 1–7 as PowerPoint slide.
Figure S1 Effects of CM-1 on CM-1 sensitive cell line HEK293-135a2. (A) Cell treatments. miR-135 (C), pri-miR-135a2 (D), APC mRNA (E) and β-catenin mRNA (F) levels were analysed in HEK293-135a2 cells by qRT-PCR analysis. APC, phospho-β-catenin and total β-catenin protein levels (B) were analysed in HEK293-135a2 cells by western blot analysis. miRNA, mRNA and protein expression were normalized against 5s rRNA, β-actin mRNA and β-actin protein levels respectively. Each experiment was performed in triplicate.
Figure S2 Effects of CM-1 on CM-1 sensitive cell line HEK293-135b. (A) Cell treatments. miR-135b (C), pri-miR-135b (D), APC mRNA (E) and β-catenin mRNA (F) levels were analysed in HEK293-135b cells by qRT-PCR analysis. APC, phospho-β-catenin and total β-catenin protein levels (B) were analysed in HEK293-135b cells by western blot analysis. miRNA, mRNA and protein expression were normalized against 5s rRNA, β-actin mRNA and β-actin protein levels respectively. Each experiment was performed in triplicate.
Figure S3 Effects of CM-1 on CM-1 insensitive cell line HEK293-200c. (A) Cell treatments. miR-200 (C), pri-miR-200c (D), APC mRNA (E) and β-catenin mRNA (F) levels were analysed in HEK293-200c cells by qRT-PCR analysis. APC, phospho-β-catenin and total β-catenin protein levels (B) were analysed in HEK293-200c cells by western blot analysis. miRNA, mRNA and protein expression were normalized against 5s rRNA, β-actin mRNA and β-actin protein levels respectively. Each experiment was performed in triplicate.
Table S1 Sequences of the primers for the investigated genes by qRT-PCR analysis
Table S2 miRNAs differentially expressed following CM-1 treatment
Please note: Wiley-Blackwell are not responsible for the content or functionality of any supporting materials supplied by the authors. Any queries (other than missing material) should be directed to the corresponding author for the article.
References
- Ambros V. MicroRNA pathways in flies and worms: growth, death, fat, stress, and timing. Cell. 2003;113:673–676. doi: 10.1016/s0092-8674(03)00428-8. [DOI] [PubMed] [Google Scholar]
- Arnold CN, Goel A, Niedzwiecki D, Dowell JM, Wasserman L, Compton C, et al. APC promoter hypermethylation contributes to the loss of APC expression in colorectal cancers with allelic loss on 5q. Cancer Biol Ther. 2004;3:960–964. doi: 10.4161/cbt.3.10.1113. [DOI] [PubMed] [Google Scholar]
- Barbieri L, Battelli MG, Stirpe F. Ribosome-inactivating proteins from plants. Biochim Biophys Acta. 1993;1154:237–282. doi: 10.1016/0304-4157(93)90002-6. [DOI] [PubMed] [Google Scholar]
- Barbieri L, Valbonesi P, Bonora E, Gorini P, Bolognesi A, Stirpe F. Polynucleotide:adenosine glycosidase activity of ribosome-inactivating proteins: effect on DNA, RNA and poly(A) Nucleic Acids Res. 1997;25:518–522. doi: 10.1093/nar/25.3.518. [DOI] [PMC free article] [PubMed] [Google Scholar]
- Behrens J, Lustig B. The Wnt connection to tumorigenesis. Int J Dev Biol. 2004;48:477–487. doi: 10.1387/ijdb.041815jb. [DOI] [PubMed] [Google Scholar]
- Cui J, Fu HJ, Feng JJ, Zhu J, Tie Y, Xing RY, et al. The construction of miRNA expression library for human. Prog Biochem Biophys. 2007;34:389–394. [Google Scholar]
- Douglas EJ, Fiegler H, Rowan A, Halford S, Bicknell DC, Bodmer W, et al. Array comparative genomic hybridization analysis of colorectal cancer cell lines and primary carcinomas. Cancer Res. 2004;64:4817–4825. doi: 10.1158/0008-5472.CAN-04-0328. [DOI] [PubMed] [Google Scholar]
- Endo Y, Tsurugi K. The RNA N-glycosidase activity of ricin A-chain. The characteristics of the enzymatic activity of ricin A-chain with ribosomes and with rRNA. J Biol Chem. 1988;263:8735–8739. [PubMed] [Google Scholar]
- Endo Y, Mitsui K, Motizuki M, Tsurugi K. The mechanism of action of ricin and related toxic lectins on eukaryotic ribosomes. The site and the characteristics of the modification in 28 S ribosomal RNA caused by the toxins. J Biol Chem. 1987;262:5908–5912. [PubMed] [Google Scholar]
- Endo Y, Gluck A, Wool IG. Ribosomal RNA identity elements for ricin A-chain recognition and catalysis. J Mol Biol. 1991;254:848–855. doi: 10.1016/0022-2836(91)80214-f. [DOI] [PubMed] [Google Scholar]
- Esquela-Kerscher A, Slack FJ. Oncomirs – microRNAs with a role in cancer. Nat Rev Cancer. 2006;6:259–269. doi: 10.1038/nrc1840. [DOI] [PubMed] [Google Scholar]
- Faber C, Kirchner T, Hlubek F. The impact of microRNAs on colorectal cancer. Virchows Arch. 2009;454:359–367. doi: 10.1007/s00428-009-0751-9. [DOI] [PubMed] [Google Scholar]
- Fodde R. The APC gene in colorectal cancer. Eur J Cancer. 2002;38:867–871. doi: 10.1016/s0959-8049(02)00040-0. [DOI] [PubMed] [Google Scholar]
- Hajto T, Hostanska K, Gabius HJ. Modulatory potency of the beta-galactoside-specific lectin from mistletoe extract (Iscador) on the host defense system in vivo in rabbits and patients. Cancer Res. 1989;49:4803–4808. [PubMed] [Google Scholar]
- Hudak KA, Wang P, Tumer NE. A novel mechanism for inhibition of translation by pokeweed antiviral protein: depurination of the capped RNA template. RNA. 2000;6:369–380. doi: 10.1017/s1355838200991337. [DOI] [PMC free article] [PubMed] [Google Scholar]
- Khil LY, Kim W, Lyu S, Park WB, Yoon JW, Jun HS. Mechanisms involved in Korean mistletoe lectin-induced apoptosis of cancer cells. World J Gastroenterol. 2007;13:2811–2818. doi: 10.3748/wjg.v13.i20.2811. [DOI] [PMC free article] [PubMed] [Google Scholar]
- Kong JL, Du XB, Fan CX, Zhang JP, Liu SL. Gene cloning and sequencing of a chain of a novel mistletoe protein. J Mol Biol. 2005;2:403–408. [Google Scholar]
- Li SS. Mistletoe lectins: telomerase inhibitors in alternative cancer therapy. Drug Discov Today. 2002;7:896–897. doi: 10.1016/s1359-6446(02)02414-5. [DOI] [PubMed] [Google Scholar]
- Li LN, Zhang HD, Yuan SJ, Tian ZY, Sun ZX. Establishment and characterization of a novel human colorectal cancer cell line (CLY) metastasizing spontaneously to the liver in nude mice. Oncol Rep. 2007;17:835–840. [PubMed] [Google Scholar]
- Lord JM, Roberts LM, Robertus JD. Ricin: structure, mode of action, and some current applications. FASEB J. 1994;8:201–208. [PubMed] [Google Scholar]
- Melzer J, Iten F, Hostanska K, Saller R. Efficacy and safety of mistletoe preparations (Viscum album) for patients with cancer diseases. Forsch Komplementmed. 2009;16:217–226. doi: 10.1159/000226249. [DOI] [PubMed] [Google Scholar]
- Nagel R, le Sage C, Diosdado B, van der Waal M, Oude Vrielink JA, Bolijn A, et al. Regulation of the adenomatous polyposis coli gene by the miR-135 family in colorectal cancer. Cancer Res. 2008;68:5795–5802. doi: 10.1158/0008-5472.CAN-08-0951. [DOI] [PubMed] [Google Scholar]
- Nicolas E, Beggs JM, Taraschi TF. Gelonin is an unusual DNA glycosylase that removes adenine from single-stranded DNA, normal base pairs and mismatches. J Biol Chem. 2000;275:31399–31406. doi: 10.1074/jbc.M004505200. [DOI] [PubMed] [Google Scholar]
- Parkin DM, Bray F, Ferlay J, Pisani P. Global cancer statistics, 2002. CA Cancer J Clin. 2005;55:74–108. doi: 10.3322/canjclin.55.2.74. [DOI] [PubMed] [Google Scholar]
- Paul S, Dey A. Wnt signaling and cancer development: therapeutic implication. Neoplasma. 2008;55:165–176. [PubMed] [Google Scholar]
- Peumans WJ, Hao Q, Van Damme EJ. Ribosome-inactivating proteins from plants: more than RNA N-glycosidases? FASEB J. 2001;15:1493–1506. doi: 10.1096/fj.00-0751rev. [DOI] [PubMed] [Google Scholar]
- Phelps RA, Broadbent TJ, Stafforini DM, Jones DA. New perspectives on APC control of cell fate and proliferation in colorectal cancer. Cell Cycle. 2009;8:2549–2556. doi: 10.4161/cc.8.16.9278. [DOI] [PubMed] [Google Scholar]
- Rubinfeld B, Albert I, Porfiri E, Munemitsu S, Polakis P. Loss of beta-catenin regulation by the APC tumor suppressor protein correlates with loss of structure due to common somatic mutations of the gene. Cancer Res. 1997;57:4624–4630. [PubMed] [Google Scholar]
- Sadot E, Conacci-Sorrell M, Zhurinsky J, Shnizer D, Lando Z, Zharhary D, et al. Regulation of S33/S37 phosphorylated beta-catenin in normal and transformed cells. J Cell Sci. 2002;115:2771–2780. doi: 10.1242/jcs.115.13.2771. [DOI] [PubMed] [Google Scholar]
- Thies A, Dautel P, Meyer A, Pfüller U, Schumacher U. Low-dose mistletoe lectin-I reduces melanoma growth and spread in a scid mouse xenograft model. Br J Cancer. 2008;98:106–112. doi: 10.1038/sj.bjc.6604106. [DOI] [PMC free article] [PubMed] [Google Scholar]
- Valentiner U, Pfüller U, Baum C, Schumacher U. The cytotoxic effect of mistletoe lectins I, II and III on sensitive and multidrug resistant human colon cancer cell lines in vitro. Toxicology. 2002;171:187–199. doi: 10.1016/s0300-483x(01)00581-9. [DOI] [PubMed] [Google Scholar]
- Yang YH, Dudoit S, Luu P, Lin DM, Peng V, Ngai J, et al. Normalization for cDNA microarray data: a robust composite method addressing single and multiple slide systematic variation. Nucleic Acids Res. 2002;30:e15. doi: 10.1093/nar/30.4.e15. [DOI] [PMC free article] [PubMed] [Google Scholar]
- Zhao Y, Srivastava D. A developmental view of microRNA function. Trends Biochem Sci. 2007;32:189–197. doi: 10.1016/j.tibs.2007.02.006. [DOI] [PubMed] [Google Scholar]
Associated Data
This section collects any data citations, data availability statements, or supplementary materials included in this article.