

Abstract
Several lines of schizophrenia (SZ) research suggest that a functional downregulation of the prefrontal cortex GABAergic neuronal system is mediated by a promoter hypermethylation, presumably catalyzed by an increase in DNA-methyltransferase-1 (DNMT-1) expression.
This promoter hypermethylation may be mediated not only by DNMT-1 but also by an entire family of de novo DNA-methyltransferases, such as DNA-methyltransferase-3a (DNMT-3a) and -3b (DNMT-3b).
To verify the existence of an overexpression of DNMT-3a and DNMT-3b in the brain of schizophrenia patients (SZP), we compared their mRNA expression in Brodmann’s area 10 (BA10) and in the caudate nucleus and putamen obtained from the Harvard Brain Tissue Resource Center (Belmont, MA) from both nonpsychiatric subjects (NPS) and SZP.
Our results demonstrate that DNMT-3a and DNMT-1 are expressed and co-localize in distinct GABAergic neuron populations whereas DNMT-3b mRNA is virtually undetectable. We also found that unlike DNMT-1, which is frequently overexpressed in telencephalic GABAergic neurons of SZP, DNMT-3a mRNA is overexpressed only in layers I and II GABAergic interneurons of BA10.
To ascertain whether these DNMT expression differences observed in brain tissue could also be detected in peripheral tissues, we studied whether DNMT-1 and DNMT-3a mRNAs were overexpressed in peripheral blood lymphocytes (PBL) of SZP. Both DNMT-1 and DNMT-3a mRNAs are expressed in the PBL and although DNMT-3a mRNA levels in the PBL are approximately 1/10 of those of DNMT-1, the comparison of the PBL content in NPS and SZP showed a highly significant 2-fold increase of both DNMT-1 and DNMT-3a mRNA in SZP. These changes were unaffected by the dose, the duration, or the type of antipsychotic treatment.
The upregulation of DNMT-1 and to a lesser extent that of DNMT-3a mRNA in and PBL of SZP supports the concept that this readily available peripheral cell type can express an epigenetic variation of specific biomarkers relevant to SZ morbidity. Hence, PBL studies may become useful to investigate a diagnostic epigenetic marker of SZ morbidity.
1. INTRODUCTION
A leading hypothesis supported by current schizophrenia (SZ) reports from laboratories throughout the world is that a downregulation of telencephalic GABAergic transmission is one of the key diagnostic signs of SZ morbidity (Benes et al., 2001, Guidotti et al., 2005, Lewis et al., 2005, Costa et al 2009). Consistent with this finding, we and others have shown that the expression of glutamic acid decarboxylase (GAD67), reelin (Akbarian et al., 1995, Impagnatiello et al., 1999, Guidotti et al., 2000, Glanz and Lewis, 2000, Fatemi et al., 2000, Veldic et al., 2007, Lieberman et al., 2008), N-methyl-D-aspartate 2A receptors (NRA2) (Woo et al., 2008), TrkB and GABA-transporter-1 (GAT-1) (Hashimoto et al., 2005), nicotinic-acetylcholine receptors (nAChRs) (Breese et al., 2000), somatostatin (Morris et al., 2008), and other genes (Mill et al., 2008) are downregulated in distinct GABAergic neuronal populations located in specific cortical layers or proximal to pyramidal hippocampal neurons or in the basal ganglia of SZ patients (SZP) (Veldic et al., 2007).
In cortical and basal ganglia GABAergic neurons of SZP, the decrease of GAD67 and reelin expression is associated with the increased expression of DNA-methyltrasferase-1 (DNMT1) (Veldic et al., 2004, 2005, 2007, Ruzicka et al., 2007).: Since this enzyme catalyzes the transfer of a methyl group from S–adenosyl methionine (SAM) to cytosine embedded in CpG-rich promoters (Van Emburg and Robertson, 2008), hypermethylation of GABAergic gene promoters in SZP (Grayson et al., 2006, Abdolmaleky et al., 2005, Costa et al., 2007, Mill et al., 2008), induced by DNMT1 slows their transcriptional initiation and may even result in individual gene silencing (Van Emburg and Robertson, 2008, Grayson et al 2006.)
This inference may be related to clinical observations dating to the late 1960s demonstrating that daily administration of high doses of methionine could increase the brain content of the methyl donor SAM (Tremolizzo et al., 2002,Guidotti et al., 2007, Costa et al., 2007) and thereby exacerbate or even trigger a psychotic episode in 40–50% of the SZP population but not in nonpsychiatric subjects (NPS) (Wyatt et al., 1971).
DNMT1 is considered a maintenance DNA-methyltransferase acting at replication foci in dividing cells (Van Emburg and Robertson, 2008). However, in adult mammalian brain a non-maintenance role for DNMT1 is supported by studies showing that high levels of this enzyme are expressed in terminally differentiated GABAergic interneurons (Ruzicka et al., 2007, Costa et al., 2007). The inhibitory action of DNMT-1 on gene expression is not limited to the catalysis of promoter methylation but also may occur through an interaction with some chromatin proteins (i.e., histone deacetylases, HDACs), which repress transcription via a modification of chromatin structure (Van Emburg and Robertson, 2008). Interestingly, HDAC1 expression associated with a downregulation of GAD67 was found to be increased in the prefrontal cortex of SZP (Benes et al., 2007, Sharma et al., 2008).
Recently, it has been reported that promoter hypermethylation in the mammalian brain may be catalyzed not only by DNMT1 but also by a family of brain DNA-methyltransferase enzymes, including the de-novo DNA-methyltransferases-3a and 3b (DNMT 3a and 3b) (Miller and Sweatt, 2007, Poulter et al., 2008). The present study intends to clarify whether 1) in addition to DNMT1, human post mortem brain also express DNMT3a and DNMT3b, 2) DNMT1 and DNMT3a or DNMT3b are expressed in the same GABAergic neurons, 3) DNMT3a, like DNMT1, is overexpressed in the PFC and basal ganglia of SZP.
Furthermore, to establish whether the DNMT upregulation detected in the brain can also be observed in peripheral tissues, we measured DNMT1 and DNMT3a mRNAs in peripheral blood lymphocytes (PBL) of SZP. Consistent with the epigenetic GABAergic dysfunction hypothesis of SZ morbidity, we found that in cortical Brodmann’s area 10 (BA10) and PBL of SZP, DNMT1 and to a lesser extent DNMT3a mRNAs are upregulated. This suggests the possibility that SZ morbidity diagnosis may be facilitated by a study of DNMTs expressed in PBL.
2. Experimental Materials and Methods
2.1. Brain sample collection
Brain samples dissected from Brodmann’s area 10 (BA10), caudate nucleus (CN) and putamen (PT) of NPS or SZP were obtained from the Harvard Brain Tissue Resource Center, McLean Hospital, Belmont, MA. All specimens were either fixed in 4% formaldehyde or fresh frozen.). Demographic characteristics of brain samples from cohort A and B are reported in table 1. RNA quality was established by the Harvard Brain Tissue Resource Center (http://www.brainbank.mclean.org/) (for further information on the samples see also Veldic et al., 2004, 2005, 2007
Table 1.
Demographic characteristics of brain samples obtained from the Harvard Brain Tissue Resource Center, McLean Hospital, Belmont, MA. (wwwhttp://www.brainbank.mclean.org/)
| COHORT A | COHORT B | |||
|---|---|---|---|---|
| NPS (n=8) | SZP* (n=7) | NPS (n=27) | SZP* (n=20) | |
| Female/male | 4/4 | 3/4 | 8/19 | 7/13 |
| Age/years | 61±12 | 57±11 | 58±18 | 56±18 |
| PMI/hrs | 18±6.6 | 20±5.5 | 21±5.8 | 21±5.5 |
| Age of illness onset/years | - | 24±5.5 | - | 23±9.9 |
| % Suicide | 0 | 14 | 0 | 16 |
|
% CNS medications Atypical antipsychotics |
0 | 57 | 0 | 32 |
| Typical antipsychotics | 0 | 29 | 0 | 37 |
| Typical and atypical antipsychotics | 0 | 0 | 0 | 5 |
| Valproate | 0 | 14 | 0 | 16 |
Cohort A: formaldehyde fixed BA10. Cohort B: formaldehyde fixed caudate nucleus (CN) and putamen (PT).
The values are mean ± SD; NPS=nonpsychiatric subjects; SZP=schizophrenia patients; PMI=postmortem interval.
The psychiatric diagnosis was established by two senior psychiatrists based on clinical and family histories and according to Feighner et al (1972). For RNA qualities data are reported in details in www.http://www.brainbank.mclean.org/ and Veldic et al 2007.
2.2. Lymphocyte collection
Anticoagulant-treated diluted blood (15 ml blood plus 10 ml PBS) was layered on the Ficoll-Paque PLUS solution and peripheral blood lymphocytes (PBL) were isolated with the Ficoll-Paque Plus method using AMERSHAM Kit (Biosciences 2001–2006) following manufacturer’s specifications.
DNMT1 immunocytochemistry was carried out by incubating lymphocyte smears with DNMT1 antibodies for 12 hrs (New England, Biolabs, diluted 1:500). This procedure was followed by an incubation with biotinylated goat anti-mouse antiserum (Vector Laboratories, 1:250) for 1 hr and reacted with the avidin-biotin-peroxidase complex (Vector Laboratories) followed by 3–3′diaminobenzidine tetrahydrochloride (Sigma) for 2–3 minutes. To test the specificity of this immunological detection, when the DNMT1 antibody was omitted, no staining was observed.
Lymphocyte samples were obtained from patients with a DSM-IV diagnosis of SZ or from NPS collected from two US sites: a tertiary care psychiatric inpatient and an outpatient service affiliated with NYU Medical School (Cohort D, Table 2); and in a Spanish site, a psychiatric service affiliated with the Medical School of Santiago de Compostela (Cohort C, Table 2). NPS samples did not have a schizophrenia, bipolar disorder, major depressive disorder, or related psychosis diagnosis. All subjects gave written informed consent for protocols and completed a consent form approved by their governing IRBs (Nathan Kline Institute-USA, and University of Santiago De Compostela-Spain).
Table 2.
Demographic Characteristics of Lymphocyte Samples From Cohort C and D
| SPAIN | NY | |||
|---|---|---|---|---|
| COHORT C | COHORT D | |||
| Characteristic | NPS (n=9) | SZP (n=7) | NPS (n=24) | SZP (n=22) |
| Male/Female | 4/5 | 5/2 | 8/16 | 20/2 |
| Age/Years (Mean±SD) | 30 ± 7 | 38 ± 10 | 36 ± 11 | 41 ± 8 |
| Antipsychotics TYPICAL |
- | - | ||
| Haloperidol | - | - | - | 5 |
| Phenothiazines | - | 5 | - | 2 |
| ATYPICAL | ||||
| Clozapine | - | - | 6 | |
| Olanzapine | - | 3 | - | 7 |
| Risperidone | - | 5 | - | 13 |
| Quetiapine | - | - | 8 | |
Cohorts-- Cohort C: University of Santiago De Compostela – SPAIN, Cohort D:, Manhattan Psychiatric Center & Nathan Kline Institute NYU Medical School-US; SZP =Schizophrenic patients, NPS=Non-psychiatric subjects (Controls). Some patients were treated with more than one of the antipsychotics listed.
2.3. RNA extraction
RNA was extracted from tissue blocks and PBL using TRIZOL® reagent (Invitrogen [Carlsbad, Ca]) according the manufacturer’s specifications.
2.4. Reverse transcription-polymerase chain reaction (RT-PCR)
Reactions were carried out using the following conditions and primers designed to anneal to the following sites:
DNMT1: forward 2421–2444, reverse 2907–2930, forward nested 2446–2469, and reverse nested 2906–2883. DNMT1 first PCR cycle conditions were 94°C for five minutes followed by 30 cycles of 94°C for 30 seconds, 65°C for 30 seconds, and 72°C for 30 seconds, followed by 72°C for seven minutes. At the end of the first PCR, the reaction products were diluted 300-fold for use in 25 cycles of the nested-PCR described above.
DNMT3A: forward 812–835, reverse 1326–1349, forward nested 818–841, and reverse nested 1316–1339. DNMT3A PCR cycling conditions were the same as for DNMT1.
DNMT3B - forward 640–663, reverse 1186–1209. PCR cycling conditions were the same as for DNMT1, but with the annealing temperature (60°C.
DNMT1, DNMT3a and DNMT3b primers are designed to detect the conserved mRNA structures and their splice variants.
Neuronal specific enolase (NSE): forward 1326–1349, forward nested 818–841, and reverse nested 1316–1339. For neuronal specific enolase (NSE) mRNA measurements we used the following primers: forward 382–405, reverse 769–792. NSE PCR cycling conditions were the same as for DNMT1.
Glyceraldehyde 3 phosphate dehydrogenase (G3PDH) forward 231–254, reverse 891–914, G3PDH PCR cycling conditions were the same as for DNMT1.
For competitive RT-PCR experiments, the internal standards (IS) were generated introducing a deletion at the center of each IS (Ruzicka et al., 2007). To generate the IS, the following internal primers were used: DNMT1 5′-CGGGCAGATGTTTCACGAGGCATGGATCCCGAGT-3; DNMT3a 5′-TCGACTCCAGATGTTGCTGTCTCTCTTTGA3′; NSE 5′AATGGTGGCTCTCATCTACACTCAAG-3′; G3PDH 5-GTATGACAACAGCCTCAACATCCCTGCCTCTAC-3′. The mRNAs studied have the following GenBank accession numbers: DNMT1- XM_049501, DNMT3A – NM_007872, DNMT3B – NM_001003961. NSE – M22349, G3PDH – BC029340.
2.5. In situ hybridization and three-dimensional counts
Free-floating 40-μm brain sections were incubated for 48 hrs with a mixture of 50 pmol/ml of antisense oligonucleotides (Veldic et al., 2004) using probes complementary to bases a) 1627–1650 and 4801–4824 of the human DNMT1 cDNA (GenBank accession no. NM001379); b) 1637–1660 and 1833–1856 of the human DNMT3a cDNA (GenBank accession no. NM175629). These nucleotides failed to match any other known mRNA sequence and were selected according to the previously reported criteria (Veldic et al., 2007).
After completion of the hybridization reactions, tissue sections were incubated for 72 hr at 4°C in 0.1 M PBS containing 1% normal goat serum and 0.1 μg/ml of a monoclonal antibody against digoxigenin (mouse antidigoxigenin monoclonal antiserum was purchased from Roche Diagnostics). This procedure was followed by incubation with biotinylated goat anti-mouse antiserum (Vector, Burlingame, CA, 1:250) for 1 hr and reacted with the avidin-biotin-peroxidase complex (Vector Laboratories) followed by a reaction with 3–3′-diaminobenzidine tetrahydrochloride (DAB; Sigma) with 0.1% nickel ammonium sulfate lasting 2 to 3 min to obtain a gray-black shade in the precipitate as described by Veldic et al., 2004, 2005.
Three-dimensional cell counts were performed as described by Veldic et al. (2004). The reproducibility and reliability of our in situ histochemical procedures were established as reported by Veldic et al. (2005). To count strongly stained cells and exclude weakly stained cells or non-specifically-labeled cells from the analysis, the threshold intensity of staining was established at 3X the background (measured by Leica Confocal Software).
2.6. Double in situ hybridization- immunohistochemistry and confocal fluorescence microscopy
Using 16-μm sections, after the completion of DNMT1 or DNMT3a mRNA in situ hybridization, these sections were processed for immunohistochemistry using either antibodies directed against GAD65/67 (Chemicon, Temecula, CA, 1:2000) or DNMT1 (New England Biolabs, 1:500) (Veldic et al., 2004, 2007).
Cy-5-conjugated goat anti-rabbit IgG (Amersham Biosciences, Piscataway, NJ, 1:1000) was used to label the antibodies that reacted with DNMT1 or GAD65/67. Cy2-conjugated streptavidin (1:1000) was used to label DNMT1 or DNMT3a mRNA. After washing, the sections were incubated in 0.1mM CuSO4 and 50mM CH3COONH4 for 30 min to reduce the interference by lipofuscin-mediated autofluorescence before conducting the confocal fluorescence microscopy studies (Veldic et al., 2004).
2.7. Statistical analyses
A) Postmortem brain samples
Differences between the SZP and NPS groups in postmortem interval (PMI), age, gender, brain pH, and RNA quality were evaluated with one way ANOVA or χ2 analyses. To test whether these variables affect differences between SZP and NPS on DNMT3a mRNA in various cortical layers, we used analyses of covariance (ANCOVA). The differences between SZP and NPS in the number of DNMT3a mRNA positive neurons in layers of coronal sections from areas BA10 were statistically evaluated by repeated measures of ANOVA for the six layers, followed by t- tests of each layer. The differences between SZP and NPS by ANCOVA were comparable with those of the unpaired t- test.
B) PBL
Statistical analysis of DNMT1 mRNA expression in PBL was computed with SPSS12 GLM ANOVA with collection site (Spain vs. US) and diagnosis (SZ vs. controls) as the main factors. Additional subsidiary analysis incorporated sex and smoking habits as additional factors and age as a covariate. Differences between specific groups in the overall ANOVA were compared by 2-sample t-test without corrections for multiple testing.
3. Results
3.1. DNMT1 and DNMT3a are highly expressed in BA 10 of NPS
In BA10 of NPS we measured DNMT1, DNMT3a, and DNMT3b mRNA levels using RT-PCR with appropriate primers and internal standards (see method section)
As shown in FIG 1, DNMT 1 and 3a mRNAs are expressed at about the same level in BA 10 extracts. In the same extracts, we also used primers designed to detect the conserved DNMT3b structure and its splice variants by RT-PCR (see method section). In our cortical brain extracts, DNMT 3b and its splice variants are virtually undetectable.
FIG 1. DNMT1 but not DNMT 3a mRNA is upregulated in BA 10 of SZP.

Both DNMT1 and DNMT3a mRNA measurements were carried out by competitive RT-PCR (see methods) in a group of fresh/frozen BA 10 samples obtained from the Harvard Brain Tissue Resource Center, McLean Hospital, Belmont, MA. (http://www.brainbank.mclean.org/) and with the following demographic characteristics: NPS (n=7), age 67±6.3, gender 4M/3F, PMI (postmortem interval) 24±1.3, brain pH=6.4±1.0, 3′ 5′-G3PDH ratio 1.7±0.2, 3′ 5′ β-actin ratio 2.9 ± 0.5, 28 s/18s RNA ratio 0.84±0.02, % probe sets present 46±1.7.
SZP (n=6), age 53±7.3, gender 4M/2F, PMI (postmortem interval) 22±1.7, brain pH=6.4±0.1, 3′ 5′ G3PDH ratio 1.4±0.1, 3′ 5′ β-actin ratio 2.4 ± 0.2, 28 s/18s RNA ratio 0.9±0.01, % probe sets present 48±0.7, duration of illness 22±3.2 years. All SZP were treated with neuroleptics.
DNMT1 mRNA levels were significantly higher in SZP compared to NPS (t=3.3, df=11, p=0.007). Also DNMT 3a was higher in SZP compared to NPS, but was a non-significant trend (t=1.8, df=11, p=0.11). The following background variables: age, gender, PMI, brain pH, G3PDH ratio, 3′ 5′ β-actin ratio, 28 s/18s RNA ratio and other factors were entered in analysis of covariance as confounds of DNMT1 and DNMT3a but failed to significantly alter the effect of diagnosis and so were not entered in the final model.
Each bar represents the mean ± SE.
In situ hybridization histochemistry studies show that in BA10, the number of heavily stained DNMT3a mRNA positive neurons is the highest in layers I–II and is the lowest in layers V and VI (Fig 2). This distribution is virtually identical to that of neurons expressing DNMT1 mRNA (see Fig 6 in Veldic et al., 2004).
FIG. 2. Density of DNMT3a mRNA positive neurons in different cortical layers of BA 10, caudate nucleus (CN), and putamen (PT) from NPS and SZP.
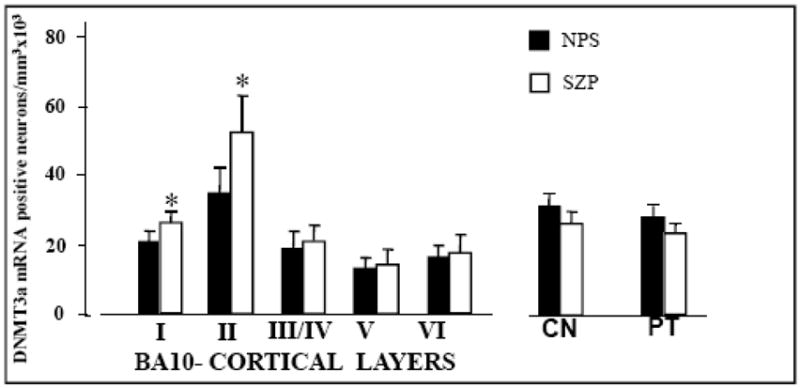
For the different cortical layers of BA10: each bar represents the mean ± SE of 8 NPS (filled bars) or 7 SZP (checkered bars) obtained from cohort A (see table 1). In the cortical layers the difference between SZP and NPS was calculated by repeated measure ANOVA followed by t-tests. Asterisks (*) indicate statistically significant differences in SZP compared to NPS: LI (P=0.05), LII (P=0.01), LIII/IV (P=NS), LV (P=NS), LVI (P=NS).
For the CN and PT: each bar represents the mean ± SE of 27 NPS and 20 SZP from cohort B (see table 1). There are not statistically significant differences between SZP and NPS. For further details on demographic characteristics of cohort B, see Veldic at al, 2007.
DNMT1 mRNA data in the same BA10 samples and in the CN and PT are reported in Fig 6 of Veldic et al., 2004 and on Fig 2 of Veldic et al., 2007, respectively.
3.2. Colocalization of DNMT1 and DNMT3a mRNA with GAD65/67immunoreactivity in BA 10
By combining in situ hybridization and immunochemistry, we studied the extent of colocalization of DNMT3a and DNMT1 mRNA with GAD65/67 in BA10 neurons. Fig. 3 A shows that DNMT3a mRNA and GAD65/67 proteins are colocalized in GABAergic neurons. Fig. 3B shows that DNMT3a mRNA and DNMT1 protein are also colocalized.
Fig 3.
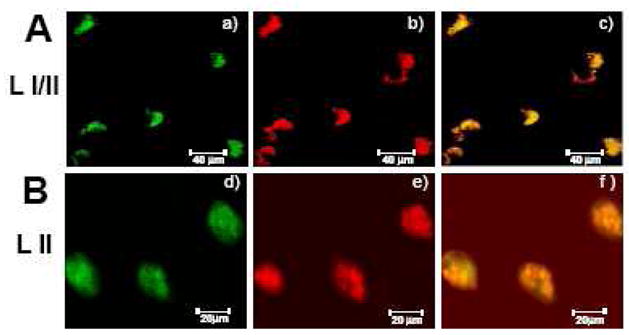
A. Colocalization of DNMT3a mRNA and GAD65/67 immunoreactivity in BA10 (layers I/II) of NPS
a) DNMT3a mRNA positive neurons color coded in green
b) GAD65/67 mRNA positive neurons color coded in red
c) Merge in yellow
B. Colocalization of DNMT3a mRNA and DNMT1 immunoreactivity in BA10 (layer II) of NPS
d) DNMT3a mRNA positive neurons color coded in green
e) DNMT1 protein positive neurons color coded in red
f) Merge in yellow
3.3. DNMT1 and DNMT3a mRNAs are upregulated differentially in telencephalic regions of SZP
In BA 10 of 7 NPS and 6 SZP matched for age, gender, PMI, RNA quality, and brain pH (see Fig 1 legend for demographic details), we compared the levels of DNMT1 and DNMT3a mRNA by quantitative RT-PCR. The levels of DNMT1 mRNA were increased by approximately 2-fold in SZP (Fig 1). In contrast, in the same extracts the DNMT3a mRNA levels were increased by only 35% and this difference did not reach the statistical significance. However, by using in situ hybridization, we found that there is an upregulation of DNMT3a mRNA positive neurons in layers I and II of BA 10 of SZP (Fig 2). This upregulation is similar to that measured for DNMT1 mRNA (see Fig 6 in Veldic et al., 2004). In contrast, in layers III–IV and in the CN and PT (Fig 2) of SZP, where we previously reported an upregulation of DNMT1 expression (see Fig 6 in Veldic et al., 2004 and Fig 2 in Veldic et al., 2007), we found no evidence for overexpression of DNMT3a mRNA positive neurons.
As shown in the legend of Fig 1 and in Table 1, variables such as PMI, age, gender, brain pH, and RNA qualities were not significantly different when NPS and SZP groups were compared according to Student’s t-tests. None one of these variables had any effect on DNMT1 and DNMT3a mRNA expression. In addition, when all these variables were included as covariates, ANCOVA indicated results similar to those of Student’s t tests.
Furthermore, the cumulative lifetime dose of antipsychotics or the type of antipsychotic was not correlated with the changes in the expression of DNMT1 or DNMT3a. The only variable that was consistently and significantly associated with DNMT1 but not with DNMT3a was the diagnosis of SZ.
3.4. DNMT1 and DNMT3a mRNA expression in the PBL of SZP reflects the upregulation of DNMT1and DNMT3a mRNA in PFC GABAergic neurons
In preliminary imunocytochemical experiments, we showed that lymphocytes express nuclear DNMT1-like protein immunoreactivity. To explore whether there are quantitative differences in the expression of DNMTs between NPS and SZP, we measured DNMT1 and DNMT3a mRNA levels by RT-PCR in PBL obtained from SZP and NPS (for demographic data see Table 2).
Fig 4 shows that the SZP from two different cohorts (Spain and USA), evidence an approximately 2-fold increase in DNMT1 mRNA compared to NPS (overall ANOVA, diagnosis-SZ vs NPS-F=19.073, df= 1, 58, P=0.001)..
FIG 4. DNMT1 mRNA is overexpressed in the PBL of SZ patients.
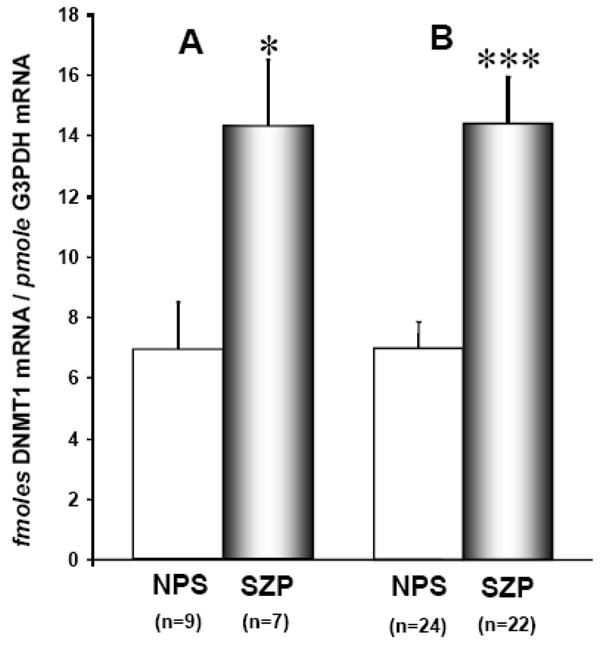
DNMT1 mRNA levels were measured by quantitative RT-PCR (see methods).
A) Spanish Site: University of Santiago de Compostela (Spain), Cohort C, table 2
B) US Site: Manhattan Psychiatric Center (affiliated with NYU Medical School, NY, USA). Cohort D, table 2
The differences in DNMT1 mRNA expression in NPS and SZP were evaluated by 2-sample t-test (***P=0.001; *P = <0.02).
Each bar represents the mean ± SE.
Further ANOVA analyses included age, sex, ethnicity, and type of antipsychotic as independent factors or covariates. The differences in DMNT1 mRNA were not influenced by these factors (none of the main effects and interactions were statistically significant). There was also no overall difference in DNMT1 mRNA between SZP tobacco smokers and nonsmokers. However, in the group of SZP in US sample, there was a trend for the few patients who had a heavier current cigarette smoking habit (>15cigarettes/day) to have lower DNMT1 mRNA compared to non-smoking SZP. PBL also express DNMT3a mRNA and these levels are also increased in SZP (i.e., in 6 PBL samples from NPS and 8 samples from SZP, the levels of DNMT 3a mRNA increased from 0.5±0.1 fmoles/pmol G3PDH mRNA in NPS to 1.1 ± 0.18 fmoles/pmol G3PDH mRNA in SZP, P<.02).
4. DISCUSSION
In the present study, we measured the expression of DNMT1, DNMT 3a, and DNMT3b mRNA in BA10, CN, and PT of adult human brains. While DNMT1 and DNMT3a mRNAs are expressed in measurable amounts and the levels are comparable, DNMT3b mRNA is consistently nondetectable.
In situ hybridization and immunohistochemical studies show that DNMT3a mRNA colocalizes with DNMT1 and both are selectively expressed in GABAergic neurons (Fig 3) and in fact, are virtually absent either in pyramidal neurons or in glial cells (Veldic et al., 2004, 2005, Ruzicka et al., 2007).
Measurements of DNMT1 and DNMT3a mRNA levels in BA10 indicate that DNMT1 is increased by approximately 2-fold in SZ patients compared to NPS, whereas DNMT3a mRNA is increased by only 35% (see FIG 1). In previous in situ hybridization and laser microdissection studies (Veldic et al., 2004, 2005, 2007; Ruzicka et al., 2007), we have shown that the levels of DNMT1 mRNA are increased in GABAergic neurons of cortical (BA10) layers I, II, and III–IV and in the GABAergic neurons of the CN and PT of SZP, whereas here we show that an increased expression of DNMT3a is restricted to cortical layer I and II GABAergic interneurons (Fig 2).
This allows speculation that the increased expression of DNMT1 in SZ is generalized to the majority of telencephalic GABAergic neurons whereas the increased expression of DNMT3a may be restricted to distinct GABAergic interneuron populations, for example, layer I and II horizontal and bitufted cells.
To interpret the role of DNMT1 or DNMT3a mRNA increases in the brain of SZP, one limitation of our study is that we failed to measure the expression of DNMT1 and DNMT3a proteins or their intrinsic enzymatic activities. However, in a previous study we reported that the increase of DNMT1 mRNA in PFC GABAergic neurons of SZP parallels an increase in DNMT1 protein (Veldic et al., 2005). Furthermore in another study (Satta et al., 2008), we reported that the decrease (~50%) of cortical DNMT1 mRNA and protein induced in mice following protracted nicotine administration (0.75 to 2.5 mg/kg, four times a day for four days) is associated with a comparable decrease of DNMT1 protein, a 40–50% decrease of GAD67 promoter methylation, and an overexpression of GAD67 protein in GABAergic interneurons.
In another study (Miller and Sweat, 2007), it was shown that DNMT3a mRNA levels increase (in the absence of a significant DNMT1 or DNMT3b mRNA changes) and promoter methylation of reelin or of the memory suppressor gene PPI was increased in the frontal cortex of mice subjected to contextual fear conditioning. Administration of the synthetic DNMT nucleoside antagonists zebularin or 5-azacytidine to mice before their exposure to fear conditioning inhibited DNMT activity and prevented reelin and PPI promoter hypermethylation.
The increase of DNMT1 and DNMT3a mRNA in brains of SZP is probably specific to this illness because in the brain of suicidal/depressed patients, an increase of DNMT3b but not DNMT1 or DNMT3a mRNA has been implicated in the hypermethylation of the GABAA receptor α1 promoter region (Poulter et al., 2008). It is likely that the overexpression of DNMT1 and DNMT3a mRNA observed in brain of SZP cannot be attributed to demographic factors (gender, onset of illness, or duration of illness) or to the type, dose, or duration of antipsychotic administration. In fact, mice receiving haloperidol (1mg/kg) or clozapine (5mg/kg) for 21 days failed to show a change of cortical DNMT1 mRNA content (Satta RA, this is laboratory, personal communication).
Taken together, these findings support the hypothesis that a SZ-related overexpression of DNMT1 and DNMT3a mRNA in cortical GABAergic neurons may induce 1) an increased expression of DNMT1 and DNMT3a proteins, and 2) the hypermethylation of GABAergic neuron specific promoters. This GABAergic promoter hypermethylation may represent a crucial pathogenetic factor of SZ morbidity, possibly relevant to the expression of psychotic symptoms.
Studies conducted in postmortem human brain have contributed to the identification of epigenetic markers operative in SZ. A major disadvantage of these studies is due to difficulties in: a) correlating changes in gene expression profiles with the respective changes in clinical symptoms and b) identifying appropriate targets in an objective accessible diagnostic assay of psychiatric disorders.
Development of an objective diagnostic assay to aid in the clinical diagnosis of SZ requires the identification of brain biomarkers for SZ in easily obtained cell samples such as PBL. Furthermore, we can hypothesize that easily accessible peripheral cells such as PBL from normal subjects or SZP could be an important cell model in a clinical setting to study: a) the molecular processes associated with the increase of DNMT1 or DNMT3a in psychosis, b) the epigenetic biomarkers characteristic of the disease, and c) more importantly, the prognostic value that selective markers may have as predictors of treatment response.
We have tested the validity of this suggestion measuring the expression of DNMT1 and DNMT3a mRNAs in PBL obtained from NPS and SZP. Here, we report the first demonstration that measurements of DNMT1 and DNMT3a mRNA expression in PBL may be an interesting diagnostic parameter to be considered in consolidating an objective diagnosis of SZ vulnerability. We demonstrate that: 1) PBL express both DNMT1 and DNMT3a but unlike the brain in which the content of DNMT1 and DNMT3a mRNA is about equal, in PBL the levels of DNMT1 mRNA are about 10 times higher than DNMT3a, 2) both DNMT1 and DNMT3a mRNA are overexpressed in PBL of SZ patients but similar to the brain, the increase of DNMT1 mRNA is more robust than that of DNMT3a, 3) there is no relationship between the increased expression of DNMT1 or DNMT3a and demographic characteristics or the type of antipsychotic drugs in the two cohorts so far analyzed. However, a study of PBL in a group of first episode SZP is required to establish whether the increase of DNMT1 and DNMT3a mRNA is completely independent and always precedes the administration of antipsychotic drugs. Additional studies may be required to establish whether antipsychotic drugs affect the translational expression of DNMT1 or DNMT 3a or their enzymatic activities.
Although the mechanism whereby DNMT1 and DNMT3a mRNAs are increased in brain and PBL of SZ P is unknown, it is reasonable to postulate that hereditary genetic or epigenetic factors responsible for the increased transcription of DNMT1 or DNMT3a or a similar decreased degradation rate in cortical GABAergic neurons in SZP may also be operative in PBL.
If DNMT1 and DNMT3a mRNA are shown to be consistently overexpressed in brain and lymphocytes of SZ patients and if this overexpression were to correlate with the expression severity of psychotic symptomatology and to be absent in other psychiatric disorders without psychosis, then DNMT1 and DNMT3a mRNA expression could be useful as a contribution to the model for the objective diagnosis of SZ vulnerability.
Collectively, these postmortem brain and PBL studies provide proof of principle that readily available peripheral cells may express epigenetic biomarkers relevant to SZ diagnosis. Furthermore, this suggests that PBL may be potentially useful as reporter cells in developing diagnostic tools for SZ vulnerability. Moreover, as opposed to postmortem brain in which mRNA and proteins may be degraded, a live cell model can be used to examine the functional consequences of genomic alterations and the efficacy of various pharmacological interventions in ameliorating the impaired brain function targeted by SZ.
Footnotes
Publisher's Disclaimer: This is a PDF file of an unedited manuscript that has been accepted for publication. As a service to our customers we are providing this early version of the manuscript. The manuscript will undergo copyediting, typesetting, and review of the resulting proof before it is published in its final citable form. Please note that during the production process errors may be discovered which could affect the content, and all legal disclaimers that apply to the journal pertain.
References
- Abdolmaleky HM, Cheng KH, Russo A, Smith CL, Faraone SV, Wilcox M, Shafa R, Glatt SJ, Nguyen G, Ponte JF, Thiagalingam S, Tsuang MT. Hypermethylation of the reelin (RELN) promoter in the brain of schizophrenic patients: a preliminary report. Am J Med Genet B Neuropsychiatr Genet. 2005;134B (1):60–66. doi: 10.1002/ajmg.b.30140. [DOI] [PubMed] [Google Scholar]
- Akbarian S, Kim JJ, Potkin SG, Hagman JO, Tafazzoli A, Bunney WE, Jr, Jones EG. Gene expression for glutamic acid decarboxylase is reduced without loss of neurons in prefrontal cortex of schizophrenics. Arch Gen Psychiatry. 1995;52(4):258–266. doi: 10.1001/archpsyc.1995.03950160008002. [DOI] [PubMed] [Google Scholar]
- Benes FM, Berretta S. GABAergic interneurons: implications for understanding schizophrenia and bipolar disorder. Neuropsychopharmacology. 2001;25(1):1–27. doi: 10.1016/S0893-133X(01)00225-1. [DOI] [PubMed] [Google Scholar]
- Benes FM, Lim B, Matzilevich D, Walsh JP, Subburaju S, Minns M. Regulation of the GABA cell phenotype in hippocampus of schizophrenics and bipolars. Proc Natl Acad Sci U S A. 2007;12;104(24):10164–10169. doi: 10.1073/pnas.0703806104. [DOI] [PMC free article] [PubMed] [Google Scholar]
- Breese CR, Lee MJ, Adams CE, Sullivan B, Logel J, Gillen KM, Marks MJ, Collins AC, Leonard S. Abnormal regulation of high affinity nicotinic receptors in subjects with schizophrenia. Neuropsychopharmacology. 2000;23(4):351–364. doi: 10.1016/S0893-133X(00)00121-4. [DOI] [PubMed] [Google Scholar]
- Costa E, Dong E, Grayson DR, Guidotti A, Ruzicka W, Veldic M. Reviewing the role of DNA (cytosine-5) methyltransferase overexpression in the cortical GABAergic dysfunction associated with psychosis vulnerability. Epigenetics. 2007;2(1):29–36. doi: 10.4161/epi.2.1.4063. [DOI] [PubMed] [Google Scholar]
- Costa E, Chen Y, Dong E, Grayson DR, Kundakovic M, Maloku E, Ruzicka W, Satta R, Veldic M, Zhubi A, Guidotti A. GABAergic promoter hypermethylation as a model to study the neurochemistry of schizophrenia vulnerability. Expert Rev Neurother. 2009;9(1):87–98. doi: 10.1586/14737175.9.1.87. [DOI] [PubMed] [Google Scholar]
- Fatemi SH, Earle JA, McMenomy T. Reduction in reelin immunoreactivity in hippocampus of subjects with schizophrenia, bipolar disorder and major depression. Mol Psychiatry. 2000;5(6):654–663. doi: 10.1038/sj.mp.4000783. [DOI] [PubMed] [Google Scholar]
- Feighner JP, Robins E, Guze SB, Woodruff RA, Jr, Winokur G, Munoz R. Diagnostic criteria for use in psychiatric research. Arch Gen Psychiatry. 1972;26 (1):57–63. doi: 10.1001/archpsyc.1972.01750190059011. [DOI] [PubMed] [Google Scholar]
- Glantz LA, Austin MC, Lewis DA. Normal cellular levels of synaptophysin mRNA expression in the prefrontal cortex of subjects with schizophrenia. Biol Psychiatry. 2000;1;48(5):389–397. doi: 10.1016/s0006-3223(00)00923-9. [DOI] [PubMed] [Google Scholar]
- Grayson DR, Chen Y, Costa E, Dong E, Guidotti A, Kundakovic M, Sharma RP. The human reelin gene: transcription factors (+), repressors (−) and the methylation switch (+/−) in schizophrenia. Pharmacol Ther. 2006;111(1):272–286. doi: 10.1016/j.pharmthera.2005.01.007. [DOI] [PubMed] [Google Scholar]
- Guidotti A, Auta J, Davis JM, Di-Giorgi-Gerevini V, Dwivedi Y, Grayson DR, Impagnatiello F, Pandey G, Pesold C, Sharma R, Uzunov D, Costa E. Decrease in reelin and glutamic acid decarboxylase67 (GAD67) expression in schizophrenia and bipolar disorder: a postmortem brain study. Arch Gen Psychiatry. 2000;57(11):1061–1069. doi: 10.1001/archpsyc.57.11.1061. [DOI] [PubMed] [Google Scholar]
- Guidotti A, Auta J, Davis JM, Dong E, Grayson DR, Veldic M, Zhang X, Costa E. GABAergic dysfunction in schizophrenia: new treatment strategies on the horizon. Psychopharmacology (Berl) 2005;180(2):191–205. doi: 10.1007/s00213-005-2212-8. [DOI] [PubMed] [Google Scholar]
- Guidotti A, Ruzicka W, Grayson DR, Veldic M, Pinna G, Davis JM, Costa E. S-adenosyl methionine and DNA methyltransferase-1 mRNA overexpression in psychosis. Neuroreport. 2006;18(1):57–60. doi: 10.1097/WNR.0b013e32800fefd7. [DOI] [PubMed] [Google Scholar]
- Hashimoto T, Bergen SE, Nguyen QL, Xu B, Monteggia LM, Pierri JN, Sun Z, Sampson AR, Lewis DA. Relationship of brain-derived neurotrophic factor and its receptor TrkB to altered inhibitory prefrontal circuitry in schizophrenia. J Neurosci. 2005;25(2):372–383. doi: 10.1523/JNEUROSCI.4035-04.2005. [DOI] [PMC free article] [PubMed] [Google Scholar]
- Impagnatiello F, Guidotti AR, Pesold C, Dwivedi Y, Caruncho H, Pisu MG, Uzunov DP, Smalheiser NR, Davis JM, Pandey GN, Pappas GD, Tueting P, Sharma RP, Costa E. A decrease of reelin expression as a putative vulnerability factor in schizophrenia. Proc Natl Acad Sci U S A. 1999;95(26):15718–15723. doi: 10.1073/pnas.95.26.15718. [DOI] [PMC free article] [PubMed] [Google Scholar]
- Levenson JM, Sweatt JD. Epigenetic mechanisms in memory formation. Nat Rev Neurosci. 2005;6(2):108–118. doi: 10.1038/nrn1604. [DOI] [PubMed] [Google Scholar]
- Lewis DA, Hashimoto T, Volk DW. Cortical inhibitory neurons and schizophrenia. Nat Rev Neurosci. 2005;6(4):312–24. doi: 10.1038/nrn1648. [DOI] [PubMed] [Google Scholar]
- Lieberman JA, Bymaster FP, Meltzer HY, Deutch AY, Duncan GE, Marx CE, Aprille JR, Dwyer DS, Li XM, Mahadik SP, Duman RS, Porter JH, Modica-Napolitano JS, Newton SS, Csernansky JG. Antipsychotic drugs: comparison in animal models of efficacy, neurotransmitter regulation, and neuroprotection. Pharmacol Rev. 2008;60(3):358–403. doi: 10.1124/pr.107.00107. [DOI] [PMC free article] [PubMed] [Google Scholar]
- Mill J, Tang T, Kaminsky Z, Khare T, Yazdanpanah S, Bouchard L, Jia P, Assadzadeh A, Flanagan J, Schumacher A, Wang SC, Petronis A. Epigenomic profiling reveals DNA-methylation changes associated with major psychosis. Am J Hum Genet. 2008;82(3):696–711. doi: 10.1016/j.ajhg.2008.01.008. [DOI] [PMC free article] [PubMed] [Google Scholar]
- Miller CA, Campbell SL, Sweatt JD. DNA methylation and histone acetylation work in concert to regulate memory formation and synaptic plasticity. Neurobiol Learn Mem. 2008;89(4):599–603. doi: 10.1016/j.nlm.2007.07.016. [DOI] [PMC free article] [PubMed] [Google Scholar]
- Miller CA, Sweatt JD. Covalent modification of DNA regulates memory formation. Neuron. 2007;15;53(6):857–869. doi: 10.1016/j.neuron.2007.02.022. [DOI] [PubMed] [Google Scholar]
- Morris HM, Hashimoto T, Lewis DA. Alterations in somatostatin mRNA expression in the dorsolateral prefrontal cortex of subjects with schizophrenia or schizoaffective disorder. Cereb Cortex. 2008;18(7):1575–1587. doi: 10.1093/cercor/bhm186. [DOI] [PMC free article] [PubMed] [Google Scholar]
- Poulter MO, Du L, Weaver IC, Palkovits M, Faludi G, Merali Z, Szyf M, Anisman H. GABAA receptor promoter hypermethylation in suicide brain: implications for the involvement of epigenetic processes. Biol Psychiatry. 2008;64(8):645–652. doi: 10.1016/j.biopsych.2008.05.028. [DOI] [PubMed] [Google Scholar]
- Rodriguez MA, Pesold C, Liu WS, Kriho V, Guidotti A, Pappas GD, Costa E. Colocalization of integrin receptors and reelin in dendritic spine postsynaptic densities of adult nonhuman primate cortex. Proc Natl Acad Sci U S A. 2000;28;97(7):3550–3555. doi: 10.1073/pnas.050589797. [DOI] [PMC free article] [PubMed] [Google Scholar]
- Ruzicka WB, Zhubi A, Veldic M, Grayson DR, Costa E, Guidotti A. Selective epigenetic alteration of layer I GABAergic neurons isolated from prefrontal cortex of schizophrenia patients using laser-assisted microdissection. Mol Psychiatry. 2007;12(4):385–397. doi: 10.1038/sj.mp.4001954. [DOI] [PubMed] [Google Scholar]
- Satta R, Maloku E, Zhubi A, Pibiri F, Hajos M, Costa E, Guidotti A. Nicotine decreases DNA methyltransferase 1 expression and glutamic acid decarboxylase 67 promoter methylation in GABAergic interneurons. Proc Natl Acad Sci U S A. 2008;21;105(42):16356–16361. doi: 10.1073/pnas.0808699105. [DOI] [PMC free article] [PubMed] [Google Scholar]
- Sharma RP, Grayson DR, Gavin DP. Histone deacetylase 1 expression is increased in the prefrontal cortex of schizophrenia subjects: analysis of the National Brain Databank microarray collection. Schizophr Res. 2008;98(1–3):111–117. doi: 10.1016/j.schres.2007.09.020. [DOI] [PMC free article] [PubMed] [Google Scholar]
- Tremolizzo L, Carboni G, Ruzicka WB, Mitchell CP, Sugaya I, Tueting P, Sharma R, Grayson DR, Costa E, Guidotti A. An epigenetic mouse model for molecular and behavioral neuropathologies related to schizophrenia vulnerability. Proc Natl Acad Sci U S A. 2002;99(26):17095–17100. doi: 10.1073/pnas.262658999. [DOI] [PMC free article] [PubMed] [Google Scholar]
- Van Emburgh BO, Robertson KD. In: DNA-methyltransferases and methyl-CpG binding proteins as multifunctional regulators of chromatin structure and development in mammalian cells. Tost EJ, editor. Epigenetics, Caister Academic Press; Norfolk, England: 2008. [Google Scholar]
- Veldic M, Caruncho HJ, Liu WS, Davis J, Satta R, Grayson DR, Guidotti A, Costa E. DNA-methyltransferase 1 mRNA is selectively overexpressed in telencephalic GABAergic interneurons of schizophrenia brains. Proc Natl Acad Sci U S A. 2004;101(1):348–353. doi: 10.1073/pnas.2637013100. [DOI] [PMC free article] [PubMed] [Google Scholar]
- Veldic M, Guidotti A, Maloku E, Davis JM, Costa E. In psychosis, cortical interneurons overexpress DNA-methyltransferase 1. Proc Natl Acad Sci U S A . 2005;8;102(6):2152–2157. doi: 10.1073/pnas.0409665102. [DOI] [PMC free article] [PubMed] [Google Scholar]
- Veldic M, Kadriu B, Maloku E, Agis-Balboa RC, Guidotti A, Davis JM, Costa E. Epigenetic mechanisms expressed in basal ganglia GABAergic neurons differentiate schizophrenia from bipolar disorder. Schizophr Res. 2007;91(1–3) doi: 10.1016/j.schres.2006.11.029. [DOI] [PMC free article] [PubMed] [Google Scholar]
- Woo TU, Shrestha K, Lamb D, Minns MM, Benes FM. N-methyl-D-aspartate receptor and calbindin-containing neurons in the anterior cingulate cortex in schizophrenia and bipolar disorder. Biol Psychiatry. 2008;64(9):803–809. doi: 10.1016/j.biopsych.2008.04.034. [DOI] [PMC free article] [PubMed] [Google Scholar]
- Wyatt RJ, Termini BA, Davis J. Biochemical and sleep studies of schizophrenia: a review of the literature. Schiz Bull. 1971;1(4):10–44. [Google Scholar]