

Abstract
Bortezomib induces remissions in 30%-50% of patients with relapsed mantle cell lymphoma (MCL). Conversely, more than half of patients' tumors are intrinsically resistant to bortezomib. The molecular mechanism of resistance has not been defined. We generated a model of bortezomib-adapted subclones of the MCL cell lines JEKO and HBL2 that were 40- to 80-fold less sensitive to bortezomib than the parental cells. Acquisition of bortezomib resistance was gradual and reversible. Bortezomib-adapted subclones showed increased proteasome activity and tolerated lower proteasome capacity than the parental lines. Using gene expression profiling, we discovered that bortezomib resistance was associated with plasmacytic differentiation, including up-regulation of IRF4 and CD38 and expression of CD138. In contrast to plasma cells, plasmacytic MCL cells did not increase immunoglobulin secretion. Intrinsically bortezomib-resistant MCL cell lines and primary tumor cells from MCL patients with inferior clinical response to bortezomib also expressed plasmacytic features. Knockdown of IRF4 was toxic for the subset of MCL cells with plasmacytic differentiation, but only slightly sensitized cells to bortezomib. We conclude that plasmacytic differentiation in the absence of an increased secretory load can enable cells to withstand the stress of proteasome inhibition. Expression of CD38 and IRF4 could serve as markers of bortezomib resistance in MCL. This study has been registered at http://clinicaltrials.gov as NCT00131976.
Introduction
Mantle cell lymphoma (MCL) is a mature B-cell neoplasm with a hallmark chromosomal translocation t(11;14)(q13;q32) that leads to cyclin D1 overexpression. Morphologically, MCL tumors can be classified into a classic variant and the more aggressive blastic variant. MCL cells also carry a high number of secondary genomic alterations involving key genes in cell-cycle control, DNA damage response, and survival pathways.1,2 Tumor proliferation has emerged as the main determinant of survival.3 MCL is one of the most difficult to treat B-cell lymphomas. The majority of MCL patients present with disseminated disease and 20%-30% show leukemic involvement. Although conventional chemotherapy induces high rates of remission in MCL, relapse within a few years is virtually certain, contributing to a relatively short overall survival. Intensification of first-line treatment has improved progression-free survival, but no curative regimen has been defined and the toxicity of these regimens limits their use in the often elderly patient population.4
In search of new effective therapies, bortezomib, the first proteasome inhibitor in clinical use, has been found to have significant activity in several phase II clinical trials, where it achieved durable responses in 30%-50% of patients with relapsed MCL.5–7 These results led to US Food and Drug Administration approval of bortezomib as a second-line treatment for MCL in 2006. Bortezomib was equally active in previously treated and untreated as well as in relapsed and refractory patients, suggesting little cross-resistance with conventional chemotherapy.5,8 The clinical activity in MCL is remarkable, with reported response rates that are twice as high as in other B-cell non-Hodgkin lymphoma subtypes.9 Bortezomib is also highly active as a single agent in multiple myeloma (MM),10 Waldenstrom macroglobulinemia,11 and systemic light-chain amyloidosis,12 inducing responses in 38%, 44%, and 57% of relapsed patients, respectively. In contrast, single-agent bortezomib has no significant clinical activity in several types of leukemia, in Hodgkin lymphoma, and in most solid tumors, despite often promising preclinical activity.
Bortezomib, a peptide boronic acid analog, reversibly inhibits the β5 subunit of the proteasome that mediates the chymotrypsin-like activity and, with lower affinity, the β1 subunit responsible for caspase-like activity.13 A rationale for the development of bortezomib in MM has been its ability to inhibit the nuclear factor-κB (NF-κB) pathway through reduced proteasomal degradation of the inhibitor IκBα. However, recent studies found no inhibition of constitutive NF-κB activity in MM or MCL cells by bortezomib.14–16 Even when there is inhibition of NF-κB activation, it may not be an important mechanism of cytotoxicity, as shown in Hodgkin disease cell lines.17 The results of these studies indicate that inhibition of NF-κB may not be as important for bortezomib activity as was initially thought.
Inhibition of the proteasome profoundly disrupts protein homeostasis and leads to rapid accumulation of polyubiquitinated proteins in the cytosol at the endoplasmic reticulum (ER) membrane during the retrotranslocation of unfolded, misfolded, or damaged proteins, especially in the ER.18 The increase in protein load triggers an adaptive stress response, interchangeably called the ER-stress response or the unfolded protein response (UPR).19 We have recently shown that bortezomib elicits an ER stress response in MCL cells and causes cell death through transcriptional activation of the BH3-only protein NOXA by 2 cooperating mechanisms, induction of ATF3 and ATF4 and blockade of histone H2A ubiquitination. NOXA antagonizes MCL1 and leads to BAK- and BAX-dependent mitochondrial apoptosis.20,21 Induction of an overwhelming ER stress response has also been implicated as the mechanism of bortezomib-induced cytotoxicity in MM.22
The mechanisms of bortezomib resistance and the basis for the preferential clinical activity of bortezomib in some tumors but not others remain poorly defined. Analysis of bortezomib-resistant cell lines derived by adaptation to increasing concentrations of the drug in vitro identified changes in the expression of proteasome subunits, resulting in increased or relatively less bortezomib-sensitive proteasome activity in bortezomib-adapted cells.23–26 Recently, mutations in the PSMB5 subunit have been shown to cause resistance in bortezomib-adapted monocytic THP1 and T-lymphoblastic Jurkat cells.25–27 However, these cell lines are derived from entities that are not clinically responsive to bortezomib and no PSMB5 mutations have been detected in clinical samples.28 In MM, preliminary analysis suggests that the rate of immunoglobulin secretion may be a key determinant of clinical response.22,29 Even less is known about the mechanism of bortezomib resistance in MCL.
The aim of this study was to characterize mechanisms of bortezomib resistance in MCL and to identify possible markers that could predict response to treatment. We generated a model of bortezomib resistance by adapting MCL cell lines to bortezomib in vitro. Surprisingly, these cells survived at low proteasome capacity and showed partial plasmacytic differentiation. We then validated these findings in intrinsically bortezomib-resistant MCL cell lines and in tumor cells from patients undergoing treatment with bortezomib.
Methods
Cell lines, generation of bortezomib-adapted subclones, retroviral transfection, and treatments
HBL2, JEKO, MINO, and REC1 MCL cell lines were cultured as described in Rizzatti et al.30 Bortezomib-resistant (BR) cell lines were generated by continuous culture of parental (PT) cell lines in increasing concentrations of bortezomib up to a maximum concentration of 100nM. Once established, BR cell lines were removed from bortezomib, expanded, and cultured under the same conditions as the PT cell lines.
Cell lines expressing the ecotropic retroviral receptor and the bacterial tetracycline repressor were derived as described in Ngo et al.31 The shIRF4 vector containing a doxycycline-inducible H1 promoter for shRNA expression, puromycin resistance, and green fluorescent protein (GFP), and the vector for IRF4 overexpression, carrying only puromycin resistance, were described previously by Sciammas et al.32 Virus containing supernatant of 293T cells was used to infect target cells by centrifugation (2500 rpm for 90 minutes) in the presence of DOTAP (Roche). To assess the effect of shRNAs, 3 days after infection, 50 ng/mL of doxycycline (Calbiochem) was added and GFP was used to track the persistence of transfected cells. When indicated, puromycin (2 μg/mL) was used to select transfected cells.
CpG ODN 2006 (phosphorothioate: TCGTCGTTTTGTCGTTTTGTCGTT) (5 μg/mL) was added to 0.5 × 10⁶ cells/mL. CpG and culture media were renewed every 24 hours and cell supernatants were collected to assess immunoglobulin secretion.
Patients and clinical samples
Peripheral blood tumor samples were obtained from 10 MCL patients with leukemic disease consecutively enrolled in a phase 2 clinical trial (clinical trial identifier: NCT00131976) approved by the National Cancer Institute institutional review board. All cases were cyclin D1–positive. Flow cytometry was performed on an FACSCalibur analyzed with CellQuest software (BD Biosciences). CD38+ cells were determined as the percentage of B cells that were CD19− and CD5+ and stained more intensely with anti-CD38 (CD38-PE, BD Biosciences) than CD38− non-B cells, and were quantified as the geometric mean fluorescence. Clinical response to bortezomib was measured by the decrease in absolute lymphocyte count (ALC) on day 21 after one cycle of bortezomib 1.5 g/m2 on days 1, 4, 8, and 11 for patients 1-4; 1.3 g/m2 on days 1 and 4 for patients 5 and 6; and 1.3 g/m2 on days 1, 4, 8, and 11 for patients 7-10. Patients subsequently received 6 cycles of bortezomib-containing combination chemotherapy. Peripheral blood mononuclear cells were isolated by gradient centrifugation using lymphocyte separation medium (MP Biomedicals) and cryopreserved in liquid nitrogen in 10% dimethyl sulfoxide, 90% fetal calf serum. Fresh tumor cells were purified using immunomagnetic microbeads to CD19 (Miltenyi Biotec).
Cytotoxicity assay
Cells (50 000/well) were exposed to serial doubling concentrations of the indicated drugs for 48 hours in flat-bottom, 96-well plates. For the last 4 hours, methylthiazolyldiphenyl-tetrazolium bromide (MTT) reagent (Chemicon) at 0.5 mg/mL was added, and the reaction was terminated by the addition of 0.01M HCl, 10% sodium dodecyl sulfate. Absorbance was measured at the wavelengths of 570 nm (test) and 650 nm (reference). The half-maximal inhibitory concentration (IC50) was calculated by nonlinear regression using Prism 4.0 software (GraphPad). Bortezomib was from Millennium Pharmaceuticals. MG-132, 4-hydroxy-5-iodo-3-nitrophenylacetyl-Leu-Leu-leucinal-vinyl sulfone (NLVS), fludarabine, hydrocortisone, and etoposide were from Sigma-Aldrich. For CpG experiments, cytotoxicity was measured by staining with the mitochondrial probes MitoTracker Red CMXRos and MitoTracker Green FM (Invitrogen).
Proteasome assay
Whole-cell lysates were prepared by lysing cells in 5mM EDTA (ethylenediaminetetraacetic acid; pH 8.0) as described in Rizzatti et al.30 The chymotrypsin-like activity of proteasome was measured by detection of the fluorophore 7-amino-4-methylcoumarin after its cleavage from the labeled substrate LLVY-7-amino-4-methylcoumarin (Chemicon). The assay was performed following the manufacturer's instructions and fluorescence intensity was measured at the 355-nm (excitation) and 460-nm (emission) wavelengths. Trypsin- and caspase-like activities were assessed by luminometry using the peptide substrates Z-LRR-aminoluciferin and Z-nLPnLD-aminoluciferin, respectively (Proteasome-Glo, Promega). Experiments were carried out in duplicate, and standard curves generated by serial dilutions of a purified proteasome extract were used as controls.
Gene expression profiling, gene set enrichment analysis, and statistics
For gene expression profiling, 2.5 μg of total RNA was used to generate biotin-labeled cRNA, and 20 μg of fragmented cRNA (∼ 200-bp size) was hybridized to U133 plus 2.0 chips for 16 hours, washed, and stained on a fluidics station (Affymetrix). Affymetrix GeneChip operating software version 1.4 was used to calculate signal intensity and present calls. The signal-intensity values were transformed with an adaptive variance-stabilizing, quantile-normalizing transformation (P. J. Munson, GeneLogic Workshop of Low Level Analysis of Affymetrix GeneChip Data, 2001; software is available at http://abs.cit.nih.gov/geneexpression.html). Significant gene signatures were identified with gene set enrichment analysis software (GSEA, Broad Institute at MIT, Cambridge, MA; software is available at: http://www.broadinstitute.org/gsea/). A 2-class analysis with 1000 permutations of gene sets and a weighted metric was used. Statistical significance was evaluated using Bonferroni correction for multiple testing, and a false discovery rate ≤ 0.1 was considered significant. The leading edge of enriched gene sets, the subset of genes that contributed the most to the enrichment result, were displayed using the Cluster v2.11 and TreeView v1.6 programs (Eisen Laboratory, Stanford University, Stanford, CA). All microarray data are available at the Gene Expression Omnibus (National Center for Biotechnology Information) Web site (http://www.ncbi.nlm.nih.gov/geo/) under accession number GSE20915.
XBP-1 splicing
Polymerase chain reaction (PCR) analysis was performed to detect splicing of XBP-1 using the following primers: forward 5′-TTACGAGAGAAAACTCATGGC-3′ and reverse 5′-GGGTCCAAGTTGTCCAGAATGC-3′. Glyceraldehyde-3-phosphate dehydrogenase was used to control equal amount of RNA and was detected using the following primers: forward 5′-CCTGTTCGACAGTCAGCCG-3′ and reverse 5′-CGACCAAATCCGTTGACTCC-3′. Thirty cycles were performed at 95°C for 45 seconds, 58°C for 30 seconds, and 72°C for 20 seconds. PCR products were separated using a 2.5% agarose gel containing ethidium bromide and imaged using the ChemiImager 5500 and AlphaEase software version 3.2.2 (both Alpha Innotech).
ELSA
A sandwich-type enzyme-linked immunosorbent assay (ELISA) was used to detect the presence of κ or λ immunoglobulins in the supernatants of the MCL cell lines. Costar 3690 plates (96-well; Corning) were coated for 1 hour with 100 ng of goat anti–human κ or λ polyclonal antibodies (Southern Biotech). After blocking with 3% (wt/vol) bovine serum albumin (BSA)/phosphate-buffered saline (PBS) for 1 hour, the plate was incubated for 2 hours with cell supernatant. Subsequently, the plate was washed 10 times with water and incubated for 1 hour with a 1:5.000 dilution of goat anti–human IgG+IgM (H+L) polyclonal antibodies conjugated to horseradish peroxidase (Jackson ImmunoResearch Laboratories) in 1% (wt/vol) BSA/PBS. All of the incubations were done at 37°C. After washing, colorimetric detection was performed using 2,2′-azino-bis(3-ethylbenzthiazoline)-6-sulfonic acid (Roche) according to the manufacturer's directions. Absorbance at 450 nm was measured in a microplate reader (Molecular Devices).
Immunoblotting
Nuclear lysates were obtained using a nuclear fractionation kit (BioVision) according to the manufacturer's protocol. Western-blot analysis was performed with the NuPAGE Bis-Tris electrophoresis system on polyvinylidene fluoride membranes (Invitrogen) blocked in 5% nonfat milk with 0.05% Tween-20. Membranes were incubated with the primary antibodies (1:500 to 1:1000 dilutions) in 5% milk with 0.05% Tween-20 overnight at 4°C or for 1 hour at room temperature. Membranes were developed with enhanced chemiluminescence substrate (SuperSignal, Thermo Fisher Scientific) and visualized on an LAS4000 device (Fujifilm). Protein quantification was done with Image Gauge software (Fujifilm). The following antibodies were used: anti-IRF4 (M-17), anti-BLIMP (3H2E8), ERGIC-53 (clone H-245), anti-γ tubulin, and anti-TBP (58C9; all from Santa Cruz Biotechnology), anti-PSMB5 (Abcam), and GRP78/BIP (Cell Signaling Technology).
Immunophenotype and detection of IRF4 by flow cytometry
For immunophenotype analysis of cell lines, 500 000 cells were stained with 5 μL of antibody in FACS buffer (PBS + 1% fetal calf serum) for 30 minutes on ice, washed, acquired on an FACSCanto and analyzed with FACSDiva software (BD Biosciences). For the quantification of IRF4 expression, 500 000 cells were fixed in 1% paraformaldehyde for 10 minutes at room temperature, washed and resuspended in 1× PBS, 0.5% BSA, and 0.03% saponin. IRF4 antiserum (goat anti-IRF4, M-17) and control antiserum (goat immunoglobulin; Santa Cruz Biotechnology) conjugated to Alexa Fluor 647 (Zenon labeling kit; Invitrogen) was used to stain cells for 20 minutes at room temperature.
Results
Bortezomib-adapted MCL cell lines have increased proteasome capacity and are resistant to proteasome inhibitors
To investigate resistance mechanisms to proteasome inhibitors in MCL, we adapted representative cell lines to increasing concentrations of bortezomib. From a set of previously characterized bortezomib-sensitive MCL cell lines,30 we successfully derived bortezomib-resistant subclones of HBL2 and JEKO that we termed HBL2-BR and JEKO-BR (Figure 1A). Resistance to bortezomib developed incrementally over a year, and when cells were removed from bortezomib, was gradually lost (Figure 1B). The IC50 of bortezomib 1 month after drug washout was 80-fold higher than the IC50 of the PT clone for HBL2-BR and 40-fold higher for JEKO-BR. The BR subclones were also less sensitive to other proteasome inhibitors, but remained sensitive to chemotherapeutic agents such as the topoisomerase II inhibitor etoposide, the nucleoside analog fludarabine, and the corticosteroid hydrocortisone (Table 1). Consistent with prior reports,24,25 we found higher proteasome activity in BR cell lines compared with PT cells, which affected all 3 enzymatic specificities, chymotrypsin-, trypsin-, and caspase-like (Figure 1C). While PSMB5 mRNA expression was not different between the BR and PT cell lines, we found increased protein expression by Western blot (supplemental Figure 1, available on the Blood Web site; see the Supplemental Materials link at the top of the online article). Mutations in the PSMB5 subunit described in bortezomib-adapted THP-1 and Jurkat cells25–27 were absent in HBL2-BR or JEKO-BR cell lines (supplemental Figure 2). To assess the effect of bortezomib on proteasome activity and cell viability, we treated PT and BR cell lines with increasing doses of bortezomib and measured chymotrypsin activity and cell viability at each dose. Surprisingly, BR cell lines were able to tolerate reduced proteasome activity better than PT cell lines (Figure 1D).
Figure 1.

Bortezomib-adapted cell lines have higher proteasome activity and tolerate lower chymotrypsin-like proteasome activity than PT cells. (A) Dose response to bortezomib (Bzm) in PT and BR cell lines. Viability by MTT assay at 48 hours normalized to the carrier control is shown. (B) Reversibility of bortezomib resistance in BR cell lines cultured in the absence of bortezomib. IC50 values were determined as shown in panel A at the indicated time points after bortezomib washout. (C) Baseline proteasome activity in PT and BR cell lines. Chymotrypsin activity was measured at 3 different time points over a 1-month period and data are normalized to the average activity in the corresponding PT cell line. Comparison was by Student t test: *P < .05; **P < .01. Trypsin and caspase-like activities were measured in duplicate and are shown for comparison. (D) Correlation between cell viability by MTT assay and chymotrypsin-like proteasome activity (arbitrary units) in PT and BR cell lines treated with increasing concentrations of bortezomib for 48 hours.
Table 1.
IC50 of proteasome inhibitors and chemotherapeutic agents
| Drug | HBL2 PT | HBL2 BR | Fold increase | JEKO PT | JEKO BR | Fold increase |
|---|---|---|---|---|---|---|
| Bortezomib, nM | 6 | 489.7 | 81.62 | 4.9 | 213.8 | 43.63 |
| MG-132, μM | 0.47 | 1.61 | 3.42 | 0.65 | 2.4 | 3.69 |
| NLVS, μM | 2 | 15.8 | 7.8 | 2.6 | 16.6 | 6.38 |
| Etoposide, μM | 1.25 | 0.60 | 0.48 | 3.8 | 1.9 | 0.50 |
| Fludarabine, μM | 1.9 | 0.65 | 0.34 | 0.7 | 0.45 | 0.64 |
| Hydrocortisone, μM | 60.25 | 44.67 | 0.74 | 87.09 | 25.12 | 0.29 |
IC50 was determined in triplicate by MTT at 48 hours of drug exposure.
NLVS indicates 4-hydroxy-5-iodo-3-nitrophenylacetyl-Leu-Leu-leucinal-vinyl sulfone.
In summary, bortezomib resistance in this model was a gradual and reversible process, indicating an adaptive mechanism. While BR cell lines displayed higher proteasome activity, they also acquired the ability to survive at lower proteasome capacity than the PT cell lines, suggesting the presence of additional changes.
Bortezomib-adapted MCL cell lines display plasmacytic features
We used gene expression profiling to investigate the molecular basis of this adaptive phenotype. We compared gene expression of PT and BR subclones on Affymetrix microarrays. Cells collected at different time points over 1 month were analyzed in triplicate for HBL2 and in duplicate for JEKO subclones. This analysis revealed up-regulation of key regulators of plasma-cell differentiation and pronounced down-regulation of B-cell genes, especially in HBL2-BR. To determine the significance of these changes, we performed GSEA with well-defined gene signatures of plasma-cell differentiation.33,34 Several of these signatures were significantly enriched in the BR cell lines, indicating a shift from a B-cell to a plasmacytic gene expression program in bortezomib-adapted cells (Table 2, Figure 2A-B). Both BR-subclones showed up-regulation of IRF4 target genes, a crucial switch in plasma-cell differentiation.33 Whereas HBL2-BR more strongly expressed a plasmablastic signature, JEKO-BR expressed a signature indicating a shift to a more plasmacytic than plasmablastic maturation (Figure 2A-B). In addition, HBL2-BR showed pronounced down-regulation of BLIMP1-repressed genes (Figure 2C). B-cell to plasma-cell differentiation involves several steps. Zhan et al identified signatures comprising early and late differentiation genes.35 The early differentiation signature was significantly enriched in HBL2-BR but not in JEKO-BR (Table 2, Figure 2D). The late differentiation signature was not detected in any of the BR cell lines. These data indicate that BR cells have acquired a partial plasmacytic phenotype without full differentiation to plasma cells.
Table 2.
Gene signatures of plasma-cell differentiation in bortezomib-adapted MCL cell lines
| Gene signature | HBL2 BR |
JEKO BR |
||
|---|---|---|---|---|
| NES | FDR | NES | FDR | |
| IRF4 high plasma cell vs B cell* | 1.44 | 0.04 | 1.91 | < 0.001 |
| Plasma cell vs B cell* | 1.52 | 0.08 | 1.65 | 0.03 |
| Plasmablast high plasma cell low* | 1.54 | 0.10 | ns | ns |
| Plasma cell high plasmablast low* | ns | ns | 1.69 | 0.03 |
| BLIMP B cell repressed* | −2.48 | < 0.001 | ns | ns |
| Early differentiation genes† | −1.47 | 0.07 | ns | ns |
GSEA was used to test for significant enrichment of defined plasma-cell differentiation signatures. NES indicates normalized enriched score; FDR, false discovery rate; and ns, not significant (FDR > 0.10).
Gene signatures of plasma cell differentiation were downloaded from http://lymphochip.nih.gov/signaturedb/index.html.34
Gene signatures of plasma cell differentiation were extracted from the data of Zhan et al.35
Figure 2.

Bortezomib-adapted cell lines display a plasmacytic phenotype. (A-C) Gene expression signatures of plasma-cell differentiation distinguish bortezomib-adapted HBL2-BR (A, C) and JEKO-BR cell lines (B) from the respective PT cell lines. The leading edge of each gene set is displayed in a heat map. Changes in the expression of selected B-cell and plasma-cell surface markers were confirmed by flow cytometry. (D) Early differentiation genes35 variably expressed between the PT and BR cell lines. Of the 50 genes described in the signature, 43 were expressed in the MCL cell lines. Shown are genes with at least a 1.2-fold change in expression: down-regulation for genes expressed in B cells and up-regulation for genes expressed in plasma cells. (E) BLIMP and IRF4 expression in nuclear fractions from PT and BR cell lines assessed by Western blot using TBP as a loading control. (F) HBL2-BR cells were maintained in culture with (HBL2-BR) or without 100nM bortezomib (HBL2-BR Bzm washout) for 2 months. The expression of B-cell and plasma-cell surface markers assessed by flow cytometry in these and the PT cell line (HBL2-PT) are shown.
Next we assessed the expression of the plasma-cell markers CD38 and CD138 (Syndecan-1) by flow cytometry. BR cell lines expressed CD138 and showed higher expression of CD38 than the PT cell lines (Figure 2A-B). We also confirmed up-regulation of IRF4 in nuclear lysates of BR compared with the respective PT cell lines (Figure 2E). In HBL2-BR cells, we observed marked up-regulation of BLIMP-1, a transcriptional repressor responsible for switching off the B-cell program during plasma-cell differentiation.36 Consistently, we found decreased expression of the B-cell markers CD19, CD24, and CD52, and also of HLA-DR. In JEKO-BR, in keeping with the absence of a significant change in the expression of BLIMP-repressed genes, no BLIMP-1 protein was detected by Western blot (Figure 2E), and B-cell markers were only marginally down-regulated by flow cytometry (data not shown).
We next searched for a correlation between the decrease in bortezomib resistance, as shown in Figure 1B, and the expression of the plasmacytic phenotype. HBL2-BR cultured for 2 months in the absence of bortezomib recovered the expression of the B-cell surface markers CD19 and CD24, and showed decreased expression of CD38 compared with HBL2-BR cells that were continuously maintained in bortezomib (Figure 2F). Thus, the decrease in bortezomib resistance was paralleled by the reversal of plasmacytic differentiation.
Intrinsic bortezomib resistance in MCL cell lines is correlated with the expression of plasmacytic features
We have previously described differential sensitivity to bortezomib in a panel of MCL cell lines.30 Dose-response curves for JEKO and HBL2, representing bortezomib-sensitive cell lines, and for MINO and REC1, which are intrinsically bortezomib resistant, are shown in Figure 3A. The difference in bortezomib sensitivity in this system is smaller than in the bortezomib-adapted cell lines; however, the IC50 for MINO and REC1 were consistently 2- to 4-fold higher than the IC50 in JEKO and HBL2. The reason for the differential sensitivity in these cell lines has not been determined, but baseline proteasome activity and the relative degree of proteasome inhibition by bortezomib were comparable.30 Based on our findings in bortezomib-adapted cells, we analyzed these cell lines for the expression of plasmacytic markers. Strikingly, CD138, the canonical maker of plasma-cell differentiation, was expressed on MINO and REC1 cells, whereas HBL2 and JEKO showed no expression above isotype control. Furthermore, CD38 and IRF4 expression was higher on MINO and REC1 than on HBL2 and JEKO assessed by flow cytometry and Western blot (Figure 3B-C). Thus, similar to bortezomib-adapted cells, the intrinsically bortezomib-resistant cell lines MINO and REC1 expressed plasmacytic differentiation markers.
Figure 3.

Intrinsically bortezomib-resistant MCL cell lines show plasmacytic features. (A) Dose response of bortezomib (Bzm) in JEKO, HBL2, MINO, and REC1 PT cell lines at 48 hours. The MTT assay was used as readout of viability. (B) Expression of the plasma-cell surface markers CD38 and CD138 measured by flow cytometry. (C) IRF4 expression assessed by Western blot in nuclear fractions using TBP as loading control, and by flow cytometry using the same antibody conjugated to Alexa 647. (D) Analysis of XBP1 mRNA expression by RT-PCR. The active, spliced form (XBP-1s) is shorter and runs faster on the gel than the inactive, unspliced form (XBP-1u). JEKO cells treated with thapsigargin (2μM) for 6 hours were used as the positive control (+) and glyceraldehyde-3-phosphate dehydrogenase (GADPH) for the loading control. (E) Detection of κ and λ immunoglobulins by sandwich ELISA in media containing 50 ng/mL of polyclonal human immunoglobulin G and in supernatants of MCL cell lines cultured for 24 hours at 1 × 10⁶ cells/mL. The absorbance at 450 nm is shown for triplicates ± SD.
Full plasma-cell differentiation includes increased synthesis and secretion of immunoglobulins. This secretory program, controlled by the transcription factor XBP-1, is activated by splicing of an inactive full-length precursor XBP-1 mRNA that can only then be translated into active XBP-1 protein.37 Using a PCR assay that distinguishes the 2 XBP-1 mRNA isoforms, we found no evidence for XBP-1 splicing in MINO or REC1 (Figure 3D). Similarly, we found no XBP-1 splicing in the BR cell lines (data not shown). The absence of XBP-1 splicing indicates that the secretory program was not executed in these cell lines. In support of this conclusion, we found only minimal secretion of immunoglobulins into the cell culture supernatant, and there was no significant difference between plasmacytic cell lines MINO and REC1 compared with HBL2 and JEKO (Figure 3E).
Differential bortezomib sensitivity at distinct stages of plasma-cell differentiation
Our data so far indicate that partial plasmacytic differentiation in the absence of immunoglobulin secretion allows cells to tolerate the accumulation of intracellular proteins during proteasome inhibition. This is reminiscent of stages in normal plasma-cell differentiation. Using proteomic profiling, van Anken et al identified several differentiation steps in the B-cell to plasma-cell transition that precede the onset of protein secretion. In anticipation of their secretory role, cells up-regulate chaperones, ER resident proteins, and proteins involved in redox homeostasis and metabolism.38
To study bortezomib sensitivity as a function of plasmacytic differentiation, we used CpG oligonucleotides to activate TLR9.39 HBL2 cells stimulated with CpG rapidly acquired a plasmacytic phenotype, including increased expression of IRF4 and CD138 with concomitant down-regulation of CD19 (Figure 4A). CD38 expression was variable at early time points, but was consistently up-regulated at 72 hours (not shown). Immunoglobulin secretion in CpG-stimulated cells was minimal at 24 hours and increased steeply thereafter (Figure 4B). To analyze the effect of plasma-cell differentiation on bortezomib sensitivity, we exposed CpG-stimulated cells to the inhibitor at different time points. After 24 hours, when immunoglobulin secretion was still minimal, CpG-stimulated cells were less sensitive to bortezomib than unstimulated cells (Figure 4B). This situation resembles the differentiation status in bortezomib-resistant MCL cells. As immunoglobulin secretion increased, CpG-stimulated cells were increasingly sensitized to bortezomib, and by 72 hours became more sensitive than unstimulated cells. We attempted to reproduce this in additional cell lines. However, Jeko cells were not responsive to CpG, and in Mino cells CpG increased the baseline expression of plasmacytic markers but did not induce immunoglobulin secretion (data not shown). Next we assessed the effect of CpG on the expression of GRP78 (BiP), a central ER chaperone involved in the control of the UPR, and of ERGIC53, a chaperone involved in immunoglobulin sorting and transport to the Golgi apparatus. Both proteins are part of the preparatory program in cells initiating plasmacytic differentiation.38,40 As shown in Figure 4C, expression of these proteins was already increased at 24 hours, and continued to increase with longer CpG incubation times. These results demonstrate a dynamic relation between plasma-cell differentiation and bortezomib sensitivity in B cells.
Figure 4.
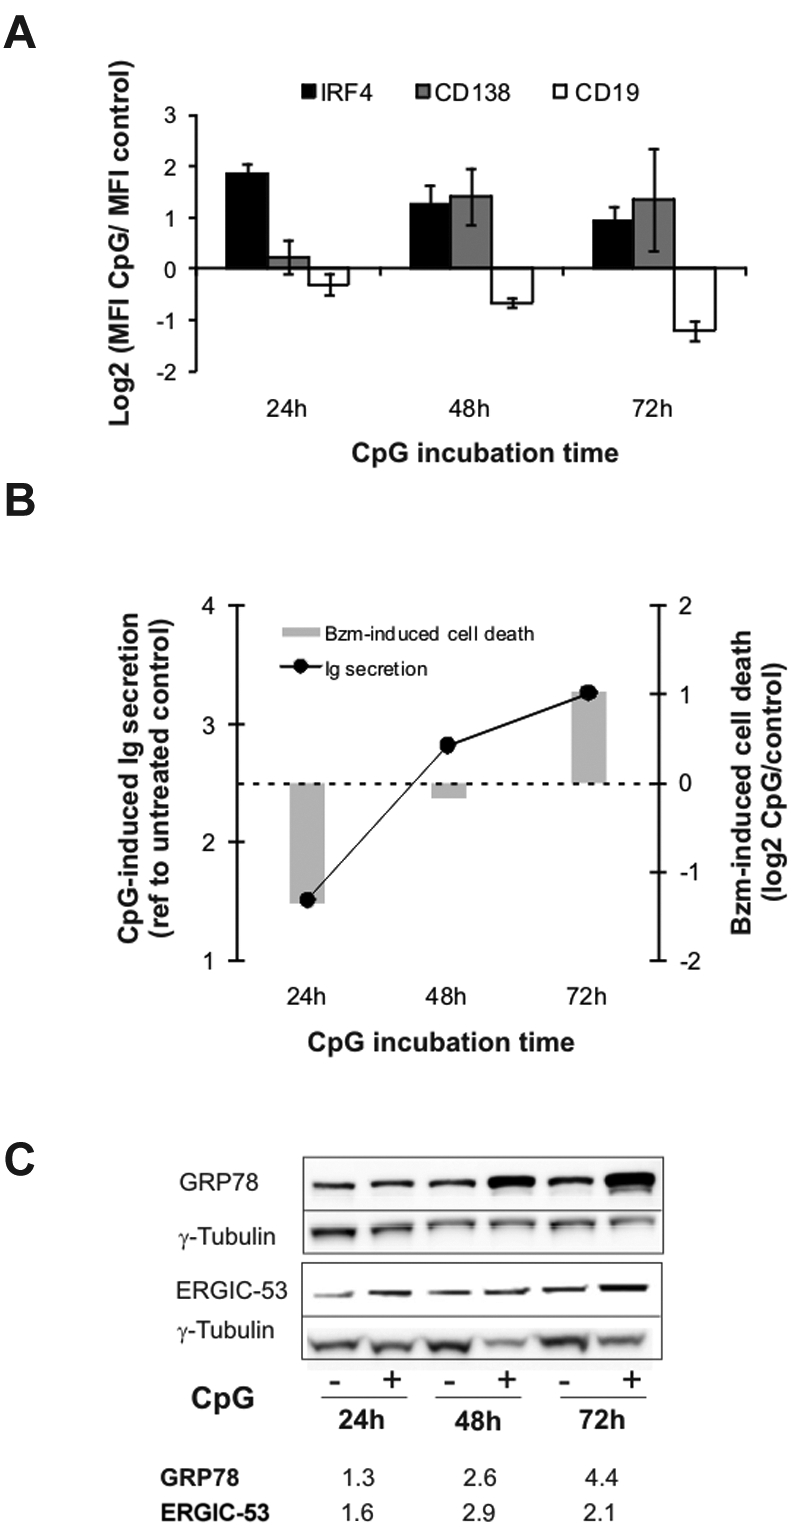
Plasma-cell differentiation and bortezomib sensitivity. HBL2-PT cells were treated for the times indicated with CpG ODN 2006. (A) Expression of CD19, CD138, and IRF4 was measured by flow cytometry. Triplicates and SD from 3 independent experiments are shown. (B) Detection of λ light chain by sandwich ELISA represented as the ratio between CpG-stimulated and unstimulated cells. Cell death in cells treated with 2.5nM bortezomib for 20 hours in the presence or absence of CpG was measured by flow cytometry using MitoTracker, and is shown as the ratio between CpG-stimulated and unstimulated cells. A representative experiment of 3 is shown. (C) Induction of ER-resident chaperones assessed by Western blotting in RIPA lysates using γ-tubulin for loading normalization. Densitometry measurements are given for the ratio between CpG-stimulated and unstimulated cells.
Addiction to IRF4 expression in MCL cells with a plasmacytic phenotype
Having identified a subset of MCL cells with a plasmacytic phenotype and high IRF4 expression, we sought to determine the functional role of IRF4 in MCL. IRF4, which is highly expressed in normal and malignant plasma cells, is essential for the survival of normal plasma cells and MM cells.33 Using a well-established retroviral shRNA system,31,33 we generated subclones of the JEKO and REC1 cell lines with an IRF4 knockdown of at least 40% (Figure 5A). The MM cell line H929 was used as a positive control of IRF4 dependency, and the IRF4-independent cell line OCI-LY19 as a negative control. Unexpectedly, REC1 cells were IRF4 dependent, similar to MM cells, as evidenced by the gradual depletion of cells carrying the IRF4 shRNA (Figure 5A). JEKO cells with moderate IRF4 expression at baseline were only slightly affected by IRF4 knockdown. To rule out a contribution of off-target effects of the IRF4 shRNA, we repeated the knockdown experiment in REC1 cells transfected with an IRF4-expressing retrovirus. Overexpression of IRF4 rescued REC1 cells from shIRF4 toxicity, similar to its effect in H929, demonstrating that REC1 cells indeed depend on IRF4 expression (Figure 5B).
Figure 5.

Addiction to IRF4 in MCL cells. (A) The MCL (JEKO and REC1), MM (H929), and GCB-DLBCL (OCI-LY19) cell lines were retrovirally transfected with a doxycycline-inducible, IRF4-targeting shRNA plasmid containing GFP. shRNA expression was induced by the addition of doxycycline (50 ng/mL) starting on day 0. The percentage of GFP+ cells was monitored by flow cytometry as a measure of live cells expressing shIRF4, and normalized to baseline (day 0). Four days after the addition of doxycycline, IRF4 knockdown was assessed by Western blot, normalized to TBP, and expressed as the ratio between cells transduced with shcontrol and shIRF4. (B) Expression of IRF4 coding region (open symbols) or the corresponding empty vector (black symbols) in REC1 (squares) and H929 (triangles) cells also transfected with shIRF4. Induction of shRNA expression and monitoring of transfected cells was as in (A). (C) REC1 cells expressing shcontrol or shIRF4 were selected with puromycin and induced for 4 days with doxycycline. After 24 hours with increasing bortezomib (Bzm) doses, cytotoxicity was analyzed by MTT.
Given the apparent correlation between high IRF4 expression and bortezomib resistance, we investigated whether IRF4 mediates bortezomib resistance. We first determined bortezomib sensitivity in REC1 cells transduced either with shcontrol or with shIRF4 vectors. Although IRF4 knockdown increased bortezomib cytotoxicity at all concentrations tested, the overall effect was moderate (Figure 5C). Conversely, IRF4 overexpression in JEKO cells could not induce CD38 expression and did not significantly affect sensitivity to bortezomib (data not shown). Thus, overexpression of IRF4 alone was not sufficient to induce bortezomib resistance, indicating that several components of the plasma-cell program cooperate to protect cells from bortezomib-induced apoptosis.
CD38 and IRF4 expression is heterogeneous in primary MCL cells and is correlated with clinical response to bortezomib
Considering the heterogeneous expression of CD38 and IRF4 in MCL cell lines, we sought to determine whether this heterogeneity was also present in primary cells from MCL patients. To this end, we assessed CD38 and IRF4 expression in tumor cells from 10 treatment-naive MCL patients with leukemic disease, and tested the correlation of these markers with the clinical response to bortezomib. All 10 patients were consecutively treated with one cycle of single-agent bortezomib, followed by 6 cycles of combination chemotherapy. The patients' pretreatment characteristics are summarized in Table 3. We assessed the clinical response to single-agent bortezomib at the end of cycle 1 (Figure 6A). Nine of 10 patients were evaluable for response; 4 patients demonstrating a reduction in ALC of more than 50% were considered bortezomib sensitive and 5 were bortezomib resistant. Nuclear lysates from peripheral blood CD19+ selected cells were analyzed by Western blot for IRF4 expression. IRF4 was heterogeneously expressed in all cases, and quantification by densitometry revealed significantly higher IRF4 expression in bortezomib-resistant compared with bortezomib-sensitive tumor cells (P < .05; Figure 6B). In all cases, the primary MCL cells expressed CD38, as detected by flow cytometry. However, cells from patients resistant to bortezomib had significantly brighter CD38 expression than cells from responding patients (P < .05; Figure 6C). Consistent with the description of CD38 as an IRF4 target gene, there was a significant correlation between the expression of these 2 parameters (R2 = 0.4693).
Table 3.
Pretreatment characteristics of MCL patients
| Study number | Sex/age, y | ALC, ×1000/μL | Morphologic variant | Lymphadenopathy | Spleen size, cm* | MIPI† | IGHV gene | % IgVH‡ | CD38 MFI |
|---|---|---|---|---|---|---|---|---|---|
| MCL 1 | M/65 | 26 | B | no | 20 | HR (6) | 1-08 | 96.3 | 2.4 |
| MCL 2 | F/49 | 20 | C | bulky | 32 | HR (6) | 4-04 | 99.7 | 151 |
| MCL 3 | M/66 | 17 | B | yes | 18 | HR (7) | 3-23 | 94.9 | 4.9 |
| MCL 4 | M/70 | 24 | B | yes | 18 | HR (9) | 1-08 | 98.6 | 35 |
| MCL 5 | M/51 | 6.8 | C | yes | 16 | IR (4) | 4-34 | 99.7 | 468 |
| MCL 6 | M/58 | 68 | C | no | 18 | IR (5) | 6-01 | 100 | 18 |
| MCL 7 | F/65 | 48 | C | yes | 10 | HR (7) | 3-07 | 100 | 69 |
| MCL 8 | M/69 | 11 | C | yes | 21 | IR (5) | 4-34 | 99 | 393 |
| MCL 9 | M/65 | 11 | C | yes | 21 | IR (5) | 3-11 | 100 | 93 |
| MCL10 | M/63 | 7.1 | C | yes | 11 | IR (4) | 1-18 | 98.6 | 222 |
C indicates classical; B, blastoid; HR, high risk; IR, intermediate risk; LR, low risk; MFI, mean fluorescence intensity; and MIPI, MCL international prognostic index.
Craniocaudal measurement on CT scan.
Simplified MIPI. Numeric score indicated in parentheses was calculated as described by Hoster et al.57
% Homology of IGHV gene to germline.
Figure 6.

CD38 and IRF4 expression in primary MCL cells is correlated with clinical response to bortezomib. (A) Reduction in the ALC on day 21 of one cycle of bortezomib (Bzm) therapy. (B) IRF4 protein expression in leukemic tumor cells from MCL patients assessed by Western blotting and normalized to TBP. Average of 2 independent determinations is shown. Statistical significance was evaluated using the Mann-Whitney nonparametric U test. (C) Mean fluorescence intensity (MFI) of CD38 surface expression was measured on CD19-gated cells using flow cytometry. Statistical significance was evaluated using the Mann-Whitney nonparametric U test. (D) Pearson correlation between IRF4 expression and CD38 surface expression in MCL patients.
Discussion
The molecular basis for differential clinical responses to bortezomib treatment is poorly understood and may be disease specific. We generated a model of bortezomib-adapted cell lines to investigate the mechanism of resistance to bortezomib in MCL. The gradual development of bortezomib resistance, its reversibility, and the absence of previously described mutations in the PSMB5 proteasome subunit indicated an adaptive process. One component of this adaptation is increased proteasome capacity and overexpression of PSMB5, as has been found in other studies.24,25 In addition, we observed that bortezomib-adapted MCL cell lines were able to tolerate lower proteasome capacity than the corresponding PT cell lines. Using gene expression profiling, we discovered that this acquired bortezomib resistance was associated with the expression of a plasmacytic differentiation program that included up-regulation of IRF4 and expression of CD38 and CD138. While we had no samples to assess whether acquired resistance in the clinical setting is associated with a similar phenotypic change, we found plasmacytic features in intrinsically bortezomib-resistant MCL cell lines and primary MCL cells from patients with inferior clinical responses to bortezomib.
The association of a plasmacytic phenotype with bortezomib resistance in MCL was unexpected given the potent clinical activity of this drug against the clonal plasma cells in MM and systemic light-chain amyloidosis.10,12 Plasma cells are terminally differentiated cells dedicated to secreting large amounts of protein. Plasma-cell differentiation therefore involves adaptation to the functional demands of a high protein load.36,37 In contrast, bortezomib-resistant MCL cells showed only select features of plasma cells, with partial expression of gene signatures characteristic of plasma-cell differentiation, expression of the transcription factor IRF4, and of the cell-surface markers CD38 and CD138. Further differentiation to secretory cells, XBP-1 splicing, and increased production of immunoglobulin were notably absent. In accordance with the partial plasmacytic phenotype we describe, Todd et al showed that B cells lacking XBP1 expression can expand in response to antigen and reach a stage where they express CD138, although they are blocked from initiating immunoglobulin secretion.41
The reversibility of the plasmacytic phenotype in bortezomib-adapted MCL cell lines cultured in the absence of drug supports a dynamic adaptation to a state of disturbed protein homeostasis that is no longer needed once full proteasome activity is restored.
Complementary to our observation in MCL, studies in MM have identified the balance between proteasome capacity and protein load as a central determinant of bortezomib resistance. This “proteasome load versus capacity balance”42 may be of particular importance in secretory cells, and serves as an integrator of several molecular events, including the number and composition of proteasomes, the type of protein synthesized, the efficiency of protein folding in the ER, and the amount of protein secretion.22,29,43,44 By inducing plasma-cell differentiation through TLR9 stimulation, we have demonstrated that bortezomib sensitivity varies along the B-cell to plasma-cell transition according to a model displayed in Figure 7. The demands of high cellular protein load go beyond proteasome capacity, and involve adaptations in metabolism, redox homeostasis, and protein transport. Plasma-cell differentiation thus entails steps that build a comprehensive capacity to deal with all the logistic demands of a professional secretory cell.38 Proteasome inhibition is particularly toxic to secretory cells because it disrupts a key mechanism in protein homeostasis. In MM, it has been shown that the amount of immunoglobulin production is correlated with bortezomib sensitivity29 and the mechanism of apoptosis is tightly linked to induction of the pro-apoptotic arm of the UPR.22 Contrary to MM cells, MCL cells are nonsecretory cells. In the present study, we identified a subset of MCL that has undergone partial plasma-cell differentiation and thereby acquired an increased capacity to cope with an acute increase in protein load during proteasome inhibition. Whether one or a few select genes of the plasma-cell program are sufficient to confer bortezomib resistance in this context remains to be determined. However, it is equally possible that it is the combined effect of many small changes that forms the basis of bortezomib resistance.
Figure 7.

A model for bortezomib resistance in MCL. Bortezomib sensitivity is shown as a function of secretory load relative to the capacity of a cell to deal with protein load. Bortezomib-resistant MCL cells progressing in differentiation through the GC acquire a plasmacytic phenotype that increases their capacity to deal with the protein load. In the absence of increased protein synthesis, this confers a survival advantage during proteasome inhibition. In fully differentiated plasma cells, the secretory load increases and sensitizes these cells to bortezomib.
Expression of a plasmacytic phenotype in MCL cells was surprising given that MCL is considered a malignancy of naive, pre-germinal center (pre-GC) lymphocytes. However, in up to 40% of MCL cases, the tumor cells carry somatic mutations in the expressed immunoglobulin gene.45–48 In addition, some MCL cells that express unmutated immunoglobulin genes show a stereotypic CDR3 region. These findings indicate that at least a subset of MCL is derived from antigen-experienced cells that have transitioned through the GC. In keeping with this interpretation, almost half of MCL cases express immunohistochemical markers characteristic of a GC or post-GC phenotype.49 Our results also indicate that some MCL cases derive from B cells that have initiated plasma-cell differentiation. Indeed, rare MCL cases showing plasma-cell differentiation have been described. In these reports, clonally related B cells and fully differentiated plasma cells showing t(11;14) have been found to coexist.50–52 One case showed 3 discernible populations including a B-cell population in transition to plasma cells characterized by coexpression of CD19, CD38, and CD138.51 These cases may be extremes, but illustrate the ability of MCL cells to differentiate into plasma cells. The plasmacytic phenotype we describe herein is more subtle but appears to be more common: 3 of 10 primary cases in our study showed CD38 expression of at least twice the median, and in a series of 127 MCL tumors, IRF4 expression has been reported in 35% of cases.49
Increased IRF4 expression was common to all 3 types of bortezomib-resistant MCL cells investigated here. IRF4 fulfills critical functions at several stages of B-cell development,53,54 and is required for class-switch recombination, plasma-cell differentiation, and survival.32,55 MM cells are highly dependent on IRF4.33 Similarly, we found that shRNA-mediated knockdown of IRF4 was toxic to MCL cells. The pronounced dependence on IRF4 expression in REC1 cells indicates that IRF4 could be a new therapeutic target in plasmacytic MCL. However, modulation of IRF4 levels had only marginal effects on bortezomib sensitivity, and IRF4 overexpression could not protect JEKO cells from bortezomib-induced apoptosis, suggesting that additional components of the plasma-cell program cooperate to confer bortezomib resistance.
Expression of a plasmacytic phenotype in primary cells from patients with MCL was associated with inferior clinical response to bortezomib. We were limited to analyzing patients with leukemic disease. However, the pretreatment characteristics of these patients indicated that they are representative of the clinical spectrum found in MCL, and IRF4 expression has been reported to be equally common in nodal and leukemic cases.49 In particular, our study was not limited to the recently appreciated subgroup of indolent MCL with non-nodal leukemic presentation, who generally have a favorable outcome.47 Due to the nature of the clinical trial, we had to assess responses to bortezomib after only one cycle. While this is an unusually short observation period, responses to bortezomib are rapid, with a median time to response of 4 weeks, and our response rate of 44% is comparable with what has been observed in large clinical studies.5,56 In summary, our results establish a correlation between bortezomib resistance and plasmacytic differentiation in MCL. CD38 and IRF4 deserve further investigation as possible clinical markers of bortezomib resistance and should be validated in an expanded cohort of patients.
Supplementary Material
Acknowledgments
Foremost we thank our patients for their willingness to participate in these research studies. We also thank Dr Diane Arthur for cytogenetic analysis; Therese White and Megan Disinski for clinical research support; the NIH Clinical Center Department of Transfusion Medicine for lymphapheresis procedures; and Keyvan Keyvanfar for help with flow cytometry.
This research was supported by the Intramural Research Program, National, Heart, Lung and Blood Institute, and National Cancer Institute of the NIH, and by a Bench-to-Bedside award from the NIH.
Footnotes
The online version of this article contains a data supplement.
The publication costs of this article were defrayed in part by page charge payment. Therefore, and solely to indicate this fact, this article is hereby marked “advertisement” in accordance with 18 USC section 1734.
Authorship
Contribution: P.P.-G. and A.W. designed the study, analyzed data, and wrote the paper; P.P.-G., H.M.-J., A.L.S., M.A.W., E.G.R., C.M.C., and L.S.S. conducted molecular and cellular assays and performed data analysis; C.R. contributed reagents and analyzed data; M.S.-S. and C.Y. performed and analyzed flow cytometry; N.R. and P.L. performed gene expression profiling; I.M. and S.P. provided pathology evaluations; W.H.W. initiated and supervised the clinical trial; C.C.M., K.D., A.W., and W.H.W. evaluated patients and collected clinical data; A.W. and L.M.S. contributed to the design of the study, contributed reagents, and analyzed data; and A.W. coordinated and supervised laboratory studies.
Conflict-of-interest disclosure: The authors declare no competing financial interests.
Correspondence: Adrian Wiestner, Hematology Branch, NHLBI, NIH, Bldg 10, CRC 3-5140, 10 Center Dr, Bethesda, MD 20892-1202; e-mail: wiestnea@nhlbi.nih.gov.
References
- 1.Jares P, Colomer D, Campo E. Genetic and molecular pathogenesis of mantle cell lymphoma: perspectives for new targeted therapeutics. Nat Rev Cancer. 2007;7(10):750–762. doi: 10.1038/nrc2230. [DOI] [PubMed] [Google Scholar]
- 2.Pérez-Galán P, Dreyling M, Wiestner A. Mantle cell lymphoma: biology, pathogenesis, and the molecular basis of treatment in the genomic era [published online ahead of print October 12, 2010]. Blood. doi: 10.1182/blood-2010-04-189977. doi: 10.1182/blood-2010-04-189977. [DOI] [PMC free article] [PubMed] [Google Scholar]
- 3.Rosenwald A, Wright G, Wiestner A, et al. The proliferation gene expression signature is a quantitative integrator of oncogenic events that predicts survival in mantle cell lymphoma. Cancer Cell. 2003;3(2):185–197. doi: 10.1016/s1535-6108(03)00028-x. [DOI] [PubMed] [Google Scholar]
- 4.Ghielmini M, Zucca E. How I treat mantle cell lymphoma. Blood. 2009;114(8):1469–1476. doi: 10.1182/blood-2009-02-179739. [DOI] [PubMed] [Google Scholar]
- 5.Fisher RI, Bernstein SH, Kahl BS, et al. Multicenter phase II study of bortezomib in patients with relapsed or refractory mantle cell lymphoma. J Clin Oncol. 2006;24(30):4867–4874. doi: 10.1200/JCO.2006.07.9665. [DOI] [PubMed] [Google Scholar]
- 6.Goy A, Younes A, McLaughlin P, et al. Phase II study of proteasome inhibitor bortezomib in relapsed or refractory B-cell non-Hodgkin's lymphoma. J Clin Oncol. 2005;23(4):667–675. doi: 10.1200/JCO.2005.03.108. [DOI] [PubMed] [Google Scholar]
- 7.O'Connor OA, Wright J, Moskowitz C, et al. Phase II clinical experience with the novel proteasome inhibitor bortezomib in patients with indolent non-Hodgkin's lymphoma and mantle cell lymphoma. J Clin Oncol. 2005;23(4):676–684. doi: 10.1200/JCO.2005.02.050. [DOI] [PubMed] [Google Scholar]
- 8.Belch A, Kouroukis CT, Crump M, et al. A phase II study of bortezomib in mantle cell lymphoma: the National Cancer Institute of Canada Clinical Trials Group trial IND. 150. Ann Oncol. 2007;18(1):116–121. doi: 10.1093/annonc/mdl316. [DOI] [PubMed] [Google Scholar]
- 9.Di Bella N, Taetle R, Kolibaba K, et al. Results of a phase II study of bortezomib in patients with relapsed or refractory indolent lymphoma. Blood. 2010;115(3):475–480. doi: 10.1182/blood-2009-08-233155. [DOI] [PubMed] [Google Scholar]
- 10.Richardson PG, Sonneveld P, Schuster MW, et al. Bortezomib or high-dose dexamethasone for relapsed multiple myeloma. N Engl J Med. 2005;352(24):2487–2498. doi: 10.1056/NEJMoa043445. [DOI] [PubMed] [Google Scholar]
- 11.Chen CI, Kouroukis CT, White D, et al. Bortezomib is active in patients with untreated or relapsed Waldenstrom's macroglobulinemia: a phase II study of the National Cancer Institute of Canada Clinical Trials Group. J Clin Oncol. 2007;25(12):1570–1575. doi: 10.1200/JCO.2006.07.8659. [DOI] [PubMed] [Google Scholar]
- 12.Reece DE, Sanchorawala V, Hegenbart U, et al. Weekly and twice-weekly bortezomib in patients with systemic AL amyloidosis: results of a phase 1 dose-escalation study. Blood. 2009;114(8):1489–1497. doi: 10.1182/blood-2009-02-203398. [DOI] [PubMed] [Google Scholar]
- 13.Adams J, Palombella VJ, Sausville EA, et al. Proteasome inhibitors: a novel class of potent and effective antitumor agents. Cancer Res. 1999;59(11):2615–2622. [PubMed] [Google Scholar]
- 14.Hideshima T, Ikeda H, Chauhan D, et al. Bortezomib induces canonical nuclear factor-kappaB activation in multiple myeloma cells. Blood. 2009;114(5):1046–1052. doi: 10.1182/blood-2009-01-199604. [DOI] [PMC free article] [PubMed] [Google Scholar]
- 15.Markovina S, Callander NS, O'Connor SL, et al. Bortezomib-resistant nuclear factor-kappaB activity in multiple myeloma cells. Mol Cancer Res. 2008;6(8):1356–1364. doi: 10.1158/1541-7786.MCR-08-0108. [DOI] [PMC free article] [PubMed] [Google Scholar]
- 16.Yang DT, Young KH, Kahl BS, Markovina S, Miyamoto S. Prevalence of bortezomib-resistant constitutive NF-kappaB activity in mantle cell lymphoma. Mol Cancer. 2008;7:40. doi: 10.1186/1476-4598-7-40. [DOI] [PMC free article] [PubMed] [Google Scholar]
- 17.Zheng B, Georgakis GV, Li Y, et al. Induction of cell cycle arrest and apoptosis by the proteasome inhibitor PS-341 in Hodgkin disease cell lines is independent of inhibitor of nuclear factor-kappaB mutations or activation of the CD30, CD40, and RANK receptors. Clin Cancer Res. 2004;10(9):3207–3215. doi: 10.1158/1078-0432.ccr-03-0494. [DOI] [PubMed] [Google Scholar]
- 18.Vembar SS, Brodsky JL. One step at a time: endoplasmic reticulum-associated degradation. Nat Rev Mol Cell Biol. 2008;9(12):944–957. doi: 10.1038/nrm2546. [DOI] [PMC free article] [PubMed] [Google Scholar]
- 19.Ron D, Walter P. Signal integration in the endoplasmic reticulum unfolded protein response. Nat Rev Mol Cell Biol. 2007;8(7):519–529. doi: 10.1038/nrm2199. [DOI] [PubMed] [Google Scholar]
- 20.Pérez-Galán P, Roue G, Villamor N, Montserrat E, Campo E, Colomer D. The proteasome inhibitor bortezomib induces apoptosis in mantle-cell lymphoma through generation of ROS and Noxa activation independent of p53 status. Blood. 2006;107(1):257–264. doi: 10.1182/blood-2005-05-2091. [DOI] [PubMed] [Google Scholar]
- 21.Wang Q, Mora-Jensen H, Weniger MA, et al. ERAD inhibitors integrate ER stress with an epigenetic mechanism to activate BH3-only protein NOXA in cancer cells. Proc Natl Acad Sci U S A. 2009;106(7):2200–2205. doi: 10.1073/pnas.0807611106. [DOI] [PMC free article] [PubMed] [Google Scholar]
- 22.Obeng EA, Carlson LM, Gutman DM, Harrington WJ, Jr., Lee KP, Boise LH. Proteasome inhibitors induce a terminal unfolded protein response in multiple myeloma cells. Blood. 2006;107(12):4907–4916. doi: 10.1182/blood-2005-08-3531. [DOI] [PMC free article] [PubMed] [Google Scholar]
- 23.Kraus M, Ruckrich T, Reich M, et al. Activity patterns of proteasome subunits reflect bortezomib sensitivity of hematologic malignancies and are variable in primary human leukemia cells. Leukemia. 2007;21(1):84–92. doi: 10.1038/sj.leu.2404414. [DOI] [PubMed] [Google Scholar]
- 24.Rückrich T, Kraus M, Gogel J, et al. Characterization of the ubiquitin-proteasome system in bortezomib-adapted cells. Leukemia. 2009;23(6):1098–1105. doi: 10.1038/leu.2009.8. [DOI] [PubMed] [Google Scholar]
- 25.Oerlemans R, Franke NE, Assaraf YG, et al. Molecular basis of bortezomib resistance: proteasome subunit beta5 (PSMB5) gene mutation and overexpression of PSMB5 protein. Blood. 2008;112(6):2489–2499. doi: 10.1182/blood-2007-08-104950. [DOI] [PubMed] [Google Scholar]
- 26.Lü S, Yang J, Song X, et al. Point mutation of the proteasome beta5 subunit gene is an important mechanism of bortezomib resistance in bortezomib-selected variants of Jurkat T cell lymphoblastic lymphoma/leukemia line. J Pharmacol Exp Ther. 2008;326(2):423–431. doi: 10.1124/jpet.108.138131. [DOI] [PubMed] [Google Scholar]
- 27.Lü S, Yang J, Chen Z, et al. Different mutants of PSMB5 confer varying bortezomib resistance in T lymphoblastic lymphoma/leukemia cells derived from the Jurkat cell line. Exp Hematol. 2009;37(7):831–837. doi: 10.1016/j.exphem.2009.04.001. [DOI] [PubMed] [Google Scholar]
- 28.Politou M, Karadimitris A, Terpos E, Kotsianidis I, Apperley JF, Rahemtulla A. No evidence of mutations of the PSMB5 (beta-5 subunit of proteasome) in a case of myeloma with clinical resistance to Bortezomib. Leuk Res. 2006;30(2):240–241. doi: 10.1016/j.leukres.2005.06.014. [DOI] [PubMed] [Google Scholar]
- 29.Meister S, Schubert U, Neubert K, et al. Extensive immunoglobulin production sensitizes myeloma cells for proteasome inhibition. Cancer Res. 2007;67(4):1783–1792. doi: 10.1158/0008-5472.CAN-06-2258. [DOI] [PubMed] [Google Scholar]
- 30.Rizzatti EG, Mora-Jensen H, Weniger MA, et al. Noxa mediates bortezomib induced apoptosis in both sensitive and intrinsically resistant mantle cell lymphoma cells and this effect is independent of constitutive activity of the AKT and NF-kappaB pathways. Leuk Lymphoma. 2008;49(4):798–808. doi: 10.1080/10428190801910912. [DOI] [PubMed] [Google Scholar]
- 31.Ngo VN, Davis RE, Lamy L, et al. A loss-of-function RNA interference screen for molecular targets in cancer. Nature. 2006;441(7089):106–110. doi: 10.1038/nature04687. [DOI] [PubMed] [Google Scholar]
- 32.Sciammas R, Shaffer AL, Schatz JH, Zhao H, Staudt LM, Singh H. Graded expression of interferon regulatory factor-4 coordinates isotype switching with plasma-cell differentiation. Immunity. 2006;25(2):225–236. doi: 10.1016/j.immuni.2006.07.009. [DOI] [PubMed] [Google Scholar]
- 33.Shaffer AL, Emre NC, Lamy L, et al. IRF4 addiction in multiple myeloma. Nature. 2008;454(7201):226–231. doi: 10.1038/nature07064. [DOI] [PMC free article] [PubMed] [Google Scholar]
- 34.Shaffer AL, Wright G, Yang L, et al. A library of gene expression signatures to illuminate normal and pathological lymphoid biology. Immunol Rev. 2006;210:67–85. doi: 10.1111/j.0105-2896.2006.00373.x. [DOI] [PubMed] [Google Scholar]
- 35.Zhan F, Tian E, Bumm K, Smith R, Barlogie B, Shaughnessy J., Jr Gene expression profiling of human plasma-cell differentiation and classification of multiple myeloma based on similarities to distinct stages of late-stage B-cell development. Blood. 2003;101(3):1128–1140. doi: 10.1182/blood-2002-06-1737. [DOI] [PubMed] [Google Scholar]
- 36.Shaffer AL, Lin KI, Kuo TC, et al. Blimp-1 orchestrates plasma-cell differentiation by extinguishing the mature B cell gene expression program. Immunity. 2002;17(1):51–62. doi: 10.1016/s1074-7613(02)00335-7. [DOI] [PubMed] [Google Scholar]
- 37.Shaffer AL, Shapiro-Shelef M, Iwakoshi NN, et al. XBP1, downstream of Blimp-1, expands the secretory apparatus and other organelles, and increases protein synthesis in plasma-cell differentiation. Immunity. 2004;21(1):81–93. doi: 10.1016/j.immuni.2004.06.010. [DOI] [PubMed] [Google Scholar]
- 38.van Anken E, Romijn EP, Maggioni C, et al. Sequential waves of functionally related proteins are expressed when B cells prepare for antibody secretion. Immunity. 2003;18(2):243–253. doi: 10.1016/s1074-7613(03)00024-4. [DOI] [PubMed] [Google Scholar]
- 39.Capolunghi F, Cascioli S, Giorda E, et al. CpG drives human transitional B cells to terminal differentiation and production of natural antibodies. J Immunol. 2008;180(2):800–808. doi: 10.4049/jimmunol.180.2.800. [DOI] [PubMed] [Google Scholar]
- 40.Kirk SJ, Cliff JM, Thomas JA, Ward TH. Biogenesis of secretory organelles during B cell differentiation. J Leukoc Biol. 87(2):245–255. doi: 10.1189/jlb.1208774. [DOI] [PubMed] [Google Scholar]
- 41.Todd DJ, McHeyzer-Williams LJ, Kowal C, et al. XBP1 governs late events in plasma-cell differentiation and is not required for antigen-specific memory B cell development. J Exp Med. 2009;206(10):2151–2159. doi: 10.1084/jem.20090738. [DOI] [PMC free article] [PubMed] [Google Scholar]
- 42.Bianchi G, Oliva L, Cascio P, et al. The proteasome load versus capacity balance determines apoptotic sensitivity of multiple myeloma cells to proteasome inhibition. Blood. 2009;113(13):3040–3049. doi: 10.1182/blood-2008-08-172734. [DOI] [PubMed] [Google Scholar]
- 43.Cenci S, Mezghrani A, Cascio P, et al. Progressively impaired proteasomal capacity during terminal plasma-cell differentiation. Embo J. 2006;25(5):1104–1113. doi: 10.1038/sj.emboj.7601009. [DOI] [PMC free article] [PubMed] [Google Scholar]
- 44.Cascio P, Oliva L, Cerruti F, et al. Dampening Ab responses using proteasome inhibitors following in vivo B cell activation. Eur J Immunol. 2008;38(3):658–667. doi: 10.1002/eji.200737743. [DOI] [PubMed] [Google Scholar]
- 45.Camacho FI, Algara P, Rodriguez A, et al. Molecular heterogeneity in MCL defined by the use of specific VH genes and the frequency of somatic mutations. Blood. 2003;101(10):4042–4046. doi: 10.1182/blood-2002-11-3456. [DOI] [PubMed] [Google Scholar]
- 46.Kienle D, Krober A, Katzenberger T, et al. VH mutation status and VDJ rearrangement structure in mantle cell lymphoma: correlation with genomic aberrations, clinical characteristics, and outcome. Blood. 2003;102(8):3003–3009. doi: 10.1182/blood-2003-05-1383. [DOI] [PubMed] [Google Scholar]
- 47.Orchard J, Garand R, Davis Z, et al. A subset of t(11;14) lymphoma with mantle cell features displays mutated IgVH genes and includes patients with good prognosis, nonnodal disease. Blood. 2003;101(12):4975–4981. doi: 10.1182/blood-2002-06-1864. [DOI] [PubMed] [Google Scholar]
- 48.Thorsélius M, Walsh S, Eriksson I, et al. Somatic hypermutation and V(H) gene usage in mantle cell lymphoma. Eur J Haematol. 2002;68(4):217–224. doi: 10.1034/j.1600-0609.2002.01662.x. [DOI] [PubMed] [Google Scholar]
- 49.Gualco G, Weiss LM, Harrington WJ, Jr, Bacchi CE. BCL6, MUM1, and CD10 expression in mantle cell lymphoma. Appl Immunohistochem Mol Morphol. 2010;18(2):103–108. doi: 10.1097/PAI.0b013e3181bb9edf. [DOI] [PMC free article] [PubMed] [Google Scholar]
- 50.Swerdlow SH, Zukerberg LR, Yang WI, Harris NL, Williams ME. The morphologic spectrum of non-Hodgkin's lymphomas with BCL1/cyclin D1 gene rearrangements. Am J Surg Pathol. 1996;20(5):627–640. doi: 10.1097/00000478-199605000-00009. [DOI] [PubMed] [Google Scholar]
- 51.Naushad H, Choi WW, Page CJ, Sanger WG, Weisenburger DD, Aoun P. Mantle cell lymphoma with flow cytometric evidence of clonal plasmacytic differentiation: a case report. Cytometry B Clin Cytom. 2009;76(3):218–224. doi: 10.1002/cyto.b.20463. [DOI] [PubMed] [Google Scholar]
- 52.Young KH, Chan WC, Fu K, et al. Mantle cell lymphoma with plasma-cell differentiation. Am J Surg Pathol. 2006;30(8):954–961. doi: 10.1097/00000478-200608000-00004. [DOI] [PubMed] [Google Scholar]
- 53.Ma S, Turetsky A, Trinh L, Lu R. IFN regulatory factor 4 and 8 promote Ig light chain kappa locus activation in pre-B cell development. J Immunol. 2006;177(11):7898–7904. doi: 10.4049/jimmunol.177.11.7898. [DOI] [PubMed] [Google Scholar]
- 54.Johnson K, Hashimshony T, Sawai CM, et al. Regulation of immunoglobulin light-chain recombination by the transcription factor IRF-4 and the attenuation of interleukin-7 signaling. Immunity. 2008;28(3):335–345. doi: 10.1016/j.immuni.2007.12.019. [DOI] [PubMed] [Google Scholar]
- 55.Klein U, Casola S, Cattoretti G, et al. Transcription factor IRF4 controls plasma-cell differentiation and class-switch recombination. Nat Immunol. 2006;7(7):773–782. doi: 10.1038/ni1357. [DOI] [PubMed] [Google Scholar]
- 56.O'Connor OA, Moskowitz C, Portlock C, et al. Patients with chemotherapy-refractory mantle cell lymphoma experience high response rates and identical progression-free survivals compared with patients with relapsed disease following treatment with single agent bortezomib: results of a multicentre Phase 2 clinical trial. Br J Haematol. 2009;145(1):34–39. doi: 10.1111/j.1365-2141.2008.07466.x. [DOI] [PubMed] [Google Scholar]
- 57.Hoster E, Dreyling M, Klapper W, et al. A new prognostic index (MIPI) for patients with advanced-stage mantle cell lymphoma. Blood. 2008;111(2):558–565. doi: 10.1182/blood-2007-06-095331. [DOI] [PubMed] [Google Scholar]
Associated Data
This section collects any data citations, data availability statements, or supplementary materials included in this article.