

Abstract
A de novo 9q33.3-q34.11 microdeletion involving STXBP1 has been found in one of four individuals (group A) with early-onset West syndrome, severe hypomyelination, poor visual attention, and developmental delay. Although haploinsufficiency of STXBP1 was involved in early infantile epileptic encephalopathy in a previous different cohort study (group B), no mutations of STXBP1 were found in two of the remaining three subjects of group A (one was unavailable). We assumed that another gene within the deletion might contribute to the phenotype of group A. SPTAN1 encoding α-II spectrin, which is essential for proper myelination in zebrafish, turned out to be deleted. In two subjects, an in-frame 3 bp deletion and a 6 bp duplication in SPTAN1 were found at the initial nucleation site of the α/β spectrin heterodimer. SPTAN1 was further screened in six unrelated individuals with WS and hypomyelination, but no mutations were found. Recombinant mutant (mut) and wild-type (WT) α-II spectrin could assemble heterodimers with β-II spectrin, but α-II (mut)/β-II spectrin heterodimers were thermolabile compared with the α-II (WT)/β-II heterodimers. Transient expression in mouse cortical neurons revealed aggregation of α-II (mut)/β-II and α-II (mut)/β-III spectrin heterodimers, which was also observed in lymphoblastoid cells from two subjects with in-frame mutations. Clustering of ankyrinG and voltage-gated sodium channels at axon initial segment (AIS) was disturbed in relation to the aggregates, together with an elevated action potential threshold. These findings suggest that pathological aggregation of α/β spectrin heterodimers and abnormal AIS integrity resulting from SPTAN1 mutations were involved in pathogenesis of infantile epilepsy.
Introduction
West syndrome (WS) is a common infantile epileptic syndrome characterized by brief tonic spasms, an electroencephalogram pattern called hypsarrhythmia, and mental retardation.1 Brain malformations and metabolic disorders can be underlying causes of WS, but many cases remain etiologically unexplained.1 Only two causative genes, ARX (MIM ∗300382) and CDKL5 (MIM ∗300203), are mutated in a subset of familial and sporadic X-linked WS cases (ISSX1 and ISSX2 [MIM #308350 and #300672]).2–4 Early infantile epileptic encephalopathy with suppression-burst (EIEE) is the earliest form of infantile epileptic syndrome.5,6 The transition from EIEE to WS occurs in 75% of individuals with EIEE, suggesting a common pathological mechanism between these two syndromes.5,6 We have recently reported that de novo mutations of STXBP1 (MIM ∗602926) cause EIEE.7
Spectrins are submembranous scaffolding proteins involved in the stabilization of membrane proteins.8,9 Spectrins are flexible and long molecules consisting of α and β subunits, which are assembled in an antiparallel side-by-side manner into heterodimers. Heterodimers form by end-to-end tetramers integrating into the membrane cytoskelton.8,9 The spectrin repertoire in humans includes two α subunits and five β subunits. Defects of erythroid α-I and β-I spectrins and neuronal β-III spectrin are associated with hereditary spherocytosis (SPH3 and SPH2 [MIM #270970 and +182870]) and spinocerebellar ataxia type 5 (SCA5 [MIM #600224]), respectively.8,10,11 The α-II spectrin is considered as the major α spectrin expressed in nonerythroid cells, and α-II/β-II spectrin heterodimers are the predominant species in these cells.9,12 Abnormal development of nodes of Ranvier and destabilizing initial clusters of voltage-gated sodium channels (VGSC) were observed in zebrafish α-II spectrin mutants harboring a nonsense mutation. The mutants also showed impaired myelination in motor nerves and in the dorsal spinal cord, suggesting that α-II spectrin plays important roles in the maintenance of the integrity of myelinated axons.13
Here, we describe three cases of early-onset WS with cerebral hypomyelination harboring SPTAN1 (MIM ∗182810) aberrations. Two individuals with in-frame mutations showed more severe phenotypes than one individual with SPTAN1 and STXBP1 deletion. In-frame mutations of SPTAN1 result in aggregation of α-II (mut)/β-II and α-II (mut)/β-III spectrin heterodimers, suggesting dominant-negative effects of the mutations. Spectrin aggregation is associated with disturbed clustering of VGSC and an elevated action potential threshold. Our findings revealed essential roles of α-II spectrin in human brain development and suggest that abnormal AIS is possibly involved in pathogenesis of infantile epilepsy.
Subjects and Methods
Subjects
Subjects 1, 2, and 3 have been originally reported as three of four individuals with early onset WS, severe hypomyelination, reduced white matter, and developmental delay (group A: subjects 1, 2, and 3 were previously named as No. 2, No. 1, and No. 3, respectively, and No. 4 was unavailable for this study).14 Subject 1 has been shown to possess a 9q33.3-q34.11 microdeletion including STXBP1.7 Clinical information of these three subjects with SPTAN1 aberrations is updated in Table S1 available online. We screened for SPTAN1 mutations in a total of eight unrelated individuals with WS accompanied by severe hypomyelination without episodes of prenatal incidents or neonatal asphyxia (six males and two females, including subjects 2 and 3 of group A). Individuals with these two distinctive features (WS and severe hypomyelination) are relatively rare. These eight patients were totally different from the previously investigated 13 EIEE patients (group B).7 Screening tests for metabolic disorders (lactate, amino acids, and uric organic acids) were normal in all subjects. ARX and CDKL5 were not mutated in the six male and two female patients, respectively. The diagnosis was made on the basis of clinical features, including tonic spasms with clustering, arrest of psychomotor development, and hypsarrhythmia on electroencephalogram, as well as brain magnetic resonance imaging (MRI) findings. Experimental protocols were approved by the Committee for Ethical Issues at Yokohama City University School of Medicine. Informed consent was obtained from all individuals included in this study, in agreement with the requirements of Japanese regulations.
Mutation Analysis
Genomic DNA was obtained from peripheral blood leukocytes by standard methods, amplified by GenomiPhi version 2 (GE Healthcare, Buckinghamshire, UK), and used for mutational screening. Exons 2 to 57, covering the SPTAN1 coding region (of transcript variant 1, GenBank accession number NM_001130438), were screened by high-resolution melting curve (HRM) analysis as previously described.7 In transcript variant 2 (GenBank accession number NM_003127), the only difference is that exon 37 of variant 1 was missing. PCR conditions and primer sequences are shown in Table S2. If a sample showed an aberrant melting curve shift, the PCR product was sequenced. All mutations were also verified on PCR products directly via genomic DNA (not amplified by GenomiPhi) as a template. DNAs from 250 Japanese normal controls were screened for the two in-frame SPTAN1 mutations by HRM analysis. Normal controls which showed aberrant melting curve shift were sequenced.
Parentage Testing
For all families showing de novo mutations, parentage was confirmed by microsatellite analysis as previously described.7 Biological parentage was judged if more than four informative markers were compatible and other uninformative markers showed no discrepancies.
Expression Vectors
A full-length human SPTAN1 cDNA was prepared by PCR with first-strand cDNA derived from a human lymphoblastoid cells (LCL) and an IMAGE clone (clone ID 5211391) as a template. The obtained SPTAN1 cDNA was sequenced and confirmed to be identical to a RefSeq mRNA (amino acids 1–2477, GenBank accession number NM_001130438) except for two synonymous base substitutions that have been registered in dbSNP as rs2227864 and rs2227862. Site-directed mutagenesis via a KOD-Plus-Mutagenesis kit (Toyobo, Osaka, Japan) was used to generate SPTAN1 mutants including c.6619_6621 del (p.E2207 del) and c.6923_6928 dup (p.R2308_M2309 dup). A C-terminal Flag-tag was introduced by PCR. All variant cDNAs were verified by sequencing. C-terminal Flag-tagged WT and mutant SPTAN1 cDNAs were cloned into the pCIG vector15,16 to express C-terminal Flag-tagged α-II spectrin as well as nuclear-localized EGFP. WT and mutant SPTAN1 cDNAs were also cloned into the pCAG-EGFP-C1 vector, in which EGFP gene and multiple cloning sites of pEGFP-C1 vector (Clontech, Mountain View, CA) are introduced into a CAG-promoter vector,15,16 to express N-terminal EGFP-tagged α-II spectrin.
For protein expression in Escherichia coli, WT and mutant SPTAN1 cDNAs (amino acids 1445–2477, the last eight spectrin repeats and the EF hand domain) were cloned into pGEX6P-3 (GE Healthcare) to generate glutathione S-transferase (GST) fusion proteins. Human SPTBN1 cDNAs (amino acids 1–1139, GenBank accession number NM_003128, including the actin binding domain and eight spectrin repeats) were prepared by PCR via first-strand cDNA derived from a human LCL, and were cloned into pET-24a (Merck, Darmstadt, Germany) to generate His-tag fusion proteins.
Protein Expression, Purification, and Binding Assay
Proteins were expressed in Escherichia coli BL21 (DE3). Bacteria were grown at 37°C in Lysogeny Broth media with 300 μg/ml ampicillin to a density yielding an absorbance at 600 nm of 0.8. Protein expression was then induced with 1 mM isopropyl-β-d-thiogalactoside (IPTG) at 20°C overnight. Cells were collected by centrifugation and lysed by sonication. Proteins were purified by affinity chromatography with Glutathione Sepharose High Performance (GE Healthcare) for GST-α-II spectrin or HisTrap HP (GE Healthcare) for β-II spectrin-His. α-II spectrins were further purified by HiTrap Q HP (GE Healthcare) and Superdex-200 (GE Healthcare) columns in a buffer containing 150 mM NaCl, 20 mM sodium phosphate buffer (pH 7.5), and 2 mM dithiothreitol (DTT). β-II spectrin was further purified by Superdex-200 (GE Healthcare) columns in a buffer containing 1 M NaCl, 20 mM sodium phosphate buffer (pH 7.5), and 2 mM DTT.
For the GST pull-down assay to examine the assembly of α-II/β-II heterodimers, 0.5 μM GST-α-II spectrin (WT, del mut, or dup mut) or 1 μM GST were preincubated with 1 μM β-II spectrin-His for 1 hr at 4°C with gentle agitation in binding buffer containing 150 mM NaCl, 20 mM sodium phosphate buffer (pH 7.5), and 2 mM DTT. The reaction mixture (100 μl) was transferred onto an Ultrafree-MC (Millipore, Billerica, MA), containing 50 μl of a 75% slurry of Glutathione Sepharose 4B equilibrated in binding buffer, and incubated overnight at 4°C. Unbound proteins were recovered by centrifugation at 500 × g for 2 min. The beads were washed three times with the binding buffer. The bound molecules were eluted with a buffer containing 100 mM NaCl, 20 mM sodium phosphate buffer (pH 7.5), 5 mM DTT, 1 mM EDTA, and 50 mM reduced glutathione. The eluted fractions were analyzed by SDS-PAGE, and protein bands were visualized by staining with Coomassie brilliant blue. For the analytical gel filtration experiments, 3.3 μM GST-α-II spectrin (WT, del mut, or dup mut) were preincubated with or without 3.3 μM β-II spectrin-His for 3 hr at 4°C with gentle agitation in a binding buffer containing 150 mM NaCl, 20 mM sodium phosphate buffer (pH 7.5), and 2 mM DTT. The samples were analyzed by Superdex-200 column equilibrated in binding buffer. The eluted fractions were analyzed by SDS-PAGE and protein bands were visualized by staining with Coomassie brilliant blue.
Structural Prediction
The structure of human α-II spectrin was predicted by homology modeling with Phyre,17 based on sequence homology between human α-II spectrin (1981–2315 aa) and chicken brain alpha spectrin (1662–1982 aa) (Protein data bank ID, 1U4Q).18 The structure and positions of mutations were illustrated by PyMOL with the crystal structure of 1U4Q.
Circular Dichroism Measurements
For circular dichroism (CD) measurements, GST-α-II spectrin were digested with human rhinovirus 3C protease at 4°C, and then the GST-tag was removed by affinity chromatography with glutathione sepharose 4B (GE Healthcare). We measured far-UV CD spectra and estimated the secondary structure as previously described.7 In brief, the experiments were performed in 20 mM sodium phosphate buffer (pH 7.5) containing 150 mM NaCl, 2 mM DTT with or without 1 mM CaCl2, which stabilizes the structure of the EF hand domain. α-II and β-II spectrin concentration was adjusted to 1.7 μM (without CaCl2) and 1.5 μM (with CaCl2). Melting (transition midpoint) temperature (Tm) was calculated by fitting a sigmoid-function equation with KaleidaGraph (Synergy Software, Reading, PA). The data from three independent experiments were averaged and the SD was calculated. Similar results were obtained in the presence or absence of 1 mM CaCl2.
Cell Culture, Transfection, and Immunofluorescence
For primary neuronal cultures for immunofluorescence, cortexes dissected from mice (embryonic days 14 to 15) were dissociated in 0.05% trypsin-EDTA solution (Invitrogen, Carlsbad, CA), and triturated with a Pasteur pipette. The dissociated cells were plated on 200 μg/ml poly-D-lysine (Millipore)/20 μg/ml laminin (Invitrogen)-coated glass coverslips at a density of 15,000 cells/cm2. Expression vectors were introduced at the time of dissociation by electroporation, with the Amaxa Mouse Neuron Nucleofector kit (Lonza, Tokyo, Japan) according to the manufacturer's protocol (Program O-005), and 2 μg plasmid DNA per condition. After cortical neurons attached to coverslips, the medium was changed from normal medium (10% FBS in DMEM) to maintaining medium (2% B27 and 1 × penicillin-streptomycin-glutamine in Neurobasal [Invitrogen]). Half of the medium was replaced with an equal volume of maintaining medium every 4 days. LCLs were grown in RPMI 1640 medium supplemented with 10% FBS, 1 × antibiotic-antimycotic (Invitrogen), and 8 μg/ml tylosin (Sigma, Tokyo, Japan) at 37°C in a 5% CO2 incubator. For the immunofluorescence imaging study, LCLs were plated on coated coverslips as described above for 3–6 hr.
Neurons and LCLs were fixed with 2% paraformaldehyde in PBS for 15 min and permeabilized with 0.1% Triton X-100 for 5 min. For detection of VGSCs, cells were fixed with methanol at −20°C for 10 min. Cells were then blocked with 10% normal goat serum for 30 min. Primary antibodies used for the study were shown in figure legends. Secondary antibodies, highly purified to minimize cross-reactivity, were used: Alexa-488-conjugated goat anti-mouse, anti-rabbit, and anti-chicken (Invitrogen), and Cy3-conjugated goat anti-mouse, anti-rabbit, and anti-chicken (Jackson ImmunoResearch, West Grove, PA). Coverslips were mounted with Vectashield (Vector Laboratories, Burlingame, CA) that contained 4,6-diamidino-2-phenylindole (DAPI) and visualized with an AxioCam MR CCD fitted to Axioplan2 fluorescence microscope (Carl Zeiss, Oberkochen, Germany). We captured images with Axio Vision 4.6 software (Carl Zeiss). Immunofluorescence of aggregated mutant α/β spectrins was much brighter than WT α/β spectrins, leading to constant short exposure time compared with the WT. For detection of ankyrinG and VGSCs, the exposure time was fixed in a series of experiments in order to enable direct comparison between different samples. For evaluation of ankyrinG and VGSC expression, 50 isolated transfected neurons were analyzed in each experiment, and representative cells were photographed. The results were confirmed at least in three independent experiments.
Electrophysiology
Mouse neocortices at embryonic day 15 were dissociated and plated on poly-L-lysine-coated plastic coverslips (Cell desk LF, MS-0113L; Sumitomo Bakelite, Tokyo, Japan) at a density of about 100,000 cells/cm2. 1 μg of expression vector for either WT, del mut, or dup mut α-II spectrin was introduced at the time of dissociation by electroporation with an Amaxa Mouse Neuron Nucleofector kit (Lonza). Primary cortical neurons were cultured in neurobasal medium supplemented with B27 and penicillin-streptomycin-glutamine (Invitrogen). During the culture period, one-half of the medium was changed every day. Whole-cell patch-clamp recordings were obtained from mice neocortical neurons at 9 days in vitro (DIV) neuronal culture. A coverslip was assembled to recording chambers on the stages of upright microscopes (Olympus, Tokyo, Japan) and continuously perfused with oxygenated, standard artificial cerebrospinal fluid (ACSF) at a flow rate of 2 ml/min and a temperature of 30°C. The standard ACSF solution contained the following (mM): 126 NaCl, 2.5 KCl, 1.25 NaH2PO4, 2.0 MgSO4, 2.0 CaCl2, 26.0 NaHCO3, and 20.0 glucose. The images of cells were acquired with Olympus BX51 or BX61 microscopes equipped with electron-multiplying CCD (EMCCD) cameras, #C9100-13 or #C9100-02 (Hamamatsu Photonics, Hamamatsu, Japan), respectively. Transfected cells were selected for recordings by their fluorescence in the nucleus via a 40× water-immersion objective lens (UMPlanFI, Olympus). Membrane currents and membrane potentials were recorded with an Axopatch 700A and 200B amplifier, respectively. Signals were low-pass filtered at 10 kHz and digitized at 50 kHz by means of Digidata 1332A data-acquisition system (Molecular Devices, Tokyo, Japan). Passive membrane properties and action potentials were recorded with patch pipettes (5.8–8.0 MΩ) filled with the following intercellular solutions (in mM): 130 K-methanesulfonic acid, 10 KCl, 2 MgCl2, 0.1 EGTA, and 10 HEPES (pH 7.3) with KOH. For current clamp experiments, cells were held at −60 mV by constant current injection as needed, and their firing pattern were recorded in response to sustained depolarizing current injections (500 ms duration, +10 pA increments) to analyze the input-output relationship in each cell. A single action potential was also evoked to determine their firing threshold. The injection current amplitude (10 ms duration) was increased in 2–10 pA increments from a subthreshold to an intensity well beyond threshold. Voltage-clamp studies for sodium currents were carried out with patch pipettes (5.8–8.0 MΩ) filled with the following intercellular solutions (mM): 145 tetraethylammonium-Cl, 15 NaCl, 2 MgCl2, 10 EGTA, 10 HEPES, 3 MgATP, and 0.4 GTP (pH 7.4) with NaOH. Series resistance was usually below 20 MΩ and compensated by 70%–80%. The remaining linear capacitive and leakage currents were subtracted off-line by scaling average traces recorded at hyperpolarized voltages. Voltage-dependent inward sodium currents were elicited by 500 ms depolarizing steps in 5 mV increments from −90 to +10 mV at a holding membrane potential of −90 mV. For measuring the inactivation protocol of sodium currents, 500 ms long prepotentials started at – 90 mV and were incremented by 5 mV steps while the command potential was kept constant at −30 mV. The current elicited during each test pulse was normalized to the maximal current (I/Imax). Statistical analyses were made with two-way repeated-measures ANOVA followed by a Bonferroni post-test for analysis of the input-output relationship and current amplitude at every voltage step. One-way ANOVA followed by Dunnet's posthoc test was applied for threshold, peak current, kinetics of action potentials, and passive membrane properties. The results are given as mean ± SEM, and threshold p value for statistical significance was 0.05. Statistical comparisons were performed with the Prism 4.0 (GraphPad software, La Jolla, CA).
Results
Identification of SPTAN1 In-Frame Mutations
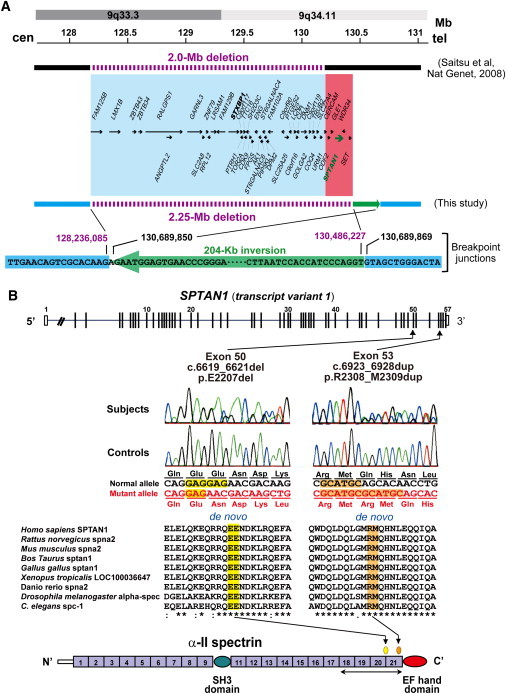
We previously reported a de novo 9q33.3-q34.11 microdeletion involving STXBP1 in an individual with EIEE, who transited afterward to WS at the age of 3 months (subject 1).7 Subject 1 was originally reported as one of four individuals (group A) who showed early onset WS and severe cerebral hypomyelination (as patient No. 2).14 It is likely that haploinsufficiency of STXBP1 caused EIEE and subsequent WS in subject 1;7 however, no mutations of STXBP1 were found in two of the remaining three individuals of group A (subjects 2 and 3, previously described as No. 1 and No. 3, and No. 4 was unavailable for this study).14 Based on obvious severe hypomyelination of the group A individuals, we hypothesized that another gene within the deletion may contribute to the phenotype of group A, especially for severe hypomyelination. Re-examination of the deletion interval by genomic microarray and long PCR successfully determined the 2.25 Mb deletion and the associated 204 kb inversion (Figure 1A and see Figure S1). Among the 46 genes mapped within the deletion, SPTAN1, which encodes α-II spectrin, appeared to be a primary candidate because zebrafish α-II spectrin mutants showed impaired myelination.13 We found de novo heterozygous mutations in SPTAN1 in subjects 2 and 3 (parentage was confirmed in their respective families). Subject 2 has an in-frame 3-bp deletion (c.6619_6621 del) leading to p.E2207 del in the continuous helix region between the last two spectrin repeats, and subject 3 has an in-frame 6 bp duplication (c.6923_6928 dup, p.R2308_M2309 dup) within the last spectrin repeat (Figure 1B). These two mutations were absent in 250 Japanese normal controls (500 alleles). SPTAN1 was further screened in six unrelated individuals with WS and hypomyelination similar to the phenotype of group A (not belonging to group B), but no mutations were found.
Figure 1.
SPTAN1 Aberrations in Individuals with West Syndrome and Cerebral Hypomyelination
(A) Genomic rearrangements at 9q33.3-q34.11 in subject 1. Top depicts chromosomal bands and genomic location (Mb) from the p telomere (cen, toward the centromere; tel, toward the telomere). Our previous study by BAC array could reveal the approximate size of the deletion (2.0 Mb) (horizontal line above boxes).7 The deletion was newly analyzed by Affymetrix GeneChip 250K array and turned out to be 2.25 Mb in size (chr9:128,236,086-130,486,226) (UCSC genome browser coordinate [version Mar. 2006]) (horizontal line below boxes). Blue and red boxes indicate old and renewed deletion intervals, respectively. Five RefSeq genes (ODF2, GLE1, SPTAN1, WDR34, and SET) were newly found (in red box). The rearrangements include an unexpected 204 kb inversion (green arrow). Intact genomic regions are shown in sky blue.
(B) Schematic representation of SPTAN1 (transcript variant 1) consisting of 57 exons (UTR and coding region are open and filled rectangles, respectively). Exon 37 of transcript variant 1 is missing in variant 2, the only difference between the two transcripts. Two distinct mutations were found at evolutionary conserved amino acids in triple helical repeats (spectrin repeats). All these mutations occured de novo. Homologous sequences were aligned with the CLUSTALW web site. α-II spectrin consists of 22 domains (numbered), including 20 spectrin repeats, an SH3 domain, and an EF hand domain. The mutations occurred within the last four spectrin repeats, which are required for α/β heterodimer association (bidirectional arrow).
Phenotypes Associated with SPTAN1 Aberrations
The clinical features of the three subjects with SPTAN1 aberrations are summarized in Table S1. Subjects 2 and 3 showed severe spastic quadriplegia, no developmental progress, and poor visual attention. Epileptic seizures were resistant to various treatments. Subject 3 died of fulminant myocarditis at 3 years of age. In contrast, subject 1 showed slight psychomotor development with eye contact, but no head control. Her seizures have been well controlled. Brain MRI of subjects 2 and 3 revealed widespread brain atrophy including brainstem, hypoplasia, and/or atrophy of the cerebellar hemispheres and vermis, ventriculomegaly, a thinned and shortened corpus callosum, and severe hypomyelination with strikingly reduced white matter at 6 and 3 years of age, respectively (Figure 2). Of note, while subject 1 initially showed striking hypomyelination of cerebral cortex and thin corpus callosum at 12 months of age,14 she completed myelination and showed only slightly reduced white matter at 4 years of age (Figure 2). The apparent differences of drug intractability and severity of cerebral hypomyelination and brainstem/cerebellum atrophy (subjects 2 and 3 versus subject 1) strongly suggested dominant-negative, rather than loss-of-function, effects of the in-frame mutations.
Figure 2.
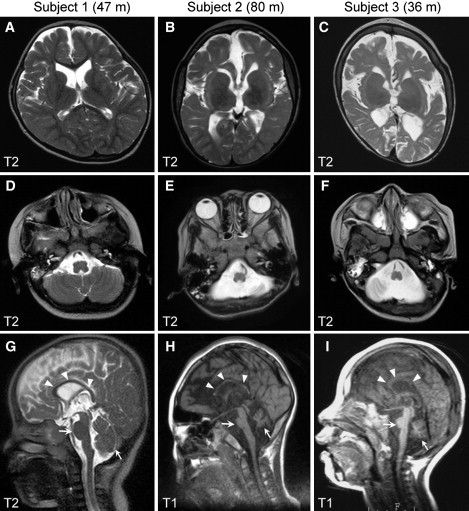
Brain MRI of Subjects with SPTAN1 Aberrations at the Most Recent Developmental Stages
(A–C) T2-weighted axial images through the basal ganglia. Subject 1 (with a 2.25 Mb deletion) showed only slightly reduced white matter (A). By contrast, cortical atrophy and severe hypomyelination with strikingly reduced volume of white matter were evident, especially in the frontal lobes, in subjects with in-frame mutations (subjects 2 and 3) (B and C).
(D–I) T2-weighted axial images through the brainstem/cerebellum (D–F) and T2- (G) or T1-weighted midline sagittal images (H and I). Compared with subject 1 (D and G), subjects 2 (E and H) and 3 (F and I) show a thinned and shortened corpus callosum (arrowheads), severe atrophy of the brainstem, and hypoplasia and/or atrophy of the cerebellar hemispheres and vermis (arrows). m, months.
Characterization of α-II/β-II and α-II/β-III Heterodimers
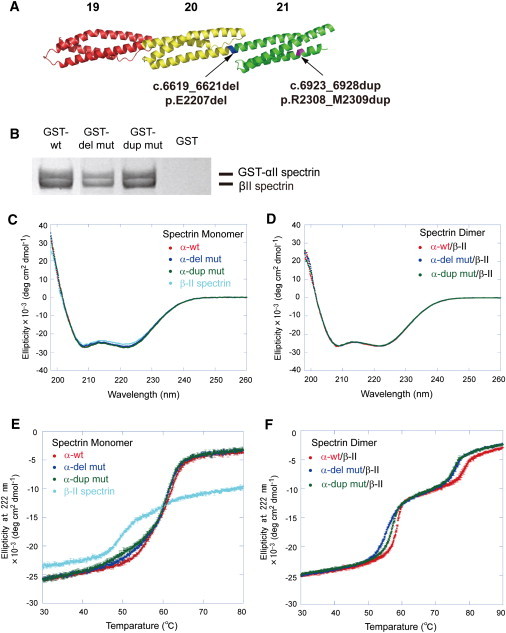
The mutations were predicted to affect formation of α/β spectrin heterodimers, because they were located at the initial nucleation site of the α/β spectrin heterodimer19 (Figures 1B and 3A). To examine the properties of the α-II spectrin mutants in the context of dimer formation, we purified recombinant WT and the two mutant α-II spectrin proteins (c.6619_6621 del, p.E2207 del and c.6923_6928 dup, p.R2308_M2309 dup, designated as del mut and dup mut, respectively). Both GST pull down and analytical gel filtration experiments revealed that the two mutants could form heterodimers with β-II spectrin at comparable levels to the WT (Figure 3B). Circular dichroism (CD) spectra indicated no difference of helical content between WT and mutant α-II spectrin monomers, nor between WT and mutant α-II/β-II heterodimers (Figures 3C and 3D). However, CD melting experiments revealed that the mutations apparently affected the thermostability of α-II/β-II heterodimers (Figure 3F). Considering the melting curves of α-II and β-II spectrin monomers (Figure 3E), the melting transitions of heterodimers in the ranges of 50°C–60°C and 70°C–80°C represent partial dissociation of heterodimers to monomers accompanied by denaturation of a local part of the monomers and complete denaturation, respectively (Figure 3F). Apparent differences of melting curves in the 50°C–60°C and 70°C–80°C ranges suggested that the mutations alter the stability of α-II/β-II heterodimers.
Figure 3.
Mutational Effects on the α-II/β-II Spectrin Heterodimer
(A) Positions of the two mutations (c.6619_6621del, p.E2207 del in blue; c.6923_6928dup, p.R2308_M2309 dup in purple) in the predicted human α-II spectrin structure. Domains 19–21 (the last three spectrin repeats) are colored red, yellow, and green, respectively.
(B) GST pull-down assay of a recombinant GST-tagged α-II spectrin/β-II spectrin heterodimer. The WT and two mutant α-II spectrins could form heterodimers with β-II spectrin at comparable levels. β-II spectrin did not show any binding to GST alone.
(C–F) CD spectra (C and D) and CD melting curves (E and F) at 222 nm of the WT, del mut, and dup mut of α-II spectrins and β-II spectrin as a monomer (C and E) and as heterodimers of the WT, del mut, and dup mut of α-II spectrins with β-II spectrin (D and F). CD spectra showed no difference in the helical content of the WT and mutant α-II spectrin monomers and heterodimers with β-II spectrin (C and D). The WT and mutant α-II spectrin monomers are unfolded at 60°C, whereas β-II spectrin is unfolded around at 50°C (E). In contrast, dimers of WT and mutant α-II spectrins with β-II spectrin are partly dissociated and accompanied with denaturation of a local part of the monomers at 50°C–60°C (Tm [°C]: 58.362 ± 0.059 [WT], 55.617 ± 0.047 [del mut], 57.110 ± 0.077 [dup mut]) and completely unfolded at 70°C–80°C (Tm [°C]: 78.515 ± 0.327 [WT], 75.813 ± 0.115 [del mut], 75.267 ± 0.469 [dup mut]) (F). The thermostability of the heterodimers is obviously different between the WT and the mutants. Each dot represents the average of three repeated experiments; error bars, SD.
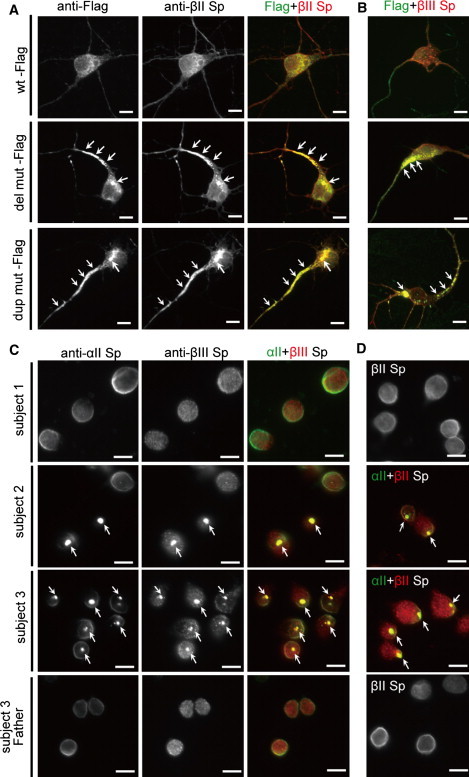
The effect of the mutations was further clarified by transient expression in cultured mouse cortical neurons. α-II spectrin has been shown to be expressed in mouse brain, especially in neuronal axons.20 In cultured cortical neurons, α-II spectrin was expressed at cell extensions and the periphery,21 overlapping with the expression of β-II and β-III spectrins (Figure S2). We generated two α-II spectrin expression vectors: one was a dual expression vector of C-terminally Flag-tagged α-II spectrin and nuclear EGFP (Flag-nucEGFP), and the other was an N-terminally EGFP-tagged (EGFP) α-II spectrin. Tagged WT α-II spectrin from both vectors showed similar expression to endogenous α-II spectrin (Figure 4A and Figure S2). Notably, the two mutant α-II spectrins (del mut and dup mut) showed aggregation, predominantly in cell bodies and axons (Figure 4A, arrows, and Figure S2). Double immunostaining revealed that these aggregations were colocalized with β-II and β-III spectrins (Figures 4A and 4B, arrows, and Figure S2), indicating that unstable α-II/β-II and α-II/β-III spectrin heterodimers were involved in the aggregation. Remarkably, LCLs established from subjects 2 and 3 also showed similar aggregation, while LCLs of subject 1 and subject 3's parents showed no aggregation (Figures 4C and 4D, arrows). These findings indicated dominant-negative effects of the mutations for the integrity of α-II/β-II and α-II/β-III spectrin heterodimers. Immunostaining against β-IV spectrin did not show its involvement in the mutant aggregation (Figure S2).
Figure 4.
Mutant α-II Spectrin Causes Aggregation of α/β Spectrin Heterodimer
(A and B) Expression of the WT and the two mutant α-II spectrins at 7 DIV. Flag tagged-α-II spectrin (WT-Flag) showed similar expression to endogenous α-II spectrin (top, compare with Figure S2A). However, two mutant α-II spectrins (del mut-Flag and dup mut-Flag) showed aggregation predominantly in cell bodies and axons (arrows), and these aggregations were colocalized with β-II and β-III spectrins (middle and bottom).
(C and D) Aggregation of endogenous α/β spectrin heterodimers were found in LCLs derived from two subjects harboring SPTAN1 in-frame mutations. In LCLs of subject 2 (with c.6619_6621del, p.E2207del) and subject 3 (with c.6923_6928dup, p.R2308_M2309dup), aggregation of α-II/β-III (C) and α-II/β-II (D) spectrin heterodimers were frequently observed (middle two panels, arrows), while such aggregation was never observed in subject 1 (top). LCL of subject 3's father did not show any such aggregation (bottom).
The scale bars represent 10 μm. The following primary antibodies were used: mouse anti-α-II spectrin (1:400 dilution; clone D8B7; Abcam, Tokyo, Japan), mouse anti-β-II spectrin (1:600 dilution; clone 42/B-spectrin II; BD Transduction laboratories, San Jose, CA), rabbit anti-β-II spectrin (1:100 dilution; Abcam), rabbit anti-β-III spectrin (1:400 dilution; Abcam), mouse anti-Flag M2 (1:1000 dilution; Sigma), and rabbit anti-DDDDK-Tag (1:2000 dilution; MBL, Nagoya, Japan).
Effects of the SPTAN1 Mutations on ankyrinG and VGSC Clustering at AIS
Spectrins play important roles in clustering specific integral membrane proteins at high density in specialized regions of the plasma membrane.8 To examine the effects of α/β spectrin heterodimer impairment, protein localization at AIS was examined, where ankyrinG and VGSC are clustered and action potentials are initiated.22,23 At 9 DIV, expression of ankyrinG and VGSC were clustered at AIS when WT Flag-nucEGFP was transfected (Figures 5A and 5B, top). In contrast, clustering of ankyrinG and VGSC was disturbed in the presence of extensive α-II (mut)/β-II and α-II (mut)/β-III spectrin aggregation (Figures 5A and 5B, middle and bottom). Interestingly, whole-cell current clamp recordings from cortical neurons expressing mutant α-II spectrins showed impairment of repetitive action potential elicitation and elevated threshold of action potential compared with those expressing the WT (Figure 6A), while there were no significant differences in the passive membrane properties among the genotypes (Table S3). Recordings of whole-cell sodium currents with conventional activation and inactivation protocols revealed that expression of the mutants caused a significant depolarizing shift in activation compared with the WT, indicating increased threshold of sodium currents (Figures 6B and 6C). These mutants did not affect any of the activation kinetic properties (10%–90% rise time) (Figure 6E), the voltage dependence of inactivation (Figures 6F and 6G), or the whole cell capacitance (Table S3). However, peak sodium current densities were substantially reduced in cells expressing dup mut or del mut (Figure 6D). Divergent distribution of VGSC at AIS can increase the action potential threshold probably resulting from the waste of charging current across the axonal membrane;24 therefore, the abnormal spike initiation observed in two mutants could be caused by the disturbance of VGSC clustering at AIS.
Figure 5.
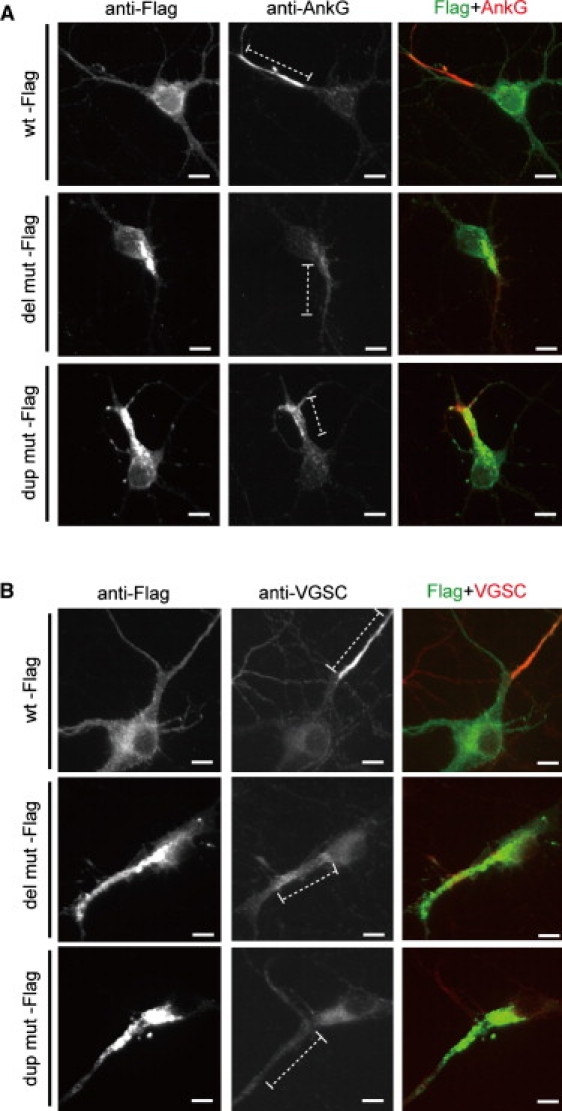
Transient Expression of Mutant α-II Spectrin Led to Disturbance of AnkyrinG and VGSC Clustering at AIS
Expression of ankyrinG (AnkG) (A) and VGSC (B) at 9 DIV. When WT α-II spectrin is expressed, neurons showed clustering of AnkG and VGSC at AIS (top). However, clustering of AnkG and VGSC were disturbed in the presence of extensive α/β spectrin aggregation when mutant α-II spectrins (both the del mut and the dup mut) were expressed (middle and bottom). AIS regions are shown by dashed lines. The scale bars represent 10 μm. The following primary antibodies were used: mouse anti-ankyrinG (1:100 dilution; clone 4G3F8; Santa Cruz Biotechnology, Santa Cruz, CA), mouse anti-pan sodium channel (for VGSC) (1:100 dilution; clone K58/35; Sigma), and rabbit anti-DDDDK-Tag (1:2000 dilution; MBL).
Figure 6.
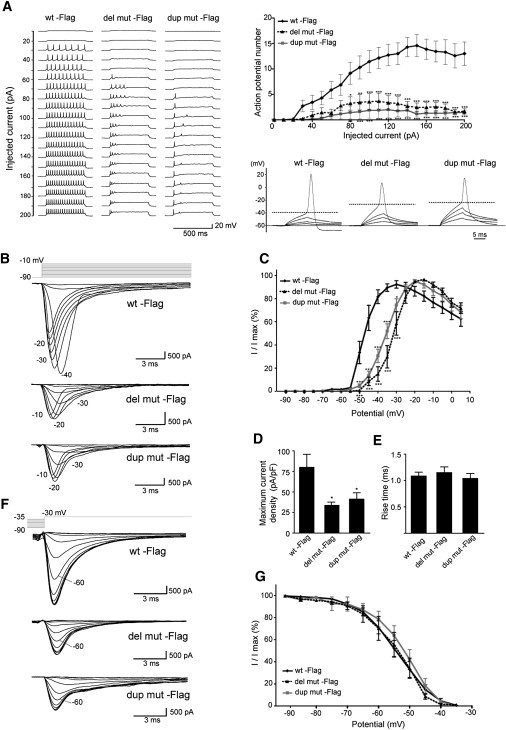
Mutant α-II Spectrin Elevated Action Potential Threshold in Primary Cultured Cortical Neurons
(A) Left, representative sets of action potential traces recorded from cultured cortical neurons expressing either WT or mutant α-II spectrin (del mut or dup mut)-Flag-nucEGFP during 500 ms injection of depolarizing current in +10 pA increments, from a holding potential of −60 mV. Right top, input-output relationship of the number of evoked action potentials versus the injected current (WT, n = 7; del mut, n = 9; dup mut, n = 7). Although there were no significant differences in the passive membrane properties among each genotypes (see Table S3), repetitive action potential elicitation was significantly reduced in the two mutants. Right bottom, representative responses to a series of subthreshold and suprathreshold depolarizing current injections of 10 ms duration. A base holding potential (−60 mV) and an identified action potential threshold are indicated by thin and dashed lines, respectively. Note that mutants elevated action potential threshold compared with the WT (see Table S3).
(B–G) Recordings of whole-cell sodium currents with conventional activation (C–E: WT, n = 11; del mut, n = 10; dup mut, n = 10) and inactivation protocols (G: WT, n = 11; del mut, n = 9; dup mut, n = 10).
(B) Representative sets of sodium current traces recorded from dissociated cortical neurons expressing WT and mutant α-II spectrins.
(C) Voltage dependence of channel activation measured during voltage steps between −90 and +10 mV. Statistical analysis indicated that del mut and dup mut exhibited significant differences in current-voltage relationship compared with the WT. Both mutants displayed a significant depolarizing shift in activation compared with the WT.
(D) Peak current density elicited by test pulses. Statistical analysis indicated a significant reduction in peak current in both mutants compared with the WT.
(E) Activation kinetics assessed by 10%–90% rise time plotted against test potential for WT and mutants. There were no significant differences among WT and the two mutants.
(F) Representative sodium currents in neurons expressing WT or mutant α-II spectrin under influence of 500 ms inactivation prepotentials.
(G) Voltage dependence of inactivation assessed in response to inactivating prepulses between −90 and −35 mV. Statistical analysis revealed no significant differences among WT and mutants (p = 0.96).
Error bars, SEM. ∗p < 0.05, ∗∗p < 0.01, ∗∗∗p < 0.001, as compared to the WT. Most of the recorded parameters are summarized in Table S3.
Discussion
We have shown that two de novo in-frame mutations of SPTAN1 cause early-onset WS with spastic quadriplegia, poor visual attention, and severe developmental delay. Brain MRI of the two subjects showed severe cerebral hypomyelination, decreased white matter, widespread brain atrophy including brainstem, hypoplasia and/or atrophy of the cerebellum, and a thinned and shortened corpus callosum. On the other hand, mutations of STXBP1 cause EIEE, and brain MRI of individuals with STXBP1 mutations showed no structural malformations in contrast with striking structural abnormalities with SPTAN1 mutations.7 Among three subjects harboring SPTAN1 aberrations, subject 1 deleted both SPTAN1 and STXBP1 heterozygously.7 Similar to individuals with STXBP1 mutations, subject 1 had distinctive features of EIEE, such as early onset of spasms, suppression-burst pattern on electroencephalogram, transition to West syndrome, and severe developmental delay.7 Therefore it is likely that haploinsufficiency of STXBP1 caused EIEE and subsequent WS in subject 1. However, subject 1 additionally showed apparent hypomyelination of cerebral cortex and thin corpus callosum at 12 months of age,14 which appeared to be distinct from clinical features caused by STXBP1 mutations. Based on these differences, we hypothesized that another gene within the deletion may contribute to severe hypomyelination, and successfully found two de novo in-frame mutations of SPTAN1 in subject 2 and 3 of group A. Although subject 1 initially showed severe hypomyelination, the myelination showed catch-up completion at 4 years of age. These facts suggest that SPTAN1 hemizygosity may have temporary effects on the myelination. Further reports of microdeletions involving SPTAN1 may give us a clear answer about the contribution of SPTAN1 hemizygosity to hypomyelination. By contrast, subjects 2 and 3 showed more severe phenotypes than subject 1, indicating that the effect of in-frame mutations was dominant negative rather than loss of function. This idea was supported by the fact that the in-frame mutations could cause aggregation of α-II/β-II and α-II/β-III spectrin heterodimers, related to disturbed clustering of ankyrinG and VGSC at AIS. β-II and β-III spectrins have been shown to participate in stabilization of membrane proteins and axonal transport.25,26 Although our study did not detect aggregation of the α-II/β-IV spectrin heterodimer, which is essential for stabilization of membrane proteins at AIS,27,28 defective α-II/β-II and α-II/β-III spectrin heterodimers might affect the stability of membrane proteins at AIS, possibly in combination with disrupting intracellular transport.
The α-II (mut)/β-II spectrin heterodimers was more unstable than the α-II (WT)/β-II heterodimers, which was manifested by CD melting experiments as differences of melting points at relatively high temperature (50°C–60°C and 70°C–80°C). In general, structural instability of proteins would lead to aggregate formation. Immunofluorescence analysis in both transiently transfected primary neuron and LCL derived from two subjects showed aggregation of α-II/β-II and α-II/β-III spectrin heterodimers, suggesting that structual instability of α-II/β-II and α-II/β-III spectrin heterodimers resulted in the aggregation.
We demonstrated a possible link between a mutant submenbranous scaffolding protein and abnormal AIS integrity. It has been suggested that the levels of ion channels at AIS are regulated by altering the cytoskeletal scaffolds.22 A recessive mutation of scaffolding protein CASPR2 causes focal epilepsy.29 Abnormal AIS integrity resulting from mutant α-II spectrin further underscores the importance of AIS scaffolds in the pathogenesis of epilepsy and provides new insights for WS.
Acknowledgments
The authors declare no conflict of interest. We would like to thank all the patients and their families for their participation in this study. We also thank Dr. Jun-ichi Miyazaki for permitting use of CAG promoter and Dr. Sean Megason for the pCIG vector. This work was supported by research grants from the Ministry of Health, Labour, and Welfare (N.M., J.T., and M. Kato), the Japan Science and Technology Agency (N.M.), a Grant-in-Aid for Scientific Research on Priority Areas (Research on Pathomechanisms of Brain disorder) from the Ministry of Education, Culture, Sports, Science, and Technology of Japan (N.M.), a Grant-in-Aid for Scientific Research from Japan Society for the Promotion of Science (N.M. and M. Kato), a Grant-in-Aid for Young Scientist from Japan Society for the Promotion of Science (H.S.), the Research Promotion Fund from Yokohama Foundation for Advancement of Medical Science (H.S.), the Research Promotion Fund from the Uehara Memorial Foundation (H.S.), research grants from the Japan Epilepsy Research Foundation (H.S.), a grant from the 2009 Strategic Research Project of Yokohama City University (H.S.), and a research grant from the Naito Foundation (N.M.). This work has been done at Advanced Medical Research Center, Yokohama City University.
Contributor Information
Hirotomo Saitsu, Email: hsaitsu@yokohama-cu.ac.jp.
Naomichi Matsumoto, Email: naomat@yokohama-cu.ac.jp.
Supplemental Data
Web Resources
The URLs for data presented herein are as follows:
ClustalW, http://align.genome.jp/
GenBank, http://www.ncbi.nlm.nih.gov/Genbank/
Online Mendelian Inheritance in Man (OMIM), http://www.ncbi.nlm.nih.gov/Omim/
Protein Data Bank, http://www.pdb.org/pdb/home/home.do
PyMOL, http://www.pymol.org/
UCSC Genome Browser, http://genome.ucsc.edu/cgi-bin/hgGateway
References
- 1.Kato M. A new paradigm for West syndrome based on molecular and cell biology. Epilepsy Res. 2006;70(Suppl 1):S87–S95. doi: 10.1016/j.eplepsyres.2006.02.008. [DOI] [PubMed] [Google Scholar]
- 2.Bahi-Buisson N., Nectoux J., Rosas-Vargas H., Milh M., Boddaert N., Girard B., Cances C., Ville D., Afenjar A., Rio M. Key clinical features to identify girls with CDKL5 mutations. Brain. 2008;131:2647–2661. doi: 10.1093/brain/awn197. [DOI] [PubMed] [Google Scholar]
- 3.Strømme P., Mangelsdorf M.E., Shaw M.A., Lower K.M., Lewis S.M., Bruyere H., Lütcherath V., Gedeon A.K., Wallace R.H., Scheffer I.E. Mutations in the human ortholog of Aristaless cause X-linked mental retardation and epilepsy. Nat. Genet. 2002;30:441–445. doi: 10.1038/ng862. [DOI] [PubMed] [Google Scholar]
- 4.Kato M., Das S., Petras K., Sawaishi Y., Dobyns W.B. Polyalanine expansion of ARX associated with cryptogenic West syndrome. Neurology. 2003;61:267–276. doi: 10.1212/01.wnl.0000068012.69928.92. [DOI] [PubMed] [Google Scholar]
- 5.Djukic A., Lado F.A., Shinnar S., Moshé S.L. Are early myoclonic encephalopathy (EME) and the Ohtahara syndrome (EIEE) independent of each other? Epilepsy Res. 2006;70(Suppl 1):S68–S76. doi: 10.1016/j.eplepsyres.2005.11.022. [DOI] [PubMed] [Google Scholar]
- 6.Ohtahara S., Yamatogi Y. Ohtahara syndrome: With special reference to its developmental aspects for differentiating from early myoclonic encephalopathy. Epilepsy Res. 2006;70(Suppl 1):S58–S67. doi: 10.1016/j.eplepsyres.2005.11.021. [DOI] [PubMed] [Google Scholar]
- 7.Saitsu H., Kato M., Mizuguchi T., Hamada K., Osaka H., Tohyama J., Uruno K., Kumada S., Nishiyama K., Nishimura A. De novo mutations in the gene encoding STXBP1 (MUNC18-1) cause early infantile epileptic encephalopathy. Nat. Genet. 2008;40:782–788. doi: 10.1038/ng.150. [DOI] [PubMed] [Google Scholar]
- 8.Bennett V., Healy J. Organizing the fluid membrane bilayer: Diseases linked to spectrin and ankyrin. Trends Mol. Med. 2008;14:28–36. doi: 10.1016/j.molmed.2007.11.005. [DOI] [PubMed] [Google Scholar]
- 9.Bennett V., Baines A.J. Spectrin and ankyrin-based pathways: Metazoan inventions for integrating cells into tissues. Physiol. Rev. 2001;81:1353–1392. doi: 10.1152/physrev.2001.81.3.1353. [DOI] [PubMed] [Google Scholar]
- 10.Ikeda Y., Dick K.A., Weatherspoon M.R., Gincel D., Armbrust K.R., Dalton J.C., Stevanin G., Dürr A., Zühlke C., Bürk K. Spectrin mutations cause spinocerebellar ataxia type 5. Nat. Genet. 2006;38:184–190. doi: 10.1038/ng1728. [DOI] [PubMed] [Google Scholar]
- 11.Perrotta S., Gallagher P.G., Mohandas N. Hereditary spherocytosis. Lancet. 2008;372:1411–1426. doi: 10.1016/S0140-6736(08)61588-3. [DOI] [PubMed] [Google Scholar]
- 12.Meary F., Metral S., Ferreira C., Eladari D., Colin Y., Lecomte M.-C., Nicolas G. A mutant alphaII-spectrin designed to resist calpain and caspase cleavage questions the functional importance of this process in vivo. J. Biol. Chem. 2007;282:14226–14237. doi: 10.1074/jbc.M700028200. [DOI] [PubMed] [Google Scholar]
- 13.Voas M.G., Lyons D.A., Naylor S.G., Arana N., Rasband M.N., Talbot W.S. alphaII-spectrin is essential for assembly of the nodes of Ranvier in myelinated axons. Curr. Biol. 2007;17:562–568. doi: 10.1016/j.cub.2007.01.071. [DOI] [PubMed] [Google Scholar]
- 14.Tohyama J., Akasaka N., Osaka H., Maegaki Y., Kato M., Saito N., Yamashita S., Ohno K. Early onset West syndrome with cerebral hypomyelination and reduced cerebral white matter. Brain Dev. 2008;30:349–355. doi: 10.1016/j.braindev.2007.10.006. [DOI] [PubMed] [Google Scholar]
- 15.Megason S.G., McMahon A.P. A mitogen gradient of dorsal midline Wnts organizes growth in the CNS. Development. 2002;129:2087–2098. doi: 10.1242/dev.129.9.2087. [DOI] [PubMed] [Google Scholar]
- 16.Niwa H., Yamamura K., Miyazaki J. Efficient selection for high-expression transfectants with a novel eukaryotic vector. Gene. 1991;108:193–199. doi: 10.1016/0378-1119(91)90434-d. [DOI] [PubMed] [Google Scholar]
- 17.Kelley L.A., Sternberg M.J. Protein structure prediction on the Web: A case study using the Phyre server. Nat. Protoc. 2009;4:363–371. doi: 10.1038/nprot.2009.2. [DOI] [PubMed] [Google Scholar]
- 18.Kusunoki H., Minasov G., Macdonald R.I., Mondragón A. Independent movement, dimerization and stability of tandem repeats of chicken brain α-spectrin. J. Mol. Biol. 2004;344:495–511. doi: 10.1016/j.jmb.2004.09.019. [DOI] [PubMed] [Google Scholar]
- 19.Speicher D.W., Weglarz L., DeSilva T.M. Properties of human red cell spectrin heterodimer (side-to-side) assembly and identification of an essential nucleation site. J. Biol. Chem. 1992;267:14775–14782. [PubMed] [Google Scholar]
- 20.Riederer B.M., Zagon I.S., Goodman S.R. Brain spectrin(240/235) and brain spectrin(240/235E): Two distinct spectrin subtypes with different locations within mammalian neural cells. J. Cell Biol. 1986;102:2088–2097. doi: 10.1083/jcb.102.6.2088. [DOI] [PMC free article] [PubMed] [Google Scholar]
- 21.Xu J., Ziemnicka D., Scalia J., Kotula L. Monoclonal antibodies to alphaI spectrin Src homology 3 domain associate with macropinocytic vesicles in nonerythroid cells. Brain Res. 2001;898:171–177. doi: 10.1016/s0006-8993(01)02156-4. [DOI] [PMC free article] [PubMed] [Google Scholar]
- 22.Ogawa Y., Rasband M.N. The functional organization and assembly of the axon initial segment. Curr. Opin. Neurobiol. 2008;18:307–313. doi: 10.1016/j.conb.2008.08.008. [DOI] [PubMed] [Google Scholar]
- 23.Lai H.C., Jan L.Y. The distribution and targeting of neuronal voltage-gated ion channels. Nat. Rev. Neurosci. 2006;7:548–562. doi: 10.1038/nrn1938. [DOI] [PubMed] [Google Scholar]
- 24.Kuba H., Ishii T.M., Ohmori H. Axonal site of spike initiation enhances auditory coincidence detection. Nature. 2006;444:1069–1072. doi: 10.1038/nature05347. [DOI] [PubMed] [Google Scholar]
- 25.Muresan V., Stankewich M.C., Steffen W., Morrow J.S., Holzbaur E.L., Schnapp B.J. Dynactin-dependent, dynein-driven vesicle transport in the absence of membrane proteins: a role for spectrin and acidic phospholipids. Mol. Cell. 2001;7:173–183. doi: 10.1016/s1097-2765(01)00165-4. [DOI] [PubMed] [Google Scholar]
- 26.Kizhatil K., Yoon W., Mohler P.J., Davis L.H., Hoffman J.A., Bennett V. Ankyrin-G and β2-spectrin collaborate in biogenesis of lateral membrane of human bronchial epithelial cells. J. Biol. Chem. 2007;282:2029–2037. doi: 10.1074/jbc.M608921200. [DOI] [PubMed] [Google Scholar]
- 27.Komada M., Soriano P. [β]IV-spectrin regulates sodium channel clustering through ankyrin-G at axon initial segments and nodes of Ranvier. J. Cell Biol. 2002;156:337–348. doi: 10.1083/jcb.200110003. [DOI] [PMC free article] [PubMed] [Google Scholar]
- 28.Parkinson N.J., Olsson C.L., Hallows J.L., McKee-Johnson J., Keogh B.P., Noben-Trauth K., Kujawa S.G., Tempel B.L. Mutant β-spectrin 4 causes auditory and motor neuropathies in quivering mice. Nat. Genet. 2001;29:61–65. doi: 10.1038/ng710. [DOI] [PubMed] [Google Scholar]
- 29.Strauss K.A., Puffenberger E.G., Huentelman M.J., Gottlieb S., Dobrin S.E., Parod J.M., Stephan D.A., Morton D.H. Recessive symptomatic focal epilepsy and mutant contactin-associated protein-like 2. N. Engl. J. Med. 2006;354:1370–1377. doi: 10.1056/NEJMoa052773. [DOI] [PubMed] [Google Scholar]
Associated Data
This section collects any data citations, data availability statements, or supplementary materials included in this article.