

Abstract

Three-way multibranch loops (junctions) are common in RNA secondary structures. Computer algorithms such as RNAstructure and MFOLD do not consider the identity of unpaired nucleotides in multibranch loops when predicting secondary structure. There is limited experimental data, however, to parametrize this aspect of these algorithms. In this study, UV optical melting and a fluorescence competition assay are used to measure stabilities of multibranch loops containing up to five unpaired adenosines or uridines or a loop E motif. These results provide a test of our understanding of the factors affecting multibranch loop stability and provide revised parameters for predicting stability. The results should help to improve predictions of RNA secondary structure.
RNA multibranch loops (junctions) are ubiquitous in known RNA secondary structures, including tRNA (1), rRNA (2,3), the HIV-1 genome (4), and ribozymes (5). They can be characterized by the number of helices forming the loop, the number of unpaired nucleotides located in the junction, the base pairs closing the junction, and other factors. Despite the prevalence, the factors that determine the stabilities of RNA multibranch loops are poorly understood. Research on DNA multibranch loops sheds some light onto factors that are likely to be important for RNA multibranch loops. The dependence of structure on the number and type of unpaired nucleotides in DNA multibranch loops has been studied extensively for loops of three, four, and five helices (6−11). DNA multibranch loops with unpaired purines in the junction have different stacking conformations than similar loops containing unpaired pyrimidines (6,7). Furthermore, the effects of unpaired nucleotides on the stability of the junction are dependent on the number of helices forming the junction (8). The presence of two unpaired nucleotides allows formation of a stable DNA three-way junction in which two of the helices coaxially stack, but unpaired nucleotides are not required to stabilize a four-way DNA junction (8−11).
Approaches to estimate the free energy change of forming an RNA multibranch loop include (1) optimizing the prediction of known RNA secondary structures (12), (2) fitting experimental results (13−15), and (3) using a combination of these approaches (16). Knowledge-based statistical methods (17−19) could also be used. Coaxial stacking of helixes is observed in RNA multibranch loops (1,20−29) and can often be predicted on the basis of thermodynamics (30). RNA secondary structure prediction algorithms, such as MFOLD (12) and RNAstructure (15), use a simple model to predict multibranch loop stability (12,15). A more thorough understanding of factors contributing to RNA multibranch loop stability should improve the model used to predict stability and therefore the ability to accurately predict RNA secondary structure from sequence. The number of known RNA sequences is rapidly increasing, and it is important to understand structure−function relationships for RNA. Accurate prediction of secondary structure will accelerate discovery of these relationships and may help in assigning functions to RNA motifs and to new RNAs.
This study uses a two-strand system modified from previous experiments (14) to measure by optical melting (31) and fluorescence competition assays (FCA) the influence of the number and the type of unpaired nucleotides on the stability of RNA three-way multibranch loops. A common motif in rRNAs, the loop E motif (3), was included in the investigation. Competition binding experiments with gel electrophoresis were used to determine the relative stabilities of DNA multibranch loops (8,32). FCA has been used to study nucleic acid thermodynamics, including stabilities of DNA duplexes (33) and of RNA pseudoknots (34).
Materials and Methods
Materials
Oligonucleotides 5′CCGUCaCCUGC3′, 5′CCGUCa2CCUGC3′, 5′CCGUCuCCUGC3′, and 5′CCGUCu2CCUGC3′ were synthesized on an Applied Biosystem 392 DNA/RNA synthesizer with phosphoramidite A from Glen Research and phosphoramidites G, C, and U from Proligo, Inc. Strands were treated and purified as previously described (14). Purity of products was checked by 20% polyacrylamide gel electrophoresis with 5′ end γ-ATP labeling. All other oligonucleotides were purchased from Integrated DNA Technologies, Inc. (IDT), which purified them by HPLC and tested molecular weights by mass spectroscopy. Fluorescent oligonucleotides had fluorescein attached by a linker of six carbons (6-FAM). The single strand oligonucleotides’ concentrations were calculated from 80 °C absorbance and single-strand extinction coefficients by a nearest-neighbor model (35,36).
UV Melting of Duplexes
Optical melting was performed in standard melting buffer: 1.0 M NaCl, 20 mM sodium cacodylate, and 0.5 mM Na2EDTA, pH 7.0. For each sample melted, equal molar amounts of the two strands in doubly distilled water were mixed, dried in spin vacuum, and then dissolved in standard melting buffer. The sample was annealed at 80 °C for 2 min and cooled to 20 °C at a rate of ∼5 °C/min. Absorbance versus temperature melting curves were measured at 280 nm with a heating rate of 1 °C/min on a Beckman Coulter DU 640 spectrophotometer controlled by a Beckman Coulter high-performance temperature controller cooled with water flow at 25 °C. Duplexes were melted over a 60-fold range in oligonucleotide concentration. Data were analyzed by fitting the transition to a two-state model with sloping baselines using a nonlinear least-squares program (37,38).
Fluorescence Competition Assay (FCA)
The equilibrium for the fluorescence competition assay is illustrated in Figure 1A. A reference structure was formed by a long strand and fluorescein-labeled short strand at 1:1 molar ratio in standard melting buffer. The initial concentration of duplex, G_CG_G/(F)Ca2C (see Table 1 for nomenclature), was 30 μM, and that of CgaaaCGaG/(F)CcaguaG (Table 1) was 1 μM, so that the strands are completely in duplex. The complex was titrated with a solution containing nonfluorescent short strand at high concentration and long strand and fluorescein-labeled short strand at their initial concentrations. For each titration point, the solution was annealed for 3 min at 75 °C in a water bath and then equilibrated at 37 °C for at least 15 min in a 4 × 4 mm quartz cuvette in a HORIBA Jobin Yvon Fluorolog-3 spectrofluorometer. To check for equilibrium, fluorescence intensity was measured for 1 min at intervals of 5 min. If no change within error was observed between two measurements, then the average over the last 1 min was taken as the fluorescence intensity of the titration point. Fluorescence was excited at 494 nm with a 1 nm band-pass, and emission was measured at the peak of the emission, 520 nm, with a 0.5 nm band-pass. The fluorescence intensities of the single strand fluorescent oligonucleotides, 5′FCCGUCa2CCUGC3′ (i.e., “(F)Ca2C”) at 30 μM and 5′FCCGUCcaguaGCUGC3′ (i.e., “(F)CcaguaC”) at 1 μM, were measured to provide the fluorescence intensity at saturation when they were completely displaced by the nonfluorescent oligonucleotide. Successive scans of the samples with only “(F)Ca2C” or “(F)CcaguaC” resulted in minimal change in the fluorescence intensity, indicating photobleaching was negligible.
Figure 1.

(A) Illustration of fluorescence competition assay to measure the free energy of multibranch loop formation. As the competitor strand, C, is titrated into the solution of “reference” structure, RS, the competitor strand will substitute the fluorescein-labeled short strand in the “reference” structure to form the new multibranch loop, MBL. The fluorescein-labeled short strand, FS, is freed from the “reference” structure, and the fluorescence intensity of the solution changes. (B) Typical titration curve and fitting for FCA. Here the system is G_CG_G/Ca3C (Table 1). The “reference” structure concentration is 30 μM before titration, and the competitor strand is 400 μM in the titration solution.
Table 1. Nomenclature for Three-Way Multibranch Loop Systems Studied.
| group | long stranda | short stranda | name |
|---|---|---|---|
| 1 | 5′GCAGG_CGGCUUCGGCCG_GACGG3′ | 5′FCCGUCa2CCUGC3′ | G_CG_G/(F)Ca2C |
| 5′CCGUC_CCUGC3′ | G_CG_G/C_C | ||
| 5′CCGUCaCCUGC3′ | G_CG_G/CaC | ||
| 5′CCGUCa2CCUGC3′ | G_CG_G/Ca2C | ||
| 5′CCGUCa3CCUGC3′ | G_CG_G/Ca3C | ||
| 5′CCGUCa4CCUGC3′ | G_CG_G/Ca4C | ||
| 5′CCGUCa5CCUGC3′ | G_CG_G/Ca5C | ||
| 5′CCGUCuCCUGC3′ | G_CG_G/CuC | ||
| 5′CCGUCu2CCUGC3′ | G_CG_G/Cu2C | ||
| 5′CCGUCu3CCUGC3′ | G_CG_G/Cu3C | ||
| 5′CCGUCu4CCUGC3′ | G_CG_G/Cu4C | ||
| 5′CCGUCu5CCUGC3′ | G_CG_G/Cu5C | ||
| 2 | 5′GCAGCgaaaCGGCUUCGGCCGaGACGG3′ | 5′FCCGUCcaguaGCUGC3′ | CgaaaCGaG/(F)CcaguaG |
| 5′CCGUCcaguaGCUGC3′ | CgaaaCGaG/CcaguaG | ||
| 5′CCGUCcagaGCUGC3′ | CgaaaCGaG/CcagaG |
Nucleotides in the junction are in lower case. An underscore indicates a helix−helix interface without unpaired nucleotides.
Calculating Multibranch Loop Stability from FCA Data
Below is the derivation of the equation for fluorescence intensity as a function of solution composition for FCA titrations.
Relative to fluorescein, the fluorescence from nucleotides can be neglected. The fluorescence comes from fluorescein in the free fluorescent single strand (FS) or “reference” structure (RS). So, the fluorescence intensity, F, is
Here, fFS and fRS are the fluorescence efficiencies for the free fluorescent single strand and “reference” structure, respectively, [FS] is the concentration of free fluorescein single strand, and [RS] is the concentration of “reference” structure. The total concentration of fluorophore is
 |
From eqs 1 and 2
 |
As the competition strand was titrated into the solution, some fluorescent short strands in the “reference” structures would be substituted by the nonfluorescent competition strand to form a nonfluorescent multibranch loop (MBL). In the solution, the competition strand is present as free competition strand ([C] for concentration) and as part of newly formed multibranch loop ([MBL] for the concentration), so
The long strand RNA could be in different forms: “reference” structure, new multibranch loop, and unimolecular hairpin form ([H] for hairpin concentration). So, the total concentration of long strand RNA ([LS]T for its concentration) can be expressed as
The experiments are performed under conditions in which [H] is negligible compared to [RS] + [MBL]. Also, the [LS]T equals [FS]T because the long strand and the fluorescent short strand were mixed in a ratio of 1:1 to form the “reference” structure. Therefore, eq 5 can be approximated as
The equilibrium constant, KMBL, for the multibranch loop formation can be written as
Rearrange the equation, substitute [C] by eq 4b, and then substitute [MBL] by eq 6
 |
The equilibrium constant, KRS, for the “reference” structure can be written as
Rearrange the equation and substitute [FS] by eq 2b
Equation 11 can be rewritten as
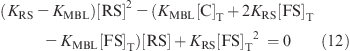 |
Solving for [RS] gives
 |
Because [RS] cannot be larger than [FS]T or less than 0, the only valid solution is
 |
Substituting [RS] in eq 3 by eq 14, the fluorescence intensity can be expressed as
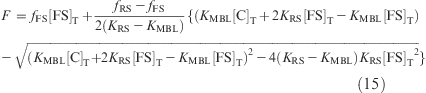 |
The value of fFS can be measured from the solution of free fluorescent single strand, fRS can be known from the “reference” structure solution, and [C]T and [FS]T are the concentrations added, so the titration curve was fit to KMBL by the Newton−Gaussian method as implemented in Statistical Analysis System (SAS) from SAS Institute Inc.
Fitting Experimental Data into Energetic Models
Previously published data (13,14) and results reported here for group 1 systems (see below) were fit to energetic models by linear regression analysis as implemented in the R Project for Statistical Computing (http://www.r-project.org). Only systems with ΔH°’s that differed by <30% when determined by 1/TM vs ln(CT/4) analysis and by fitting melting curves were used in the linear regression. The systems excluded from previous regression analysis (13) were also excluded from the linear regression here as were the group 2 sequences listed in Table 1 (see Supporting Information). The data from 1/TM vs ln(CT/4) analysis were used for linear regression as previously (13), except the FCA ΔG°37 was used for system G_CG_G/C_C because the optical melts were not two state (Tables 1 and 2). The p-value of the F test was used as a criterion for judging the correlation of a term to a model. If the p-value is less than 0.10, then the corresponding term is considered highly correlated to the model.
Table 2. Thermodynamics for Duplex Formation Creating a Multibranch Loop from Long Hairpin Strand and Unstructured Short Strand, As Determined by Fluorescence Competition Assay and Optical Melting, in 1 M NaCl, 20 mM Sodium Cacodylate, and 0.5 mM Na2EDTA, pH 7.
| FCAa | 1/TM vs ln(CT/4) |
average of melt curve fits |
|||||||
|---|---|---|---|---|---|---|---|---|---|
| system | −ΔG°37 (kcal/mol) | −ΔG°37 (kcal/mol) | −ΔH° (kcal/mol) | −ΔS° (eu) | TM (°C) | −ΔG°37 (kcal/mol) | −ΔH° (kcal/mol) | −ΔS° (eu) | TM (°C) |
| G_CG_G/(F)Ca2C | 11.34 ± 0.23 | 91.60 ± 4.84 | 258.78 ± 14.92 | 54.2 | 11.25 ± 0.52 | 88.48 ± 11.31 | 249.00 ± 34.93 | 54.5 | |
| G_CG_G/C_C | 8.89 | (8.37 ± 0.13) | (49.69 ± 3.71) | (133.23 ± 11.75) | (48.9) | (9.00 ± 0.72) | (75.65 ± 17.07) | (214.88 ± 53.00) | (47.5) |
| G_CG_G/CaC | 9.46 | 9.15 ± 0.25 | 73.07 ± 6.84 | 206.08 ± 21.49 | 48.5 | 9.06 ± 0.48 | 71.53 ± 14.68 | 201.42 ± 45.91 | 48.3 |
| G_CG_G/Ca2C | 10.86 | 10.50 ± 0.16 | 84.13 ± 4.03 | 237.39 ± 12.50 | 52.4 | 10.51 ± 0.25 | 83.73 ± 6.25 | 236.10 ± 19.39 | 52.5 |
| G_CG_G/Ca3C | 10.89 | 11.09 ± 0.25 | 85.90 ± 5.46 | 241.18 ± 16.82 | 54.4 | 11.39 ± 0.61 | 92.54 ± 12.01 | 261.65 ± 36.97 | 54.2 |
| G_CG_G/Ca4C | 11.28 ± 0.13 | 87.23 ± 3.00 | 244.90 ± 9.26 | 54.9 | 11.67 ± 0.98 | 93.46 ± 23.95 | 263.71 ± 74.11 | 55.1 | |
| G_CG_G/Ca5C | 11.71 ± 0.26 | 97.11 ± 5.74 | 275.35 ± 17.71 | 54.5 | 12.04 ± 0.42 | 104.70 ± 7.76 | 298.76 ± 23.74 | 54.2 | |
| G_CG_G/CuC | 9.08 | 8.44 ± 0.12 | 74.26 ± 5.23 | 212.24 ± 16.63 | 45.2 | 8.35 ± 0.17 | 76.17 ± 14.45 | 218.66 ± 46.58 | 44.6 |
| G_CG_G/Cu2C | 10.72 | 10.54 ± 0.30 | 77.63 ± 7.54 | 216.30 ± 23.49 | 53.9 | 10.71 ± 0.30 | 83.28 ± 8.22 | 233.97 ± 25.64 | 53.4 |
| G_CG_G/Cu3C | 11.07 | 11.16 ± 0.26 | 88.97 ± 5.75 | 250.87 ± 17.72 | 54.0 | 11.55 ± 0.54 | 97.67 ± 11.90 | 277.67 ± 36.78 | 53.8 |
| G_CG_G/Cu4C | 11.51 ± 0.14 | 94.10 ± 3.10 | 266.28 ± 9.55 | 54.3 | 11.71 ± 0.64 | 98.43 ± 14.03 | 279.61 ± 53.25 | 54.2 | |
| G_CG_G/Cu5C | 11.06 ± 0.18 | 89.64 ± 4.34 | 253.35 ± 13.45 | 53.5 | 11.31 ± 0.64 | 96.22 ± 15.42 | 273.77 ± 47.73 | 53.2 | |
| CgaaaCGaG/(F)CcaguaG | 13.08 ± 0.29 | 102.63 ± 5.15 | 288.74 ± 15.70 | 58.1 | 12.50 ± 0.43 | 91.24 ± 8.69 | 253.86 ± 26.70 | 58.7 | |
| CgaaaCGaG/CcaguaG | 12.24 | 12.46 ± 0.40 | 97.56 ± 7.48 | 274.40 ± 22.87 | 57.1 | 12.23 ± 0.79 | 91.43 ± 13.73 | 255.38 ± 41.77 | 57.6 |
| CgaaaCGaG/CcagaG | 11.05 | 11.27 ± 0.29 | 84.16 ± 5.50 | 235.04 ± 16.89 | 55.5 | 11.24 ± 0.95 | 81.94 ± 18.98 | 227.98 ± 58.18 | 55.9 |
The errors of FCA are from estimating free energies of reference structures because errors from fitting titration curves are small. The errors are ±0.23 and ±0.29 for systems in groups 1 and 2, respectively, which are errors for ΔG°37 of the reference structures from 1/TM vs ln(CT/4) analysis.
Results
Design of the System
Systems studied here are divided into two groups (Table 1 and Figure 2). Group 1 provides insight into the influence of number and type of unpaired nucleotides on the stabilities of RNA three-way multibranch loops (Figure 1A,B). Group 2 provides insight into the thermodynamics of the loop E motif in multibranch loops (Figure 1C,D). The systems studied here (Figure 1) are based on the two-strand system used previously to study free energy increments of RNA multibranch loops (13,14). The long strand can fold into a hairpin, which is similar to the hairpin component in the multibranch loop (Figure 3) and which has a melting temperature greater than 70 °C (14). The short strands are predicted to have no self-structures by RNAstructure (15). Each intermolecular helix formed by association of the two strands contains five base pairs, rather than the four used initially (14). This increased the cooperativity of the melts so the melting is more likely to be a two-state transition. The extra stability imparted by the two additional GC pairs also increased the equilibrium constant. This allows the fluorescence competition assays to be performed at 37 °C because less than 2% of the long strand was ever single strand at the oligonucleotide concentrations used in these experiments.
Figure 2.

Sequence design. Group 1 is designed to study the influence of the number and type of unpaired nucleotides on multibranch loop stability. (A) “Reference” structure for fluorescence competition assay to analyze the free energy of systems in group 1. (B) Secondary structures of systems studied. Group 2 is designed to investigate the stability of a loop E motif (5′GAA/3′AUGA) in a multibranch loop. (C) “Reference” structure for fluorescence competition assay to analyze the free energy of systems in group 2. The noncanonical base pairing and some tertiary interactions in the loop E motif are shown (78). (D) A variant of loop E motif in multibranch loop.
Figure 3.

Optical melting of three-way multibranch loops G_CG_G/CaC at 44.5 μM (black squares), G_CG_G/Ca2C at 25.0 μM (red diamond), and CgaaaCGaG/CcaguaG at 23.5 μM (green triangle).
In each group of systems, the short strands (Table 1) are interchangeable without affecting the helices. Therefore, only a single short strand is required to be fluorescently labeled to form a reference structure with the long strand (Figure 2A,C) for the FCA. By competition, the effect of changing the nucleotide sequence on the short strand in the junction could always be compared to the same reference structure. Therefore, the free energy changes at 37 °C could be determined by FCA and compared with that determined by optical melting.
In group 1 systems, unpaired nucleotides were added between the right- and left-hand helices. The predicted preferred stacking arrangement of helixes is the same for all of the systems studied; viz., the left-hand helix stacks on the hairpin stem. Therefore, differences in coaxial stacking of helixes do not have to be considered as more nucleotides are added. The number of unpaired nucleotides was systematically changed from one to five adenosines or uridines to search for trends associated with number and type of unpaired nucleotide. Unpaired G’s and C’s were not used because secondary structure predictions indicated that such constructs would have a large number of stable structures.
Group 2 systems (Table 1 and Figure 2C,D) provide thermodynamic properties for the loop E motif (nucleotides in green in the dashed box in Figure 2C) and a variation in a three-way multibranch loop. Besides the loop E motif, three other nucleotides (A9, A22, and C33) were included in the junction so the system has enough flexibility to keep the loop E motif in its native conformation. Actually, 5′gaaa/3′augac (Figure 2C, nucleotides in green) is common in rRNA (3). For a comparison, system CgaaaCGaG/CcagaG in which U36 was deleted from system CgaaaCGaG/CcaguaG was measured. Because U36 forms a trans-Hoogsteen base pair with A7 and a hydrogen bond to the G6 ribose, the loop E motif is broken. In group 2, the right-hand strand and the hairpin strand (Figure 2C) are predicted to coaxially stack onto each other with an intervening noncanonical pair, and the loop E motif will stack onto the left helix.
Thermodynamics Determined by Optical Melting
As predicted with RNAstructure (15), absorbance detected melts of the individual short strands in Table 1 revealed no self-structure. Melts of the long strand (Table 1) also revealed no self-structure other than that of the hairpin, which melted at temperatures above 70 °C. The inter- and intramolecular transitions are sufficiently separate that the intermolecular transition can be analyzed independently from the hairpin transition. Typical melting curves for systems G_CG_G/CaC, G_CG_G/Ca2C, and CgaaaCGaG/CcaguaG are shown in Figure 3. The results of the melts are presented in Table 2. Except for system G_CG_G/C_C, which contains no unpaired nucleotides, the enthalpy changes determined by the average of the melts’ curve fits were within 15% of those determined by the TM−1 vs ln(CT/4) fits. This is consistent with the two-state model. For system G_CG_G/C_C, there is little predicted difference in the free energies of coaxial stacking for all three possible arrangements. This may account for the non-two-state behavior.
TM−1 vs ln(CT/4) analysis of the melts of systems G_CG_G/(F)Ca2C and CgaaaCGaG/(F)CcaguaG revealed 0.84 and 0.62 kcal/mol more favorable free energy difference relative to that of system G_CG_G/Ca2C and CgaaaCGaG/CcaguaG, respectively (Table 2). The free energy increments for 5′ fluorescein linking to 5′C/G3′ from these two measurements agree with each other and with our previous result, 0.82 kcal/mol (34), within experimental error. The presence of 5′ fluorescein does not perturb the RNA structure (34). Therefore, it was assumed that this enhancement in stability is due to the free energy bonus of a stacked fluorescein on a 5′ C in a CG pair and/or a decrease in the number of conformations available to the single strand due to volume exclusion.
The free energies listed in Table 2 are for the association of a long strand containing a hairpin and a short strand to form a multibranch loop, ΔG°37,bimol. From TM−1 vs ln(CT/4) analysis, in systems nm in group 1 (Table 1 and Figures 1A and 2B) as m = 2, 3, or 4, ΔG°37,bimol’s for A or U are the same within experimental error. As m = 1 or 5, ΔG°37,bimol’s for G_CG_G/CamC are more favorable by about 0.7 kcal/mol than that for G_CG_G/CumC. As unpaired nucleotides increase, systems G_CG_G/CamC get more stable or stay the same within experimental error, and systems G_CG_G/CumC have the same trend except for system G_CG_G/Cu5C, which is 0.45 kcal/mol less stable than G_CG_G/Cu4C.
Fluorescence Competition Assays
A typical FCA titration curve is shown in Figure 1B. Systems G_CG_G/(F)Ca2C and CgaaaCGaG/(F)CcaguaG (Figure 2A.C) are the reference structures for systems in groups 1 and 2, respectively. Their ΔG°37’s determined by optical melting were used as the standard for analysis of FCA for systems in each group. Upon titration with competing strand, the fluorescence increased roughly 1−2-fold as the fluorescein-labeled strand was released from the multibranch loop.
The results of competition assays are listed in Table 2. When all sources of experimental error are considered, the free energy changes at 37 °C measured by fluorescence competition assays and by optical melting are within experimental error.
Free Energy Increments for Multibranch Loops
Optical melting experiments measure the thermodynamics for dissociation of multibranch loops (Figure 4). The fluorescence competition assay here relies on the optical melting of reference structures. The free energy increment for the multibranch loop, ΔG°37,MBL, can be determined with a nearest-neighbor model as previously described (13,14):
Here, ΔG°37,helix’s are for forming the base pairs in the two helices, ΔG°37,bimol init is the penalty for bimolecular initiation, and ΔG°37,prod mm is for possible stacking of mismatches formed on the helix in the product hairpin strand (Figure 4). Previously (13), ΔG°37,prod mm was assumed to include only the increment for the first terminal mismatch of the product hairpin (Figure 4, dashed box). More recent experiments revealed that up to the second and third 3′ dangling ends (Figure 4, dashed and dark box) may affect the stability of RNA helices (39−41). Counting these dangling ends may change ΔG°37,prod mm and therefore the reported ΔG°37,MBL13,14. For example, in ref (13), as the three-way multibranch loop systems melt, the newly formed hairpin 5′GGCAG_GCGCUUCGGCGC_GGAGG3′ has a string of purines dangling at the 3′ end. The new parameters (39) predict the second and third dangling purines will make the hairpin 0.8 kcal/mol more favorable than the previous prediction (13). For the three-way multibranch loop system, GaCG_G/CauaC in ref (14), the hairpin has a dangling end of 5′GCA3′, which leads to a 0.6 kcal/mol more favorable folding (39) than assumed previously. These effects were used to recalculate ΔG°37,MBL from previously published experiments (see Supporting Information). For four-way multibranch loops measured previously (13), the newly formed hairpins will stack onto each other so the dangling ends do not stabilize the long strand product. Some minor calculation errors for four-way multibranch loops were corrected, however (see Supporting Information).
Figure 4.

Diagram of multibranch loop dissociation in melting. As the multibranch loop dissociates, the newly released nucleotides from the left and right helices stack onto the hairpin stem, so that the first mismatch and second and third 3′ dangling nucleotides stabilize the hairpin.
Free Energy Increments for Multibranch Loop Initiation
ΔG°37,MBL was modeled to be the sum of the initiation penalty for multibranch loop formation, ΔG°37,MBL init, and the favorable interactions in the multibranch loop, ΔG°37,MBL stacking, which include the dangling ends, coaxial stacking, and mismatches in the multibranch loop (13,14):
For systems in group 1, the calculations are simplified by the fact that all systems are predicted to stack the left helix on the hairpin stem (Figures 1 and 2B). For systems in group 2, the right helix is predicted to stack on the hairpin helix with an intervening AC pair between two GC pairs closing the multibranch loop (Figure 2C,D). The coaxial stacking can be decomposed into two nearest neighbors (12,42,43):
Unlike the dangling ends in the hairpin product, which are unconstrained, the unpaired regions in multibranch loops are fixed at both ends and fit into limited space. Two multibranch loops with equal numbers and distributions of unpaired nucleotides could be in different conformations (see Supporting Information). Also, noncanonical interactions are common in and with multibranch loops but are hard to predict. Examination of three-way multibranch loops in 3D structures reveals that usually only the first dangling end stacks on the closing base pair (see Supporting Information). Therefore, only single dangling end stacking is included in eq 17 as stabilizing the multibranch loop. This is consistent with the previous model (13,14).
ΔG°37,MBL, ΔG°37,MBL stacking, and ΔG°37,MBL init are listed in Table 3 as derived from TM−1 vs ln(CT/4) plots of optical melting data, from fluorescence competition assays, and from nearest-neighbor parameters. For most cases, ΔG°37,MBL and ΔG°37,MBL init become more favorable or do not change within experimental error as the number of unpaired nucleotides increases. ΔG°37,MBL’s for the same number of unpaired adenosines or uridines are the same, and so are the ΔG°37,MBL init’s. The results for ΔG°37,MBL init are plotted in Figure 5.
Table 3. Free Energies for Three-Way Multibranch Loopsa.
| predicted ΔG°37,MBL init (kcal/mol) |
|||||
|---|---|---|---|---|---|
| system | ΔG°37,MBL (kcal/mol) | ΔG°37,MBL stackingb (kcal/mol) | ΔG°37,MBL init (kcal/mol) | eq 24c | eq 25d |
| G_CG_G/C_C | 6.42 (5.90) | −3.42 | 9.84 (9.32) | 9.87 | 10.00 |
| G_CG_G/CaC | 5.64 (5.33) | −5.12 | 10.76 (10.45) | 10.36 | 10.28 |
| G_CG_G/Ca2C | 4.29 (3.93) | −5.12 | 9.41 (9.05) | 8.14 | 8.60 |
| G_CG_G/Ca3C | 3.70 (3.90) | −5.12 | 8.82 (9.02) | 8.63 | 8.88 |
| G_CG_G/Ca4C | 3.51 | −5.12 | 8.63 | 8.52 | 8.60 |
| G_CG_G/Ca5C | 3.08 | −5.12 | 8.20 | 8.41 | 8.32 |
| G_CG_G/CuC | 6.35 (5.71) | −4.62 | 10.97 (10.33) | 10.36 | 10.28 |
| G_CG_G/Cu2C | 4.25 (4.07) | −4.62 | 8.87 (8.69) | 8.14 | 8.60 |
| G_CG_G/Cu3C | 3.63 (3.72) | −4.62 | 8.25 (8.34) | 8.63 | 8.88 |
| G_CG_G/Cu4C | 3.28 | −4.62 | 7.90 | 8.52 | 8.60 |
| G_CG_G/Cu5C | 3.73 | −4.62 | 8.35 | 8.41 | 8.32 |
| CgaaaCGaG/CcaguaG | 2.79 (3.01) | −4.46 | 7.25 (7.47) | 7.86 | 6.92 |
| CgaaaCGaG/CcagaG | 3.98 (4.20) | −4.46 | 8.44 (8.66) | 7.97 | 7.20 |
Values of ΔG°37,MBL and ΔG°37,MBL init not in parentheses were calculated from free energy changes determined from TM−1 vs ln(CT/4) plots of optical melting data. Values in parentheses were calculated from free energy changes determined by fluorescence competition assay. Equations 16 and 17, respectively, were used to calculate ΔG°37,MBL and ΔG°37,MBL init.
Single nucleotide dangling end or noncanonical pair was considered, and parameters are from ref (42). For systems with am or um loops (group 1), the left helix and hairpin strand (Figure 2A) are predicted to stack on each other, with parameters from ref (80), to update those from ref (81). For bottom two systems (group 2), the right helix and hairpin strand (Figure 2C) are predicted to stack on each other with an intervening noncanonical pair (12).
Predictions are by eq 24, with aG, bG, cG, dG, and ΔG°37,strain equal to 6.39, −0.14, 0.25, 1.05, and 2.69 kcal/mol, respectively.
Predictions are by eq 25, with aG′, bG′, dG′, and ΔG°37,strain′ equal to 8.06, −0.28, 0.83, and 1.94 kcal/mol, respectively.
Figure 5.

ΔG°37,MBL init plots for G_CG_G/CnmC. Black rectangles are for G_CG_G/CamC measured by UV melting, red circles are for G_CG_G/CumC measured by UV melting, green triangles are for G_CG_G/CamC measured by FCA, blue upside-down triangles are for G_CG_G/CumC measured by FCA, purple left-facing triangles are for CgaaaCGaG/CcaguaG and CgaaaCGaG/CcagaG measured by UV melting, burgundy right-facing triangles are for CgaaaCGaG/CcaguaG and CgaaaCGaG/CcagaG measured by FCA, and cyan diamonds are for G_CG_G/CnmC predicted by eq 24.
Enthalpy Changes for Three-Way Multibranch Loops and Their Initiation
Similar to ΔG°37,MBL, ΔH°MBL can be estimated from optical melting measurements with a nearest-neighbor model:
Here, ΔH°bimol is the measured ΔH° for duplex formation (Table 2), ΔH°helix’s are for the forming the base pairs in the two helices, ΔH°bimol init is the penalty for bimolecular initiation, and ΔH°prod mm is for any possible stacking of mismatches formed on the helix in the product hairpin strand. In the previous model (44), only the first mismatch is predicted to stabilize the product hairpin. Recent results reveal the second 3′ nucleotide overhang also contributes to the thermodynamics of the system (39).
The enthalpy of multibranch loops, ΔH°MBL, was modeled as the sum of initiation and stacking (44):
The stacking properties of the second and third nucleotide overhangs in a multibranch loop are not clear. Meanwhile, the enthalpy measurement for multibranch loop bimolecular dissociation usually has an error above ±5 kcal/mol (13), while the second overhangs usually affect the enthalpy within 2 kcal/mol (39). So the stacking effect from the second and later overhangs in a multibranch loop is neglected.
The available loop enthalpies are listed in Supporting Information. Calorimetric experiments have shown that formation of multibranch loops can be associated with an unfavorable ΔH° (45). Our optical melting results agree with the expectation from calorimetric experiments.
Discussion
Rapid and widespread genomic sequencing has dramatically increased the number of known RNA sequences (46,47). Many of them have important cellular functions, and often functions are directly related to secondary and tertiary structure. RNA folding in vitro often traps structures that are not in the lowest free energy state (48). In vivo, however, RNA chaperones facilitate equilibration with the minimum free energy structure (49). Thus, computer prediction of secondary structure through free energy minimization can be a powerful tool for deducing structure (12,15,50−52) and function for a sequence (53). Improving the accuracy of secondary structure predictions is therefore important for future genomic studies. Multibranch loops remain one of the few RNA motifs not extensively studied. The diversity of their known sequences (54−59) and structures (60−62) suggests they will be involved in many different functions.
Effects of Loop Sequence
Adding an unpaired A or U to a multibranch loop is not always equivalent, but the difference is very subtle when considered on a per nucleotide basis (Table 3 and Figure 5). On the basis of optical melting, systems G_CG_G/CaC and G_CG_G/Ca5C are about 0.7 kcal/mol more stable than systems G_CG_G/CuC and G_CG_G/Cu5C. This is within experimental error of the more favorable stacking by 0.5 kcal/mol of an unpaired A on a CG pair (5′CA/3′G) compared to that of an unpaired U (5′CU/3′G). For m between 2 and 4, the additional unpaired A’s or U’s add essentially identical increments to the stability of a multibranch loop (Table 3). This differs from the observation that poly(A) and poly(U) have different stacking properties (63,64), and the sequence dependence of terminal dangling end stacking where enhancement from multiple A’s is different from that of multiple U’s (39). This may reflect the limited space in the junction which may not allow optimal stacking of the unpaired nucleotides when m = 2, 3, or 4. The more favorable stability of G_CG_G/Ca5C relative to G_CG_G/Cu5C may reflect more flexibility or potential for tertiary interactions for larger loops. In the nearest-neighbor model for predicting stability (65), all of the unpaired nucleotides and half of the nucleotides in closing base pairs are considered to be part of the loop. Thus, on the basis of optical melting data, the largest difference per nucleotide between G_CG_G/CamC and G_CG_G/CumC loops is for G_CG_G/CaC and G_CG_G/CuC systems: (9.15 − 8.44)/(1 + 6/2) = 0.18 kcal/mol per nucleotide. The differences for the others are negligible (less than 0.1 kcal/mol). For enthalpy and entropy (Table 2), the different unpaired nucleotides in the junction did not show obvious differences.
Systems G_GC_G/CamC (m = 0−4) were measured previously (13) and only differ from the G_CG_G/CamC systems by a closing base pair. Excluding the different stacking properties, ΔG°MBL init’s (eq 17) for these two groups agree with each other within experimental error.
Free Energy Models for RNA Multibranch Loop Initiation
The free energies for formation of multibranch loops were fit to three models. One model (12) is represented by
Here, aG, bG, and cG are parameters, n is the number of unpaired nucleotides, and h is the number of helices.
On the basis of optical melting experiments on a series of three- and four-way multibranch loops, it was suggested that eq 22 is a better approximation (13):
 |
Here avg asym is the average asymmetry, which reflects the distribution of unpaired nucleotides in the loop, as defined by
 |
In eq 22, ΔG°strain is a penalty for three-way multibranch loops with zero or one unpaired nucleotide. While eq 22 fits the data better than eq 21, the avg asym term has not been included in dynamic programing algorithms.
The data can also be fit to a third model that adds the number of unpaired nucleotides to eq 22:
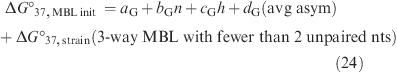 |
The measurements reported here and 3D structures indicate that it is a good approximation to consider only the stacking of the first dangling end or noncanonical pair when predicting ΔG°MBL, as assumed previously (13). The second and third dangling ends or noncanonical pairs will affect the energetics of the long strand hairpin stem (39−41), however, and thus affect the calculation of ΔG°37,prod mm in eq 16 and therefore ΔG°37,MBL.
The adjustment for ΔG°37,MBL by adding the second and third dangling end to hairpin stability was made for available data (13,14), and the revised values are available in Supporting Information. Linear regression was used to derive the parameters for eqs 21, 22, and 24. Previous comparisons of melting and isothermal titration calorimetry results show that 1/TM vs ln(CT/4) plots give reasonably accurate ΔG° values even when melting is not strictly a two-state process (14). Furthermore, for the G_CG_G/C_C system, the ΔH°’s differed by 34% when determined by 1/TM vs ln(CT/4) and by fitting melting curves, but ΔG°37 of −8.89 kcal/mol from FCA was close to the values of −8.37 and −9.00 kcal/mol from melting curves (Table 2). Therefore, systems with ΔH°’s differing by <30% between the two methods of analysis were included in the linear regression. Group 2 systems were not included in the linear regression, because of the more complex sequence in these multibranch loops. Little is known about the sequence dependence of interactions in multibranch loops so they are not included in current energetic models. The parameters from the fit for eq 24 are listed in Table 4, and those for eqs 21 and 22 are listed in Supporting Information. The coefficients of determination, R2, and the p-value of the F test are also listed. Parameters changed little if all the available systems except the previously excluded ones (13) were included in the fit. The predictions from eqs 21, 22, and 24 for measured multibranch loops are listed in Supporting Information.
Table 4. Nearest-Neighbor Free Energy Parameters for Multibranch Loop Initiation at 37 °C.
| model | parameter | value (kcal/mol) | error (kcal/mol) | p-value |
|---|---|---|---|---|
| eq 24 universal model | aG | 6.39 | 0.86 | 3.48 × 10⁻¹⁰ |
| bG | −0.14 | 0.06 | 0.0216 | |
| cG | 0.25 | 0.22 | 0.2659 | |
| dG | 1.05 | 0.17 | 7.23 × 10⁻⁸ | |
| ΔG°37,strain | 2.69 | 0.38 | 1.88 × 10⁻⁹ | |
| R2 = 0.6007, p-value = 3.523 × 10⁻¹² | ||||
| eq 25 model for three-way MBL | aG′ | 8.06 | 0.39 | <2 × 10⁻¹⁶ |
| bG′ | −0.28 | 0.06 | 2.75 × 10⁻⁵ | |
| dG′ | 0.83 | 0.17 | 1.57 × 10⁻⁵ | |
| ΔG°37,strain′ | 1.94 | 0.38 | 5.32 × 10⁻⁶ | |
| R2 = 0.7083, p = 3.737 × 10⁻¹³ | ||||
| eq 26 model for four-way MBL | aG′′ | 6.48 | 0.45 | 9.97 × 10⁻¹⁰ |
| dG′′ | 1.36 | 0.34 | 0.0015 | |
| R2 = 0.5248, p = 0.001503 | ||||
The p-values for parameter cG in eqs 21, 22, and 24 are all >0.1, which indicate the number of helixes from the loop is not a highly correlated term in these models. When the data for ΔH° and ΔS° are fit to the equivalent of eq 24, however, the number of helixes is a reasonably well correlated term (see below). Thus we recommend retaining the cGh term in algorithms for predicting secondary structure so that they can be used for temperatures other than 37 °C. While average asymmetry is not included in dynamic programming algorithms (15), eq 24 could be used for calculating the free energies of predicted structures, so the predicted structures could be reordered. The ability of eq 24 to approximate the experimental results for ΔG°37,MBL init is shown in Table 3 and Figure 5 for the loops reported here and in Supporting Information for all loops.
The data can also be fit to separate energetic models for three- and four-way multibranch loops. The ΔG°37,MBL init’s for three-way multibranch loops are fit to
 |
For four-way multibranch loops, statistical tests of free energy and enthalpy models with a term for unpaired nucleotides, n, show n is not a highly correlated term. Thus, the ΔG°37,MBL init’s for four-way multibranch loops fit well to a simpler model:
The parameters from the fits to eqs 25 and 26 are listed in Table 4. The coefficients of determination, R2, and the p-value of the F test for each term are also listed. The ability of eqs 25 and 26 to approximate the experimental results for ΔG°37,MBL init is shown in Supporting Information.
Comparison with Polymer Model for Loop Initiation
The results in Table 3 and for other three-way multibranch loops (13,14) can be compared with predictions from the two-length-scale freely jointed chain (FJC) polymer model of Aalberts and Nandagopal (66). The predictions from the FJC model and eq 24 differ by as much as 4.2 kcal/mol at 37 °C for a single unpaired nucleotide but converge as the number of unpaired nucleotides increases so that the difference is only 0.9 kcal/mol for 10 unpaired nucleotides (see Supporting Information). The latter is within the propagated experimental error for eq 24. The FJC model predicts more unfavorable free energy for loop initiation, ΔG°37,FJC, as the number of unpaired nucleotides increases. In contrast, the experiments indicate that loop initiations become more favorable as the number of unpaired nucleotides increases in the three-way multibranch loops studied (Table 3, Figure 5, Supporting Information, and ref (13)). This may also reflect unfavorable entropy due to conformational constraints in the limited junction space, as is suggested by identical stacking properties of unpaired Am or Um as m increases up to 5. For four-way multibranch loops studied previously (13), however, added unpaired nucleotides in the loop destabilize the loop. For the available database, the average asymmetry term in eq 26 provides good fits to the data (Supporting Information). Replacing the average asymmetry term with ΔG°37,FJC or adding ΔG°37,FJC to eq 26 and refitting parameters give poorer fits. Here, ΔG°37,FJC is the loop entropy term calculated from the FJC model (66) for each multibranch loop (see Supporting Information). Experimental data and predictions from eqs 25 and 26 for RNA multibranch loops are consistent with previous observations in DNA that unpaired nucleotides stabilize three-way multibranch loops but destabilize four-way multibranch loops (8). In DNA five-way multibranch loops, unpaired nucleotides stabilize the loop (8). Evidently, in addition to polymer theory, conformational constraints or other considerations for unpaired nucleotides fitting into multibranch loops are needed to fully understand the energetics, especially for multibranch loops with an odd number of helixes.
The FJC model predicts a novel favorable entropy associated with coaxial stacking of helixes (66). As a further test of the model, the experimental results for three- and four-way loops were fit to eq 24 modified to also include ΔG°37,FJC:
 |
The calculation for ΔG°37,FJC and the parameters for this model are listed in Supporting Information. aG′′′ can be neglected because it has a small value of 0.12 and high p-value of 0.90. All other terms, including cG′′′, have p-values less than 0.10. With available data, eq 27 does not improve the predictions. The average absolute error for predictions with eq 27 is 0.59 kcal/mol, while that for eq 24 is 0.54 kcal/mol. Further experiments, however, are required to completely test the FJC and other models for the energetics of multibranch loops.
Model for Enthalpy Changes for Initiation of Three-Way Multibranch Loops
Previously published data for enthalpy changes for multibranch loop initiation, ΔH°MBL init, have been fit to (44)
 |
Similar to eqs 24, 25, and 26 for predicting free energy for multibranch loop initiation, the data can also be fit to a “universal” model, a model for three-way multibranch loops, and a model for four-way multibranch loops, eqs 29, 30, and 31, respectively.
 |
 |
The adjustment for the second dangling ends in the product hairpin was made to the available data (13,14) and to our measurements. The ΔH°MBL’s and ΔH°MBL init’s from our measurements are listed in Table 5. The calculations for all data are available in Supporting Information. Linear regressions were used to derive parameters for eqs 29, 30, and 31 from the adjusted data excluding systems omitted from the regression of multibranch loop initiation free energy and using ΔH° from 1/TM vs ln(CT/4) for all sequences, including G_CG_G/C_C. The parameters, the p-values of the F test for each parameter, the coefficient of determination for each model (R2), and the p-value of the F test for the models are listed in Table 6.
Table 5. Enthalpy Changes (kcal/mol) for Three-Way Multibranch Loops.
| system | unpaired | average asymmetry | ΔH°MBL | ΔH°stacking | ΔH°MBL init | ΔH°MBL init predicted by eq 29b | ΔH°MBL init predicted − ΔH°MBL init |
| G_CG_G/C_C | 0 | 0 | 36.36 | −14.88 | 51.24 | 33.03 | −18.21 |
| G_CG_G/CaC | 1 | 0.67 | 12.98 | −23.88 | 36.86 | 38.11 | 1.25 |
| G_CG_G/Ca2C | 2 | 1.33 | 1.92 | −23.88 | 25.8 | 21.29 | −4.51 |
| G_CG_G/Ca3C | 3 | 2.0 | 0.15 | −23.88 | 24.03 | 26.37 | 2.34 |
| G_CG_G/Ca4C | 4 | 2.67a | −1.18 | −23.88 | 22.7 | 24.50 | 1.80 |
| G_CG_G/Ca5C | 5 | 3.33a | −11.06 | −23.88 | 12.82 | 22.63 | 9.81 |
| G_CG_G/CuC | 1 | 0.67 | 11.79 | −22.38 | 34.17 | 38.11 | 3.94 |
| G_CG_G/Cu2C | 2 | 1.33 | 8.42 | −22.38 | 30.8 | 21.29 | −9.51 |
| G_CG_G/Cu3C | 3 | 2.0 | −2.92 | −22.38 | 19.46 | 26.37 | 6.91 |
| G_CG_G/Cu4C | 4 | 2.67a | −8.05 | −22.38 | 14.33 | 24.50 | 10.17 |
| G_CG_G/Cu5C | 5 | 3.33a | −3.59 | −22.38 | 18.79 | 22.63 | 3.84 |
| CgaaaCGaG/GaugacC | 10 | 2.67a | −10.01 | −17.5 | 7.49 | 13.28 | 1.59 |
| CgaaaCGaG/GagacC | 9 | 2.0 | 3.39 | −17.5 | 20.89 | 15.15 | −9.94 |
The average asymmetry is set to 2.0 for predicting ΔHMBL init.
Predictions are by eq 29, with aH, bH, cH, dH, and ΔH°37,strain equal to 34.47 ± 13.70, −1.87 ± 0.92, −7.75 ± 3.48, 10.38 ± 2.73, and 21.81 ± 6.11 kcal/mol, respectively.
Table 6. Enthalpy Parameters for Multibranch Loop Initiation Models.
| model | parameter | value (kcal/mol) | error (kcal/mol) | p-value |
|---|---|---|---|---|
| eq 29 universal model | aH | 34.47 | 13.70 | 0.0144 |
| bH | −1.87 | 0.92 | 0.0466 | |
| cH | −7.75 | 3.48 | 0.0295 | |
| dH | 10.38 | 2.73 | 0.0003 | |
| ΔH°strain | 21.81 | 6.11 | 0.0007 | |
| R2 = 0.4276, p-value = 2.595 × 10⁻⁷ | ||||
| eq 30 model for three-way MBL | aH′ | 24.50 | 7.03 | 0.0010 |
| bH′ | −3.56 | 1.10 | 0.0022 | |
| dH′ | 6.31 | 3.14 | 0.0050 | |
| ΔG°37,strain′ | 11.28 | 6.91 | 0.1089 | |
| R2 = 0.384, p-value = 2.528 × 10⁻⁵ | ||||
| eq 31 model for four-way MBL | aH′′ | −12.25 | 4.93 | 0.0263 |
| dH′′ | 17.69 | 3.76 | 0.0003 | |
| R2 = 0.6124, p-value = 0.0003394 | ||||
The Loop E Motif May Not Stabilize a Multibranch Loop
The loop E motif widely exists in internal, hairpin, and multibranch loops in 5S, 16S, and 23S rRNA (3,67−71). It is also in catalytic RNAs, such as RNase P (72), group I introns (73), and group II introns (74). It can be involved in protein binding (75,76) and RNA−RNA interactions (77). An NMR structure reveals that there are three noncanonical base pairs in the loop E motif (Figure 2, bottom) (78). Its thermodynamic properties were measured in an internal loop (79) but not in a multibranch loop. The free energy for forming a duplex with loop E motif as internal loop, 5′GCGaguaGGC/3′CGCaagCCG, is −8.0 kcal/mol in 1 M Na+ buffer (79), which is 1.3 kcal/mol more stable than predicted by RNAstructure. The loop E motif (Figure 2, bottom) includes an A37/G6 sheared pair, an A7/U36 trans Hoogsteen pair, and an A7/A34 parallel pair. Moreover, G35 interacts with the phosphate between A6 and A7. U36 plays a critical role in the loop E motif because it forms a hydrogen bond with its own backbone and also interacts with G6 ribose in addition to forming the A7/U36 trans Hoogsteen pair. Deletion of U36 destabilizes the multibranch loop, CgaaaCGaG/CcaguaG, by 1.2 ± 0.5 kcal/mol (Tables 2 and 3). The CgaaaCGaG/CcaguaG multibranch loop with the loop E motif has a ΔG°37,MBL init of 7.25 ± 0.26 kcal/mol by UV melting, which is within experimental error of the 6.92 ± 0.99 kcal/mol predicted by eq 25. For system CgaaaCGaG/CcagaG, in which U36 was deleted from the loop E motif, the measured ΔG°37,MBL init of 8.44 ± 0.08 kcal/mol is 1.24 kcal/mol less favorable than predicted by eq 25 (Table 3).
The comparison suggests that some sequences of natural multibranch loops have evolved to provide extra stability and conserved structures have conserved stability. Extra stability from a natural motif was suggested on the basis of the stability measured for another natural sequence (14). Evidently, much more must be learned about the sequence dependence of multibranch loop stability in order to provide reasonable approximations for structure prediction algorithms.
Entropy Changes for Multibranch Loop Initiation
The entropy change for multibranch loop initiation, ΔS°MBL init, can be calculated from ΔH°MBL init and ΔG°37,MBL init, because
 |
The values of aS, bS, cS, dS, and ΔS°strain for the model similar to eqs 24, 25, and 26 are listed in Table 7. Essentially identical values are obtained if the entropy data is fit separately to an equation with the same terms as eqs 24, 25, and 26.
Table 7. Entropy Parameters for Multibranch Loop Initiation.
Conclusion
Optical melting and fluorescence competition assays were used to measure the thermodynamics of two series of three-way multibranch loop systems. The free energies measured by these two methods agree within experimental error. The results reveal that adding up to five unpaired adenosines or four unpaired uridines into a three-way multibranch loop can stabilize the loop. Adenosines and uridines stabilize the loop similarly, even though A and U have different stacking properties on the end of a duplex. Revised parameters for predicting the thermodynamics of multibranch loops are reported. This revised model predicts the free energy of a natural loop E motif and a mutant reasonably well. Measurement of common natural motifs could further improve our understanding of factors stabilizing multibranch loop stabilities and provide better prediction of RNA secondary structure.
Acknowledgments
We thank Dan Wang for fitting titration curves with the SAS program and linear regression with the R program, Matt Disney for help with initial experiments, and Zhi Lu for providing the enthalpy calculation worksheet.
Supporting Information Available
Multibranch loop initation free energies and their predictions by different models; multibranch loop initation enthalpies and their predictions by different models; the stacking and noncanonical interactions in three-way multibranch loops; free energy parameters for multibranch loop initiation models of eqs 21, 22, and 27; comparison of measurements in this study with predictions from eq 24 and predictions with the freely jointed chain polymer model; comparison of measurements with predictions from the freely jointed chain polymer model and predictions from eqs 24 and 25. This material is available free of charge via the Internet at http://pubs.acs.org.
This work was supported by NIH Grants GM22939 (D.H.T.) and R01 GM076485 (D.H.M.).
Funding Statement
National Institutes of Health, United States
Supplementary Material
References
- Kim S. H.; Quigley G. J.; Suddath F. L.; McPherso A; Sneden D.; Kim J. J.; Weinzier J; Rich A. (1973) 3-dimensional structure of yeast phenylalanine transfer RNA: folding of polynucleotide chain. Science 179, 285–288. [DOI] [PubMed] [Google Scholar]
- Yusupov M. M.; Yusupova G. Z.; Baucom A.; Lieberman K.; Earnest T. N.; Cate J. H. D.; Noller H. F. (2001) Crystal structure of the ribosome at 5.5 angstrom resolution. Science 292, 883–896. [DOI] [PubMed] [Google Scholar]
- Leontis N. B.; Westhof E. (1998) A common motif organizes the structure of multi-helix loops in 16 and 23 S ribosomal RNAs. J. Mol. Biol. 283, 571–583. [DOI] [PubMed] [Google Scholar]
- Watts J. M.; Dang K. K.; Gorelick R. J.; Leonard C. W.; Bess J. W. Jr.; Swanstrom R.; Burch C. L.; Weeks K. M. (2009) Architecture and secondary structure of an entire HIV-1 RNA genome. Nature 460, 711–716. [DOI] [PMC free article] [PubMed] [Google Scholar]
- Walter F.; Murchie A. I. H.; Lilley D. M. J. (1998) Folding of the four-way RNA junction of the hairpin ribozyme. Biochemistry 37, 17629–17636. [DOI] [PubMed] [Google Scholar]
- Rosen M. A.; Patel D. J. (1993) Conformational differences between bulged pyrimidines (C-C) and purines (A-A, I-I) at the branch point of three-stranded DNA junctions. Biochemistry 32, 6563–6575. [DOI] [PubMed] [Google Scholar]
- Welch J. B.; Walter F.; Lilley D. M. (1995) Two inequivalent folding isomers of the three-way DNA junction with unpaired bases: sequence-dependence of the folded conformation. J. Mol. Biol. 251, 507–519. [DOI] [PubMed] [Google Scholar]
- Kadrmas J. L.; Ravin A. J.; Leontis N. B. (1995) Relative stabilities of DNA three-way, four-way and five-way junctions (multi-helix junction loops): unpaired nucleotides can be stabilizing or destabilizing. Nucleic Acids Res. 23, 2212–2222. [DOI] [PMC free article] [PubMed] [Google Scholar]
- Leontis N. B.; Hills M. T.; Piotto M.; Ouporov I. V.; Malhotra A.; Gorenstein D. G. (1995) Helical stacking in DNA three-way junctions containing two unpaired pyrimidines: proton NMR studies. Biophys. J. 68, 251–265. [DOI] [PMC free article] [PubMed] [Google Scholar]
- Leontis N. B.; Kwok W.; Newman J. S. (1991) Stability and structure of three-way DNA junctions containing unpaired nucleotides. Nucleic Acids Res. 19, 759–766. [DOI] [PMC free article] [PubMed] [Google Scholar]
- Overmars F. J.; Pikkemaat J. A.; van den Elst H.; van Boom J. H.; Altona C. (1996) NMR studies of DNA three-way junctions containing two unpaired thymidine bases: the influence of the sequence at the junction on the stability of the stacking conformers. J. Mol. Biol. 255, 702–713. [DOI] [PubMed] [Google Scholar]
- Mathews D. H.; Sabina J.; Zuker M.; Turner D. H. (1999) Expanded sequence dependence of thermodynamic parameters improves prediction of RNA secondary structure. J. Mol. Biol. 288, 911–940. [DOI] [PubMed] [Google Scholar]
- Mathews D. H.; Turner D. H. (2002) Experimentally derived nearest-neighbor parameters for the stability of RNA three- and four-way multibranch loops. Biochemistry 41, 869–880. [DOI] [PubMed] [Google Scholar]
- Diamond J. M.; Turner D. H.; Mathews D. H. (2001) Thermodynamics of three-way multibranch loops in RNA. Biochemistry 40, 6971–6981. [DOI] [PubMed] [Google Scholar]
- Mathews D. H.; Disney M. D.; Childs J. L.; Schroeder S. J.; Zuker M.; Turner D. H. (2004) Incorporating chemical modification constraints into a dynamic programming algorithm for prediction of RNA secondary structure. Proc. Natl. Acad. Sci. U.S.A. 101, 7287–7292. [DOI] [PMC free article] [PubMed] [Google Scholar]
- Andronescu M.; Condon A.; Hoos H. H.; Mathews D. H.; Murphy K. P. (2007) Efficient parameter estimation for RNA secondary structure prediction. Bioinformatics 23, i19–i28. [DOI] [PubMed] [Google Scholar]
- Wu J. C.; Gardner D. P.; Ozer S.; Gutell R. R.; Ren P. Y. (2009) Correlation of RNA secondary structure statistics with thermodynamic stability and applications to folding. J. Mol. Biol. 391, 769–783. [DOI] [PMC free article] [PubMed] [Google Scholar]
- Dima R. I.; Hyeon C.; Thirumalai D. (2005) Extracting stacking interaction parameters for RNA from the data set of native structures. J. Mol. Biol. 347, 53–69. [DOI] [PubMed] [Google Scholar]
- Do C. B.; Woods D. A.; Batzoglou S. (2006) CONTRAfold: RNA secondary structure prediction without physics-based models. Bioinformatics 22, e90–98. [DOI] [PubMed] [Google Scholar]
- Walter F.; Murchie A. I.; Duckett D. R.; Lilley D. M. (1998) Global structure of four-way RNA junctions studied using fluorescence resonance energy transfer. RNA 4, 719–728. [DOI] [PMC free article] [PubMed] [Google Scholar]
- Bassi G. S.; Murchie A. I.; Walter F.; Clegg R. M.; Lilley D. M. (1997) Ion-induced folding of the hammerhead ribozyme: a fluorescence resonance energy transfer study. EMBO J. 16, 7481–7489. [DOI] [PMC free article] [PubMed] [Google Scholar]
- Kazantsev A. V.; Krivenko A. A.; Harrington D. J.; Holbrook S. R.; Adams P. D.; Pace N. R. (2005) Crystal structure of a bacterial ribonuclease P RNA. Proc. Natl. Acad. Sci. U.S.A. 102, 13392–13397. [DOI] [PMC free article] [PubMed] [Google Scholar]
- Edwards T. E.; Ferre-D’Amare A. R. (2006) Crystal structures of the thi-box riboswitch bound to thiamine pyrophosphate analogs reveal adaptive RNA-small molecule recognition. Structure 14, 1459–1468. [DOI] [PubMed] [Google Scholar]
- Cate J. H.; Gooding A. R.; Podell E.; Zhou K.; Golden B. L.; Kundrot C. E.; Cech T. R.; Doudna J. A. (1996) Crystal structure of a group I ribozyme domain: principles of RNA packing. Science 273, 1678–1685. [DOI] [PubMed] [Google Scholar]
- Pley H. W.; Flaherty K. M.; McKay D. B. (1994) Three-dimensional structure of a hammerhead ribozyme. Nature 372, 68–74. [DOI] [PubMed] [Google Scholar]
- Conn G. L.; Draper D. E.; Lattman E. E.; Gittis A. G. (1999) Crystal structure of a conserved ribosomal protein-RNA complex. Science 284, 1171–1174. [DOI] [PubMed] [Google Scholar]
- Kieft J. S.; Zhou K.; Grech A.; Jubin R.; Doudna J. A. (2002) Crystal structure of an RNA tertiary domain essential to HCV IRES-mediated translation initiation. Nat. Struct. Biol. 9, 370–374. [DOI] [PubMed] [Google Scholar]
- Toor N.; Keating K. S.; Taylor S. D.; Pyle A. M. (2008) Crystal structure of a self-spliced group II intron. Science 320, 77–82. [DOI] [PMC free article] [PubMed] [Google Scholar]
- Ban N.; Nissen P.; Hansen J.; Moore P. B.; Steitz T. A. (2000) The complete atomic structure of the large ribosomal subunit at 2.4 Å resolution. Science 289, 905–920. [DOI] [PubMed] [Google Scholar]
- Tyagi R.; Mathews D. H. (2007) Predicting helical coaxial stacking in RNA multibranch loops. RNA 13, 939–951. [DOI] [PMC free article] [PubMed] [Google Scholar]
- Schroeder S. J.; Turner D. H. (2009) Optical melting measurements of nucleic acid thermodynamics. Methods Enzymol. 468, 371–387. [DOI] [PMC free article] [PubMed] [Google Scholar]
- Lu M.; Guo Q.; Marky L. A.; Seeman N. C.; Kallenbach N. R. (1992) Thermodynamics of DNA branching. J. Mol. Biol. 223, 781–789. [DOI] [PubMed] [Google Scholar]
- Gelfand C. A.; Plum G. E.; Mielewczyk S.; Remeta D. P.; Breslauer K. J. (1999) A quantitative method for evaluating the stabilities of nucleic acids. Proc. Natl. Acad. Sci. U.S.A. 96, 6113–6118. [DOI] [PMC free article] [PubMed] [Google Scholar]
- Liu B.; Shankar N.; Turner D. H. (2010) Fluorescence competition assay measurements of free energy changes for RNA pseudoknots. Biochemistry 49, 623–634. [DOI] [PMC free article] [PubMed] [Google Scholar]
- Borer P. N. (1975) Optical properties of nucleic acids, absorption and circular dichroism spectra, in Handbook of Biochemistry and Molecular Biology: Nucleic Acids (Fasman G. D., Ed.) 3rd ed., pp 589−595, CRC Press, Cleveland, OH. [Google Scholar]
- Richards E. G. (1975) Use of tables in calculation of absorption, optical rotatory dispersion and circular dichroism of polyribonucleotides, in Handbook of Biochemistry and Molecular Biology: Nucleic Acids (Fasman G. D., Ed.) 3rd ed., pp 596−603, CRC Press, Cleveland, OH. [Google Scholar]
- Petersheim M.; Turner D. H. (1983) Base-stacking and base-pairing contributions to helix stability: thermodynamics of double-helix formation with CCGG, CCGGp, CCGGAp, ACCGGp, CCGGUp, and ACCGGUp. Biochemistry 22, 256–263. [DOI] [PubMed] [Google Scholar]
- McDowell J. A.; Turner D. H. (1996) Investigation of the structural basis for thermodynamic stabilities of tandem GU mismatches: solution structure of (rGAGGUCUC)2 by two-dimensional NMR and simulated annealing. Biochemistry 35, 14077–14089. [DOI] [PubMed] [Google Scholar]
- O’Toole A. S.; Miller S.; Haines N.; Zink M. C.; Serra M. J. (2006) Comprehensive thermodynamic analysis of 3′ double-nucleotide overhangs neighboring Watson-Crick terminal base pairs. Nucleic Acids Res. 34, 3338–3344. [DOI] [PMC free article] [PubMed] [Google Scholar]
- Clanton-Arrowood K.; McGurk J.; Schroeder S. J. (2008) 3′ terminal nucleotides determine thermodynamic stabilities of mismatches at the ends of RNA helices. Biochemistry 47, 13418–13427. [DOI] [PubMed] [Google Scholar]
- Ohmichi T.; Nakano S.; Miyoshi D.; Sugimoto N. (2002) Long RNA dangling end has large energetic contribution to duplex stability. J. Am. Chem. Soc. 124, 10367–10372. [DOI] [PubMed] [Google Scholar]
- Turner D. H. (2000) Conformational Changes, in Nucleic Acids: Structures, properties, and functions (Bloomfield V. A., Crothers D. M., and Tinoco I., Eds.) pp 259−334, University Science Books, Sausalito, CA. [Google Scholar]
- Kim J.; Walter A. E.; Turner D. H. (1996) Thermodynamics of coaxially stacked helices with GA and CC mismatches. Biochemistry 35, 13753–13761. [DOI] [PubMed] [Google Scholar]
- Lu Z. J.; Turner D. H.; Mathews D. H. (2006) A set of nearest neighbor parameters for predicting the enthalpy change of RNA secondary structure formation. Nucleic Acids Res. 34, 4912–4924. [DOI] [PMC free article] [PubMed] [Google Scholar]
- Mikulecky P. J.; Takach J. C.; Feig A. L. (2004) Entropy-driven folding of an RNA helical junction: an isothermal titration calorimetric analysis of the hammerhead ribozyme. Biochemistry 43, 5870–5881. [DOI] [PMC free article] [PubMed] [Google Scholar]
- Metzker M. L. (2010) Sequencing technologies—the next generation. Nat. Rev. Genet. 11, 31–46. [DOI] [PubMed] [Google Scholar]
- MacLean D.; Jones J. D.; Studholme D. J. (2009) Application of “next-generation” sequencing technologies to microbial genetics. Nat. Rev. Microbiol. 7, 287–296. [DOI] [PubMed] [Google Scholar]
- Uhlenbeck O. C. (1995) Keeping RNA happy. RNA 1, 4–6. [PMC free article] [PubMed] [Google Scholar]
- Mahen E. M., Watson P. Y., Cottrell J. W., and Fedor M. J. (2010) mRNA secondary structures fold sequentially but exchange rapidly in vivo, PLoS Biol. 8, e1000307. [DOI] [PMC free article] [PubMed] [Google Scholar]
- Rivas E.; Eddy S. R. (1999) A dynamic programming algorithm for RNA structure prediction including pseudoknots. J. Mol. Biol. 285, 2053–2068. [DOI] [PubMed] [Google Scholar]
- McCaskill J. S. (1990) The equilibrium partition function and base pair binding probabilities for RNA secondary structure. Biopolymers 29, 1105–1119. [DOI] [PubMed] [Google Scholar]
- Ding Y.; Lawrence C. E. (2003) A statistical sampling algorithm for RNA secondary structure prediction. Nucleic Acids Res. 31, 7280–7301. [DOI] [PMC free article] [PubMed] [Google Scholar]
- Tsui V.; Macke T.; Case D. A. (2003) A novel method for finding tRNA genes. RNA 9, 507–517. [DOI] [PMC free article] [PubMed] [Google Scholar]
- Brown J. W. (1998) The ribonuclease P database. Nucleic Acids Res. 26, 351–352. [DOI] [PMC free article] [PubMed] [Google Scholar]
- Williams K. P.; Bartel D. P. (1996) Phylogenetic analysis of tmRNA secondary structure. RNA 2, 1306–1310. [PMC free article] [PubMed] [Google Scholar]
- Ruschak A. M.; Mathews D. H.; Bibillo A.; Spinelli S. L.; Childs J. L.; Eickbush T. H.; Turner D. H. (2004) Secondary structure models of the 3′ untranslated regions of diverse R2 RNAs. RNA 10, 978–987. [DOI] [PMC free article] [PubMed] [Google Scholar]
- Lilley D. M. J. (1998) Folding of branched RNA species. Biopolymers 48, 101–112. [DOI] [PubMed] [Google Scholar]
- Andronescu M.; Bereg V.; Hoos H. H.; Condon A. (2008) RNA STRAND: the RNA secondary structure and statistical analysis database. BMC Bioinformatics 9, 340. [DOI] [PMC free article] [PubMed] [Google Scholar]
- Cannone J. J.; Subramanian S.; Schnare M. N.; Collett J. R.; D’Souza L. M.; Du Y.; Feng B.; Lin N.; Madabusi L. V.; Muller K. M.; Pande N.; Shang Z.; Yu N.; Gutell R. R. (2002) The comparative RNA web (CRW) site: an online database of comparative sequence and structure information for ribosomal, intron, and other RNAs. BMC Bioinformatics 3, 2. [DOI] [PMC free article] [PubMed] [Google Scholar]
- Ban N.; Nissen P.; Hansen J.; Moore P. B.; Steitz T. A. (2000) The complete atomic structure of the large ribosomal subunit at 2.4 angstrom resolution. Science 289, 905–920. [DOI] [PubMed] [Google Scholar]
- Cate J. H.; Gooding A. R.; Podell E.; Zhou K. H.; Golden B. L.; Kundrot C. E.; Cech T. R.; Doudna J. A. (1996) Crystal structure of a group I ribozyme domain: principles of RNA packing. Science 273, 1678–1685. [DOI] [PubMed] [Google Scholar]
- Krasilnikov A. S.; Yang X. J.; Pan T.; Mondragon A. (2003) Crystal structure of the specificity domain of ribonuclease P. Nature 421, 760–764. [DOI] [PubMed] [Google Scholar]
- Eisenberg H.; Felsenfeld G. (1967) Studies of the temperature-dependent conformation and phase separation of polyriboadenylic acid solutions at neutral pH. J. Mol. Biol. 30, 17–37. [DOI] [PubMed] [Google Scholar]
- Inners L. D.; Felsenfeld G. (1970) Conformation of polyribouridylic acid in solution. J. Mol. Biol. 50, 373–389. [DOI] [PubMed] [Google Scholar]
- Tinoco I. Jr.; Borer P. N.; Dengler B.; Levin M. D.; Uhlenbeck O. C.; Crothers D. M.; Gralla J. (1973) Improved estimation of secondary structure in ribonucleic acids. Nat. New Biol. 246, 40–41. [DOI] [PubMed] [Google Scholar]
- Aalberts D. P.; Nandagopal N. (2010) A two-length-scale polymer theory for RNA loop free energies and helix stacking. RNA 16, 1350–1355. [DOI] [PMC free article] [PubMed] [Google Scholar]
- Branch A. D.; Benenfeld B. J.; Robertson H. D. (1985) Ultraviolet light-induced crosslinking reveals a unique region of local tertiary structure in potato spindle tuber viroid and HeLa 5S RNA. Proc. Natl. Acad. Sci. U.S.A. 82, 6590–6594. [DOI] [PMC free article] [PubMed] [Google Scholar]
- Endo Y.; Gluck A.; Wool I. G. (1993) Ribosomal RNA identity elements for recognition by ricin and by alpha-sarcin: mutation in the putative CG pair that closes a GAGA tetraloop. Nucleic Acids Symp. Ser. 165–166. [PubMed] [Google Scholar]
- Moazed D.; Robertson J. M.; Noller H. F. (1988) Interaction of elongation factors EF-G and EF-Tu with a conserved loop in 23S RNA. Nature 334, 362–364. [DOI] [PubMed] [Google Scholar]
- Wimberly B.; Varani G.; Tinoco I. Jr. (1993) The conformation of loop E of eukaryotic 5S ribosomal RNA. Biochemistry 32, 1078–1087. [DOI] [PubMed] [Google Scholar]
- Wimberly B. (1994) A common RNA loop motif as a docking module and its function in the hammerhead ribozyme. Nat. Struct. Biol. 1, 820–827. [DOI] [PubMed] [Google Scholar]
- Massire C.; Jaeger L.; Westhof E. (1998) Derivation of the three-dimensional architecture of bacterial ribonuclease P RNAs from comparative sequence analysis. J. Mol. Biol. 279, 773–793. [DOI] [PubMed] [Google Scholar]
- Michel F.; Westhof E. (1990) Modeling of the 3-dimensional architecture of group-I catalytic introns based on comparative sequence analysis. J. Mol. Biol. 216, 585–610. [DOI] [PubMed] [Google Scholar]
- Michel F.; Umesono K.; Ozeki H. (1989) Comparative and functional anatomy of group-II catalytic introns—a review. Gene 82, 5–30. [DOI] [PubMed] [Google Scholar]
- Dragon F.; Brakier-Gingras L. (1993) Interaction of Escherichia coli ribosomal protein S7 with 16S rRNA. Nucleic Acids Res. 21, 1199–1203. [DOI] [PMC free article] [PubMed] [Google Scholar]
- Wimberly B. T.; White S. W.; Ramakrishnan V. (1997) The structure of ribosomal protein S7 at 1.9 Å resolution reveals a beta-hairpin motif that binds double-stranded nucleic acids. Structure 5, 1187–1198. [DOI] [PubMed] [Google Scholar]
- Burke J. M. (1996) Hairpin ribozyme: current status and future prospects. Biochem. Soc. Trans. 24, 608–615. [DOI] [PubMed] [Google Scholar]
- Szewczak A. A.; Moore P. B. (1995) The sarcin ricin loop, a modular RNA. J. Mol. Biol. 247, 81–98. [DOI] [PubMed] [Google Scholar]
- Serra M. J.; Baird J. D.; Dale T.; Fey B. L.; Retatagos K.; Westhof E. (2002) Effects of magnesium ions on the stabilization of RNA oligomers of defined structures. RNA 8, 307–323. [DOI] [PMC free article] [PubMed] [Google Scholar]
- Xia T.; SantaLucia J. Jr.; Burkard M. E.; Kierzek R.; Schroeder S. J.; Jiao X.; Cox C.; Turner D. H. (1998) Thermodynamic parameters for an expanded nearest-neighbor model for formation of RNA duplexes with Watson-Crick base pairs. Biochemistry 37, 14719–14735. [DOI] [PubMed] [Google Scholar]
- Walter A. E.; Turner D. H. (1994) Sequence dependence of stability for coaxial stacking of RNA helixes with Watson-Crick base paired interfaces. Biochemistry 33, 12715–12719. [DOI] [PubMed] [Google Scholar]
Associated Data
This section collects any data citations, data availability statements, or supplementary materials included in this article.