Abstract
Axial strain imaging has been utilized for the characterization of breast masses for over a decade; however, another important feature namely the shear strain distribution around breast masses has only recently been used. In this paper, we examine the feasibility of utilizing in-vivo axial-shear strain imaging for differentiating benign from malignant breast masses. Radiofrequency data was acquired using a VFX 13-5 linear array transducer on 41 patients using a Siemens SONOLINE Antares real-time clinical scanner at the University of Wisconsin Breast Cancer Center. Free-hand palpation using deformations of up to 10% was utilized to generate axial strain and axial-shear strain images using a two-dimensional cross-correlation algorithm from the radiofrequency data loops. Axial-shear strain areas normalized to the lesion size, applied strain and lesion strain contrast was utilized as a feature for differentiating benign from malignant masses. The normalized axial-shear strain area feature estimated on 8 patients with malignant tumors and 33 patients with fibroadenomas was utilized to demonstrate its potential for lesion differentiation. Biopsy results were considered the diagnostic standard for comparison. Our results indicate that the normalized axial-shear strain area is significantly larger for malignant tumors when compared to benign masses such as fibroadenomas. Axial-shear strain pixel values greater than a specified threshold, including only those with correlation coefficient values greater than 0.75, were overlaid on the corresponding B-mode image to aid in diagnosis. A scatter plot of the normalized area feature demonstrates the feasibility of developing a linear classifier to differentiate benign from malignant masses. The area under the receiver operator characteristic curve utilizing the normalized axial-shear strain area feature was 0.996, demonstrating the potential of this feature to noninvasively differentiate between benign and malignant breast masses.
Keywords: Breast cancer, Elasticity, Elasticity Imaging, Elastography, Strain, shear strain, Ultrasound
Introduction
Breast cancer remains the second-leading cause of cancer deaths in women after lung cancer, and over 190,000 new diagnoses of invasive breast cancer are expected in the United States this year (ACS 2009). As suggested by The American Cancer Society, breast self examination and clinical breast examination (palpation) are the most frequently used diagnostic tools for detecting breast abnormalities. Mammography is currently the primary screening modality for breast cancer detection (Smart et al. 1995; Tabar et al. 1999; Kolb et al. 2002). Although, the use of ultrasound imaging has been increasing for breast imaging, it has primarily been used as an adjunct to mammography to differentiate between solid and cystic masses and guide biopsy procedures. However, even with technological advances, B-mode and Doppler ultrasound still exhibit only a75.3% sensitivity for detecting breast cancers. The sensitivity of mammography alone is 77.6%, while the combination of mammography and ultrasound is 97% (Kolb et al. 2002). Mammographic sensitivity declines significantly with increasing breast density (correlated with younger ages), while ultrasound sensitivity improves (Kolb et al. 2002). Among the patients at elevated risk, including a larger number of women with dense breasts, mammographic sensitivity was only 50% while for the combination of mammography and ultrasound the sensitivity improved to 77.5% (Berg et al. 2008). Magnetic resonance imaging on the other hand has been reported to have very high sensitivity with lower specificity (Kuhl et al. 2005; Berg et al. 2008; Emine et al. 2009). Limitations of current imaging methods have led to increasing interest in utilizing stiffness variations between benign and malignant masses as a means of differentiation (Nightingale et al. 1995; Nightingale et al. 1999; Hiltawsky et al. 2001; Frey 2003; Bercoff et al. 2003; Regner et al. 2006; Burnside et al. 2007; Tanter et al. 2008).
Previous ultrasound studies (Cole-Beuglet et al. 1983; Leibman et al. 1993; Skaane and Engedal 1998; Ueno et al. 1986; Chen et al. 1995) have indicated that malignant breast tumors typically exhibit an irregular or spiculated appearance and are firmly bound to the surrounding tissue through infiltration, whereas fibroadenomas have more circumscribed margins and are more loosely bound to the surrounding tissue and in some instances may be surrounded by a capsule. Conventional ultrasound based methods include identifying suspicious sonographic features (Cole-Beuglet et al. 1983; Skaane and Engedal 1998; Stavros et al. 1995; Rahbar et al. 1999; Moon et al. 2002; Chen et al. 2004; Horsch et al. 2006; Chang et al. 2007), irregular shape (Moon et al. 2002), and acoustic shadowing which indicate malignancy as well as noting bland features such as circumscribed margins, oval shape, or posterior acoustic enhancement suggesting benign breast abnormalities.
For breast imaging there are several published studies aimed at improving the diagnosis of breast abnormalities using ultrasound. Much of this work is aimed at distinguishing cystic from solid tumors and differentiating benign from malignant solid breast masses. A well-known example is the set of ultrasound B-mode image based features described by Stavros et al. (1995) that apply relative ‘echogenicity,’ shadowing, morphology and shape of the mass, to stratify breast masses. This was followed by efforts to encode many of these criteria into an ultrasound detection scheme similar to the Breast Imaging Reporting and Data System (BI-RADS) for mammography systems (Stavros et al. 1995; Berg 2005; Hong et al. 2005; Mainiero et al. 2005). One significant drawback of this approach is that some of these parameters are described very subjectively and can be system-dependent. For example, the degree of shadowing (attenuation artifact) behind a lesion is a phenomenon that depends on relative acoustic attenuation.
In recent years, ultrasound-based axial strain imaging or elastography has been used to aid in distinguishing benign from the malignant breast masses (Hiltawsky et al. 2001; Regner et al. 2006; Burnside et al. 2007; Krouskop et al. 1987; Bertrand et al. 1989; Parker et al. 1990; Ophir et al. 1991; Garra et al. 1997; Ophir et al. 1999; Varghese 2009). Axial strain images created from pre and post-deformation ultrasound radiofrequency data acquired after application of a quasi-static tissue deformation have been utilized to characterize tissue with different stiffness variations. Since malignant masses are generally stiffer than benign masses, they are typically depicted as regions with low strains on the axial strain images when compared to the softer background adipose or fibrous tissue. Garra et al. (1997) demonstrated that axial strain images of cancers appear as regions with low strain when compared to benign masses. In addition, he has also illustrated that the cancers appear as larger stiffer regions on axial strain images (hypothesized to be due to the desmoplastic reaction due to infiltration of cancer cells into surrounding tissue) when compared to their dimensions on corresponding ultrasound B-mode images. Fibroadenomas on the other hand appear as masses with similar dimensions in both the B-mode and axial strain images. These results were further confirmed by Hall et al. who also demonstrated that the strain image contrast of some lesions, especially fibroadenoma, can change with increasing deformation (Hall et al.2003). Regner et al. (2006) and Burnside et al. (2007) have demonstrated the potential of breast mass differentiation based on utilization of this size ratio feature.
More recent publications from the international community have confirmed the value of strain imaging on similar or slightly larger patient populations (ranging from 99 to 193 cases) (Cho et al. 2010; Chung et al. 2010; Moon et al. 2009; Schaefer et al. 2009). Performance has been similar to previous studies demonstrating areas under the Receiver Operating Characteristic (ROC) curve of between 0.8 and 0.9, which, while promising, is not sufficient as a stand-alone predictor of malignancy to obviate biopsy. Though substantial progress has been made in moving ultrasound elastography toward routine clinical use, further studies including larger clinical trials are needed to demonstrate true clinical utility. Magnetic resonance imaging (MRI) elastography is in early phases of development demonstrating feasibility in phantom experiments (Mariappan et al. 2009) and showing promising results in a small patient population (57 patients), as recently reported by Siegmann et al. (2010).
Much of the previous research on ultrasound breast strain imaging as discussed above is based on interpretations of the normal component (axial strain images in particular) of the strain distribution. However, in addition to the axial and lateral strain images, shear strain estimates provide supplementary information on the bonding between a tumor and the surrounding tissue. Shear strain estimates characterize breast masses based on their mobility or attachment to background tissue (Konofagou et al. 2000; Thitaikumar et al. 2007). The shear strain tensor along the imaging or scanning plane is defined by
| (1) |
where z and x represent the axial and lateral directions, respectively.
In previous work on shear strain imaging (Konofagou et al. 2000; Thitaikumar et al. 2008) only one component (first term in Eq. 1) of the shear strain tensor, referred to as the axial-shear strain, was estimated. We are limited to the estimation of this feature due to the increased noise artifacts present when lateral displacements are estimated from radiofrequency data collected only along the backscatter direction. Using simulation and in vivo breast data, ThitaiKumar et al. (2007; 2008) showed the potential to utilize axial-shear strain information for distinguishing benign from malignant breast tumors. Methods to estimate the axial, lateral and shear strain tensor have also been described in the literature. Konofagou and Ophir (1998) have described an algorithm for the estimation of both axial and lateral displacements and thereby the axial, lateral and shear strain tensor using weighted interpolation between neighboring RF A-lines in the lateral direction along with iterative correction of lateral and axial displacements. Techavipoo et al. (2004) have presented a method to estimate the displacement vector using RF echo signal data acquired along multiple angular insonification directions to estimate the axial, lateral and shear strain tensors. This has also been implemented using beam steering on a linear array transducer, enabling its use on clinical ultrasound systems (Rao et al. 2007). The assumption of incompressibility has also been utilized to estimate lateral strains from the axial strain estimated (Lubinski et al. 1996).
Viola et al. (2002) and Rao et al. (2007) have also investigated the use of lateral shear deformations to enhance the shear strain visualized on tissue-mimicking phantoms. Their results indicated that shear strain elastography can characterize regions of increased bonding between the lesions and background tissue. They also presented theoretical analysis on signal decorrelation that suggested that this technique may introduce larger shearing strains, thereby improving the signal to noise ratio of the estimated shear strain to techniques that utilize a uniaxial compression.
The feasibility and repeatability of in-vivo axial-shear strain imaging for breast cancer diagnosis is investigated in this paper using in-vivo data acquired during freehand palpation imaging (Hall et al. 2003). In order to avoid any bias in the selection of the axial-shear strain region, the entire area of the axial-shear strain around the lesion was estimated automatically using a computer program and used to generate the normalized axial-shear strain area (NASSA) feature value. The purpose of this study was to demonstrate the feasibility of utilizing axial-shear strain images for breast tumor classification using freehand compression and a computer-based feature-selection method.
Background
Since cancers infiltrate into surrounding normal tissue and evoke a desmoplastic scirrhous reaction, the hypothesis is that they may be far less mobile than fibroadenomas; and therefore do not slip during compression or deformations as do fibroadenomas (Skaane and Engedal 1998). Axial-shear strain images estimated from the axial strain tensor has the potential for clearly depicting any sliding or slippage of such masses that may occur during a uniaxial or shear deformation of tissue.
In quasi-static elastography, we typically estimate the axial differential displacements (along the direction of insonification/deformation) using time-delay estimation techniques on frames of RF echo-signals acquired before and after a small amount (typically 1%) of deformation. Axial strain is then computed from the gradient of the tissue displacements, along the beam direction, while the axial shear strain images are obtained from the gradient across the beam direction, described mathematically in Eq. (1).
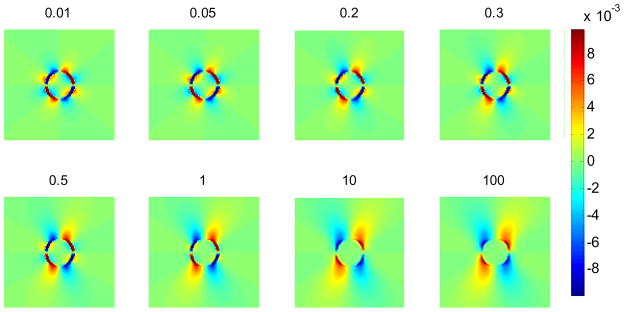
Results obtained using finite element analyses (FEA) using ANSYS (ANSYS Inc., Pittsburgh, PA, USA), demonstrate the potential of determining a threshold that would enable differentiation of benign from malignant masses. This criterion is based on the axial-shear strain area differences observed on axial-shear strain images of the masses. Figure 1 shows FEA simulation results of axial-shear strain images for an inclusion phantom for different values of the coefficient of friction at the interface between the inclusion and the background. Here the inclusion/background interface is modeled using contact elements and the degree of bonding at the interface varied by adjusting the coefficient of friction. The inclusion is three times stiffer than the background. The phantom was subjected to a compressive deformation of 1%. Observe that the area of the axial-shear strain (blue and red region) at the interface is larger for the bound inclusion (lower right) than the unbound inclusion (upper left).
Figure 1.
Axial-shear strain images obtained using an FEA simulation at different coefficients of friction between the inclusion and the background. The colorbar range is the same for all the shear strain images, where a 1% strain is depicted as a 0.01 level.
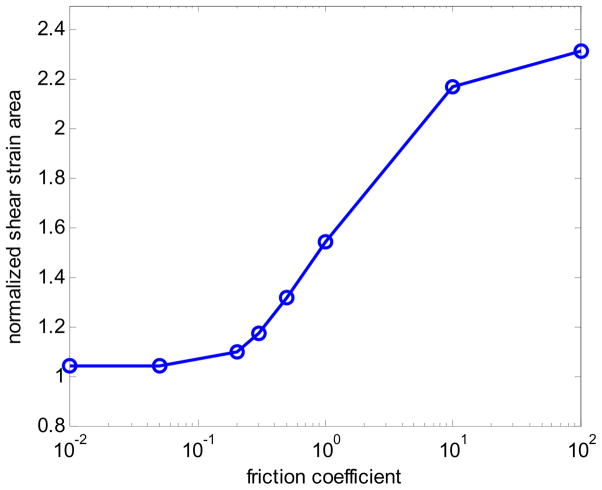
Apart from the bonding at the interface of the inclusion and the background, the other mechanical modeling parameters that affect the axial-shear strain distribution pattern include: the applied deformation, inclusion-background Young’s modulus contrast, and the dimensions of the inclusion. The axial-shear strain distribution must be normalized to reduce the effect of these parameters. We thus obtain normalized axial-shear strain area (NASSA) feature values that are sensitive only to the bonding conditions between the inclusion and the background. Figure 2 plots the NASSA value as a function of the coefficient of friction. The NASSA value was obtained using the following steps: 1) Set a threshold for segmenting the axial-shear strain (20% of the applied compression); 2) Find the region where the magnitude of the axial-shear strain is larger than the threshold; 3) Normalize the area obtained in 2) to the inclusion size. Observe from the plot that the area of the axial-shear strain distribution depends on the degree of bonding at the interface. The trend of the curve is similar to that presented by ThitaiKumar et al. (2007).
Figure 2.
Plot of NASSA values as a function of friction coefficient predicted using FEA simulation.
Materials and Methods
Patient Scans
The study was approved by the UW-Madison institutional review board (IRB) protocol number 2003-074. The primary criterion for inclusion was an adult female who gave informed consent and was scheduled for a biopsy of an isolated solid breast lesion (i.e. BI-RADS score 4 or 5), at the University of Wisconsin Hospitals and Clinics Breast Center. Only lesions that fit within the 4 cm width of the linear array transducer were scanned for this study. Exclusion criteria were patients with prior surgery or radiotherapy of the breast because of possible scarring.
In-vivo data were acquired at the UW Breast Center using a Siemens Antares real-time clinical scanner (Siemens Ultrasound, Mountain View, CA, USA) equipped with a VFX13-5 linear array transducer. Patient scanning was performed in a manner consistent with a normal breast ultrasound examination. The breast was scanned with the patient (typically) in the supine position with her ipsilateral arm behind her head. Data were acquired during a freehand palpation or deformation of the breast using the ultrasound transducer. Patients were alert during the ultrasound scans and therefore could provide immediate feedback to the sonographer regarding discomfort due to breast deformation. Freehand compression of up to 10% using the ultrasound transducer was utilized for acquiring RF data loops that were used to generate the axial strain and axial-shear strain images.
A total of 41 patients were scanned. The mean age was 46.2 ± 13.6 years with age ranging from 20–87 years. The mean height and width of the lesions were 1.39 ± 0.72 cm and 1.27 ± 0.76 cm respectively obtained from the ultrasound B-mode images. Madsen et al. (2005) have reported that lesions as small as 0.2 mm can be detected with axial strain imaging in tissue-mimicking phantoms. Histopathological results of the biopsy performed were considered the reference standard in the cases analyzed; 8 malignant masses and 33 fibroadenomas were included.
For each case, 160 RF data frames were collected, from which we select the frame with the best axial strain image quality (based on the normalized value of the correlation coefficient). In general, only a pair of pre-and post compression frames are required to generate the axial strain and shear strain images. All the data processing for shear strain images in this paper was performed offline.
Axial Strain and axial-shear strain imaging
Local axial displacements were estimated using a two-dimensional (2D) multi-level motion tracking algorithm (Shi and Varghese 2007). The first step involves estimation of a coarse displacement estimate utilizing sub-sampled B-mode or envelope signals. This coarse displacement estimate is then used to guide the final cross-correlation stage on RF data. In this study, we used a 2D kernel, which is approximately five wavelengths along the axial direction and three A-lines along the lateral direction, to compute the cross-correlation function and to determine the final displacement estimate. For each step of this algorithm, the normalized cross-correlation coefficient value was used as the matching criteria. The peak value of the normalized cross-correlation function at each step was recorded to generate an image of the local correlation coefficients. The axial strain and the axial-shear strain tensor were estimated using a least squares strain estimator (LSQSE) (Kallel and Ophir 1997). All the RF data frames in the data loop were processed to obtain axial strain and axial-shear strain images and corresponding correlation coefficient maps. The frame with the highest mean correlation coefficient was regarded as the frame that produced the best quality axial strain image and was used for the study.
Axial-shear Strain feature analysis
Several features extracted from the axial-shear strain images can be used to differentiate benign from malignant tumors (Thitaikumar et al. 2007). In this study, we utilize the “normalized area of the axial-shear strain region (NASSA)” for the differentiation and classification of breast tumors. It was shown in (Thitaikumar et al. 2007) that the area of the axial-shear strain region must be normalized to the area of the tumor, applied axial compressive strain, and tumor-background modulus contrast. In order to normalize the area of axial-shear strain region for the size of the lesion, the lesion size measured from the ultrasound B-mode image or the corresponding axial strain image can be utilized. In this study, we measure the lesion dimensions from the axial strain image. The lesions are significantly stiffer than the background tissue, enabling clear delineation of the lesion from the background tissue.
The normalization for applied axial compression and modulus contrast was done by setting the contour threshold for segmenting the axial-shear strain region as 20% of the mean applied axial strain times 20% of the background-tumor strain contrast. Here the strain contrast is defined as the ratio between the mean axial strains estimated in the background to that estimated within the breast mass. Since the elastic modulus contrast is not known, we use the axial strain contrast to approximate the modulus contrast. The mean applied axial strain and the strain contrast were computed from a single axial strain image. The mean applied strain is the same as the mean axial strain in the tissue background. Two ROIs were selected one inside the breast mass and the second in the surrounding background tissue. The mean axial strain value was then computed over the pixels or local strain estimates within the selected ROIs.
For the computation of the NASSA feature, we therefore, utilize all the areas of the axial-shear strain region that overlap on the ultrasound B-mode image to estimate the normalized feature value, which is calculated by the ratio of the summation of these areas to the tumor inclusion area. In addition, only those pixels with axial-shear strain values greater than the threshold along with the corresponding correlation coefficient value greater than 0.75 were overlaid on the corresponding ultrasound B-mode image to obtain the composite image.
Statistical Analysis
A two sample t-test with two separate and independent groups comprising the benign and malignant patients, are utilized to evaluate the statistical significance of the results. For the t-test analysis, we set the NASSA values of 33 benign tumors as a group, while the NASSA values of patients diagnosed with 8 malignant tumors comprise the second group. The two groups have different sample sizes, and are assumed to be independent with unequal variance. The Null Hypothesis is that the mean NASSA value of benign masses are larger than or equal to the mean NASSA values of the malignant masses. Based on these assumptions, we get a p-value < e−12, rejecting the null hypothesis. The t-test analysis indicates that the NASSA values for malignant are significantly larger than that for benign masses with the difference being statistically significant.
A Receiver Operating Characteristic (ROC) analysis was also performed using the NASSA values obtained for the benign and malignant masses. For the ROC analysis, we choose the NASSA values for the 8 malignant tumors as the True category, and the NASSA values of the 33 benign tumors as the False category. We set the threshold increasing from 0 to the maximum output of the NASSA value and the step increase was set to 0.001. The true positive faction (TPF) represents the True category being greater than the threshold during each step. Similarly, the false positive fraction (FPF) denotes the False category greater than the threshold during each step. Finally, we plot TPF along the y-axis and 1-FPF along the x-axis to obtain the ROC curve. The area under the curve (AUC) is a non-parametric value that describes the performance of the test.
Results
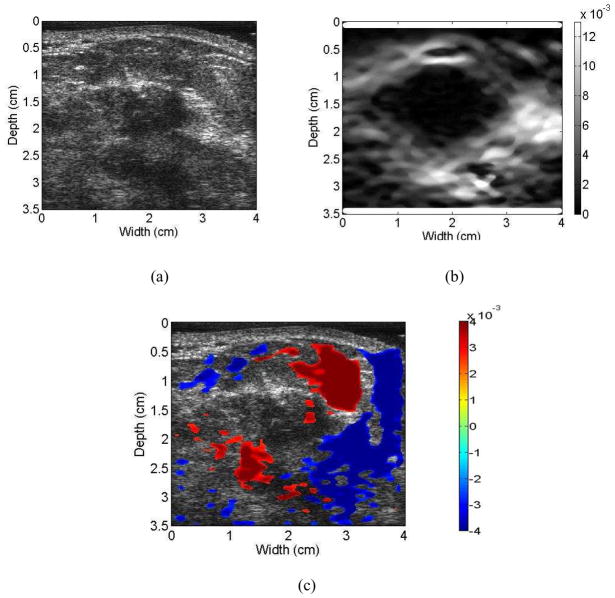
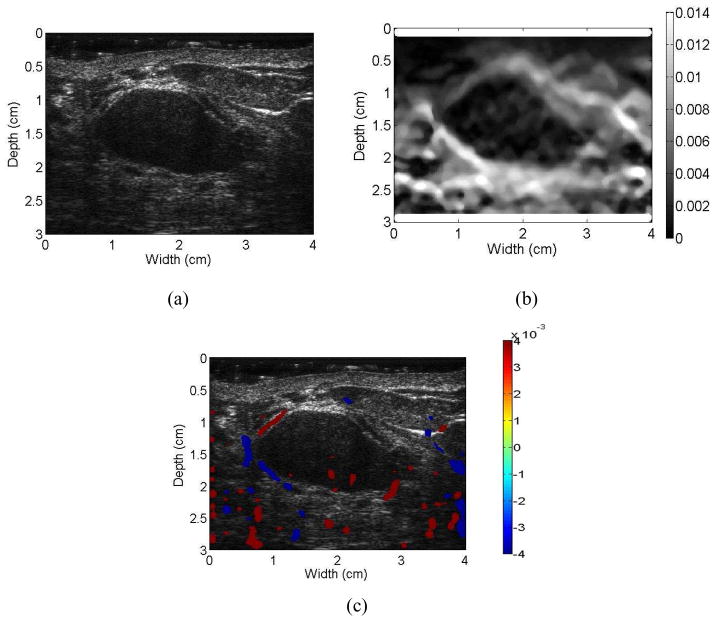
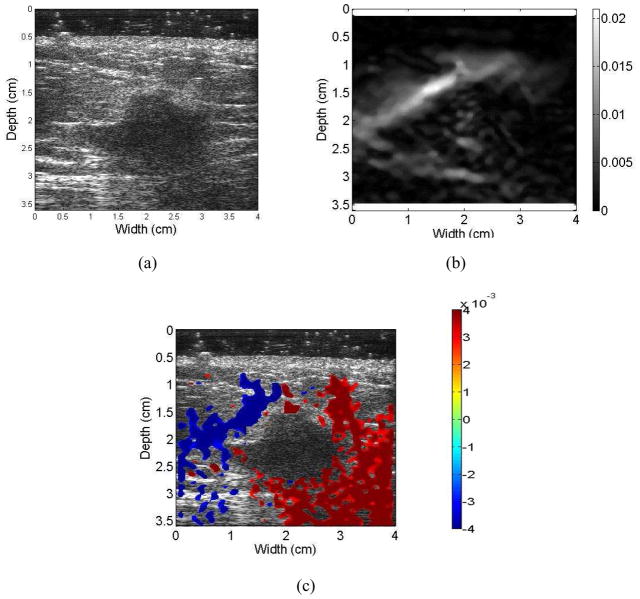
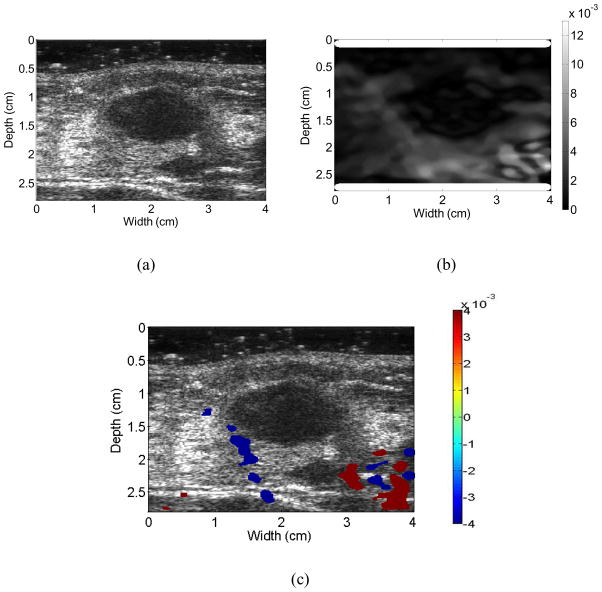
Figures 3 to 6 show examples of the ultrasound B-mode, axial strain image, and axial-shear strain image superimposed on the corresponding ultrasound B-mode images of malignant and benign breast masses, respectively. The blue regions indicate negative axial-shear strain values while the red areas represent positive values. Observe that the area of the axial-shear strain region is larger for malignant tumors than for benign masses, which is consistent with the result observed from simulations in Fig. 1. Note also that the blue and red patterns occur further away from the borders of the malignant masses visualized on the corresponding B-mode image, in contrast to benign masses where the axial-shear strain patterns are seen at the lesion boundary. The location of the axial-shear strain patterns for malignant masses could be due to the desmoplastic reaction, which is also hypothesized to be a factor in the depiction of malignant breast masses with larger dimensions on the axial strain images when compared to the B-mode image. Histopathological identification of the benign and malignant breast masses described in this paper is provided in Table 1.
Figure 3.
Ultrasound B-mode (a) image for a patient diagnosed with an invasive ductal carcinoma along with the corresponding axial strain (b), and the axial-shear strain image patterns superimposed on the B-mode image forming a composite image (c). Note that the NASSA value for this patient was 1.64. The colorbar range is the same for all the axial strain and shear strain images, respectively where a 1% strain is depicted as a 0.01 level.
Figure 6.
Images for a patient diagnosed with a benign fibroadenoma. Ultrasound B-mode (a), Axial-shear strain (b), and composite image obtained by superimposing the axial-shear strain patterns on the ultrasound B-mode image (c). Note that the NASSA value for this patient was 0.48. The colorbar range is the same for all the axial strain and shear strain images, respectively where a 1% strain is depicted as a 0.01 level.
Table 1.
Histopathology
| Type and Sub-type | # |
|---|---|
| Malignant | 8 |
| Invasive ductal carcinoma (IDC) | 7 |
| IDC (not otherwise specified) | 4 |
| Tubular | 1 |
| Intracystic Papillary | 1 |
| DCIS with microinvasion | 1 |
| Invasive lobular carcinoma | 1 |
| Benign | 33 |
| Fibroadenoma | 33 |
Unlike the simulation results reported in (Thitaikumar et al. 2007) and also shown in Fig. 1, we do not obtain a symmetric pattern in all the quadrants around the tumor. In most cases we observe axial-shear strain patterns only above the breast mass, probably due to the complex in-vivo boundary conditions and the reduced ultrasonic signal-to-noise ratio below the breast mass under in-vivo imaging conditions. However, in some instances, we are able to visualize the complete axial-shear strain pattern in cases with adequate ultrasonic signal-to-noise ratio levels as illustrated in Fig. 3. In addition, observe that the shear strain patterns for the malignant masses in Figs. 3 and 4 mimic the shear strain patterns observed for friction coefficient greater than 1 in Fig. 1. In a similar manner the shear strain patterns for the benign masses in Figs. 5 and 6 mimic the shear strain patterns for friction coefficients less than 0.2 shown in Fig. 1. For benign masses such as fibroadenomas, mass slippage is observed only around the boundary of the mass with respect to the background. In addition, while applying the deformation necessary for strain imaging, care is always taken to keep the breast mass within the imaging plane. Both of these factors contribute to the low levels of shear strain observed at the boundaries of fibroadenomas.
Figure 4.
Ultrasound B-mode (a) image for a patient diagnosed with invasive lobular carcinoma along with the corresponding axial strain (b), and the axial-shear strain image patterns superimposed on the B-mode image forming a composite image (c). Note that the NASSA value for this patient was 1.28. The colorbar range is the same for all the axial strain and shear strain images, respectively where a 1% strain is depicted as a 0.01 level.
Figure 5.
Images for a patient diagnosed with a benign mass, namely a fibroadenoma. Ultrasound B-mode (a), Axial-shear strain (b), and composite image obtained by superimposing the axial-shear strain patterns on the ultrasound B-mode image (c). Note that the NASSA value for this patient was 0.72. The colorbar range is the same for all the axial strain and shear strain images, respectively where a 1% strain is depicted as a 0.01 level.
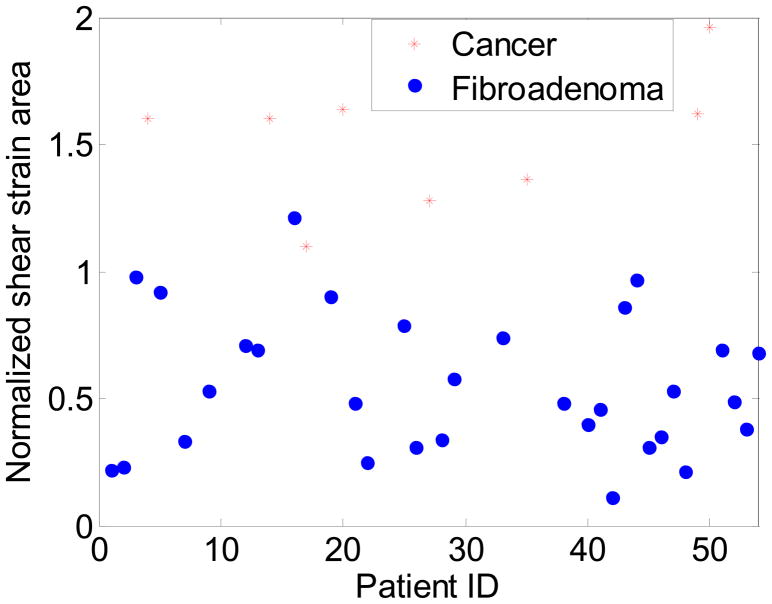
Figure 7 presents a scatter plot of the NASSA feature values over the number of patients that were scanned. There is a statistically significant difference between NASSA feature values for malignant versus benign masses (p < 3.4175e−6). Note that the NASSA values for patients with cancerous masses are larger than those compared to patients with benign masses. Most of the fibroadenoma exhibit a feature value smaller than 1, while all the 8 cancers exhibit a feature value greater than 1. The feature value for the only patient with the benign mass with a NASSA value greater than the threshold (equal to 1.21) is partly due to the fact that axial-shear strain image of this patient included large noise artifacts.
Figure 7.
Scatter plot of the NASSA values obtained for the 33 patients with benign masses and the 8 patients diagnosed with malignant tumors.
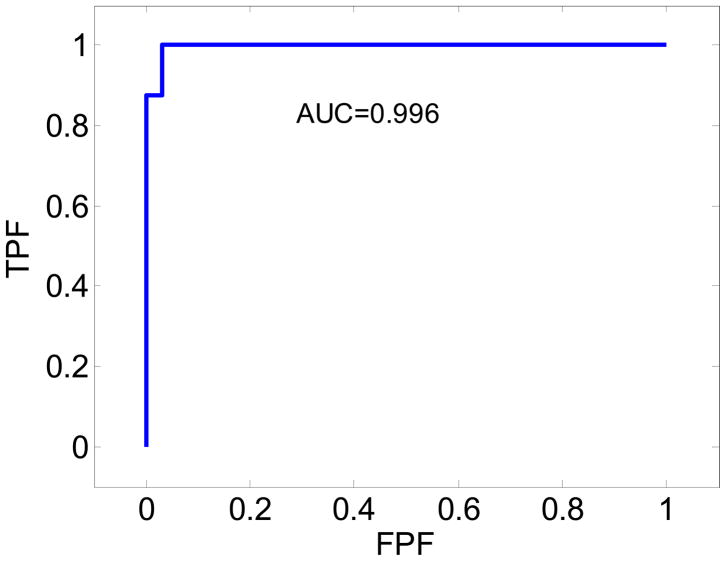
ROC analysis also demonstrates the improvement in the classification obtained using the NASSA feature as illustrated in Figure 8. The ROC curve obtained using the NASSA feature value shows a very high AUC value of 0.996 which suggests that this method can accurately and effectively differentiate malignant tumors from the benign masses.
Figure 8.
ROC curve obtained from the utilization of the NASSA values for the 33 patients with benign masses and the 8 patients diagnosed with malignant tumors.
Discussion and Conclusions
In this paper, we illustrate the feasibility of obtaining axial-shear strain images under in vivo imaging conditions. Both the axial strain and axial-shear strain images were obtained from the same RF pre- and post-deformation data set. The axial strain image provides information on the dimensions of the tumor and tumor/background strain contrast, which is utilized to normalize the axial-shear strain area feature obtained from axial-shear strain images. Previous reports by Garra et al. (1997) and Hall et al. (2003) have demonstrated that the lesion size ratio feature estimates obtained from axial strain and corresponding B-mode images can be used for differentiating benign from malignant breast masses. They found that malignant lesions tend to be depicted as larger masses on axial strain images than on the ultrasound B-mode images, while benign lesions for example fibroadenomas usually appear to be smaller or of the same size on B-mode images (Garra et al. 1997; Hiltawsky et al. 2001; Hall et al. 2003; Regner et al. 2006; Burnside et al. 2007). Burnside et al (2007) reported that the average area under the ROC curve of 0.903 using axial strain based features compared to 0.876 obtained using only ultrasound B-mode features. The axial-shear strain images, however, may provide additional information along with axial strain and B-mode images, to improve the performance of breast tumor classification.
In this study, the data acquisition involved free-hand deformations, which is convenient to perform but is more likely to introduce errors due to lateral and elevational tissue motion. A total of 160 RF frames were acquired for each patient and used to estimate displacement and strains. However, only axial strain and axial-shear strain images with high values of the normalized correlation coefficient value were selected for classification. Stepper motor controlled compression could be applied to obtain a specified deformation increment and fewer data sets for processing. Another advantage of motor controlled compression is that the applied deformation is known and there is no need to estimate the average compression from the axial strain image as was done in this study. This would also make it easier to set the threshold for segmenting the axial-shear strain region. However, stepper motor controlled compression require five degrees of freedom (three translational and two rotational motorized stages for adequate motion control and is not as flexible as freehand scanning of the patient.
In order to avoid bias in the choice of the axial-shear strain region, a computer based feature selection approach was utilized. As shown in Figs. 3 to 6 we do not obtain a symmetric pattern in all the quadrants around the tumor as depicted in the simulation results shown in Fig. 1 and also reported in Thitaikumar et al. (2007). Therefore, we take into consideration the entire area of the axial-shear strain region that overlaps on the B-mode image to estimate the NASSA value rather than choosing one or two quadrants as described by ThitaiKumar et al. (2007). In addition, all pixels with NASSA values greater than the threshold value and corresponding correlation coefficient values greater than 0.75 were selected to be overlaid on the ultrasound B-mode image.
The data set used for the in-vivo classification study consisted of 33 benign and 8 malignant breast tumor cases. Even though the size of the data set reported is not large, the preliminary data demonstrates the potential of axial-shear strain elastography for the classification and differentiation of breast masses. It is expected that we would encounter an increased variety of axial-shear strain distribution patterns with an increase in the data set. However, the discriminant feature value namely NASSA should stabilize by incorporating additional studies on larger patient datasets that involve more observers. Close inspection of the malignant masses in our population may also prove instructive. As expected, the majority of malignancies were invasive ductal carcinoma (7) but two interesting histologic subtypes were encountered in our dataset: a tubular cancer, and an intracystic papillary carcinoma. Each of these malignancies is low grade, has a low risk of positive margins at definitive surgical resection, and carries a substantially improved prognosis. Interestingly our shear strain data indicates firm attachment of the tumor to the background tissue. In addition, our single case of lobular carcinoma, a malignancy that is well known to be more extensive on pathology than on imaging shows high shear strain possibly indicating disease beyond the margins identified at imaging as illustrated in Fig. 4. Based on this preliminary data, shear strain imaging may be valuable in assessing the extent of disease beyond the image margins, thus more accurately assessing their size as well as differentiating benign from malignant tumors. Further research to validate this hypothesis is warranted.
The ROC analysis also demonstrates the improvement in the classification performance obtained using the NASSA feature. In fact, the NASSA provides excellent discrimination of malignant and benign masses with an area under the curve of 0.996 (see Figure 8). If we set the threshold to be approximately 1.10, NASSA achieves a sensitivity of 100% and a specificity of 99%.
The current study is limited to 2D imaging in which only one single slice is acquired to produce axial-shear strain images. The pattern of axial-shear strain, however, would vary with the location of the image plane due to the irregular shape of the tumor. With the use of 2D array transducers under real-time 3D imaging conditions, it would be desirable to obtain 3D axial-shear strain images and volumetric feature values to better predict the utility of the axial-shear strain images in classifying breast tumors.
In this preliminary investigation, we find that axial-shear strain images may provide important information which could compliment axial strain and B-mode images to improve classification of breast masses on ultrasound.
Acknowledgments
This work was supported in part by the Komen foundation grant BCTR0601153 and NIH grants R01CA112192-S103, R21 EB003853, R01CA100373 and R01 CA111289.
Footnotes
Publisher's Disclaimer: This is a PDF file of an unedited manuscript that has been accepted for publication. As a service to our customers we are providing this early version of the manuscript. The manuscript will undergo copyediting, typesetting, and review of the resulting proof before it is published in its final citable form. Please note that during the production process errors may be discovered which could affect the content, and all legal disclaimers that apply to the journal pertain.
References
- ACS 2009. Cancer Facts & Figures . 2009. pp. 1–68. [Google Scholar]
- Bercoff J, Chaffai S, Tanter M, Sandrin L, Catheline S, Fink M, Gennisson JL, Meunier M. In vivo breast tumor detection using transient elastography. Ultrasound Med Biol. 2003;29(10):1387–96. doi: 10.1016/s0301-5629(03)00978-5. [DOI] [PubMed] [Google Scholar]
- Berg WA. Sonographically depicted breast clustered microcysts: is follow-up appropriate? AJR Am J Roentgenol. 2005;185(4):952–9. doi: 10.2214/AJR.04.0929. [DOI] [PubMed] [Google Scholar]
- Berg W, Blume J, Cormack J, Mendelson E, Lehrer D, Bohm-Velez M, Pisano E, Jong R, Evans W, Morton M, et al. Combined screening with ultrasound and mammography vs mammography alone in women at elevated risk of breast cancer. JAMA. 2008;299(18):2151. doi: 10.1001/jama.299.18.2151. [DOI] [PMC free article] [PubMed] [Google Scholar]
- Bertrand M, Meunier J, Doucet M, Ferland G. Ultrasonic biomechanical strain gauge based on speckle tracking. IEEE 1989 Ultrasonics Symposium Proceedings. 1989;2:859–863. [Google Scholar]
- Burnside E, Hall T, Sommer A, Hesley G, Sisney G, Svensson W, Fine J, Jiang J, Hangiandreou N. Differentiating benign from malignant solid breast masses with US strain imaging. Radiology. 2007;245(2):401. doi: 10.1148/radiol.2452061805. [DOI] [PubMed] [Google Scholar]
- Chang Y, Kwon K, Goo D, Choi D, Lee H, Yang S. sonographic differentiation of benign and malignant cystic lesions of the breast. J Ultrasound Med. 2007;26(1):47–53. doi: 10.7863/jum.2007.26.1.47. [DOI] [PubMed] [Google Scholar]
- Chen E, Adler R, Carson P, Jenkins W, O’BRIEN W. Ultrasound tissue displacement imaging with application to breast cancer. Ultrasound in medicine & biology. 1995;21(9):1153–1162. doi: 10.1016/0301-5629(95)02005-5. [DOI] [PubMed] [Google Scholar]
- Chen S, Cheung Y, Su C, Chen M, Hwang T, Hsueh S. Analysis of sonographic features for the differentiation of benign and malignant breast tumors of different sizes. Ultrasound in Obstetrics and Gynecology. 2004;23(2):188–93. doi: 10.1002/uog.930. [DOI] [PubMed] [Google Scholar]
- Cho N, Moon WK, Kim HY, Chang JM, Park SH, Lyou C. Sonoelastographic strain index for differentiation of benign and malignant nonpalpable breast masses. J Ultrasound Med. 2010;29(1):1–7. doi: 10.7863/jum.2010.29.1.1. [DOI] [PubMed] [Google Scholar]
- Chung SY, Moon WK, Choi JW, Cho N, Jang M, Kim KG. Differentiation of benign from malignant nonpalpable breast masses: a comparison of computer-assisted quantification and visual assessment of lesion stiffness with the use of sonographic elastography. Acta Radiol. 2010;51(1):9–14. doi: 10.3109/02841850903273966. [DOI] [PubMed] [Google Scholar]
- Cole-Beuglet C, Soriano R, Kurtz A, Goldberg B. Fibroadenoma of the breast: sonomammography correlated with pathology in 122 patients. American Journal of Roentgenology. 1983;140(2):369–375. doi: 10.2214/ajr.140.2.369. [DOI] [PubMed] [Google Scholar]
- Emine D, Suzana M, Halit Y, Arben K. Comparative accuracy of mammography and ultrasound in women with breast symptoms according to age and breast density. Bosnian journal of basic medical sciences. 2009;9:131–136. doi: 10.17305/bjbms.2009.2832. [DOI] [PMC free article] [PubMed] [Google Scholar]
- Frey H. Realtime elastography. A new ultrasound procedure for the reconstruction of tissue elasticity. Radiologe. 2003;43(10):850–5. doi: 10.1007/s00117-003-0943-2. [DOI] [PubMed] [Google Scholar]
- Garra B, Cespedes E, Ophir J, Spratt S, Zuurbier R, Magnant C, Pennanen M. Elastography of breast lesions: initial clinical results. Radiology. 1997;202(1):79–86. doi: 10.1148/radiology.202.1.8988195. [DOI] [PubMed] [Google Scholar]
- Hall T, Zhu Y, Spalding C. In vivo real-time freehand palpation imaging. Ultrasound in medicine & biology. 2003;29(3):427–435. doi: 10.1016/s0301-5629(02)00733-0. [DOI] [PubMed] [Google Scholar]
- Hiltawsky K, Kruger M, Starke C, Heuser L, Ermert H, Jensen A. Freehand ultrasound elastography of breast lesions: clinical results. Ultrasound in Medicine and Biology. 2001;27(11):1461–1470. doi: 10.1016/s0301-5629(01)00434-3. [DOI] [PubMed] [Google Scholar]
- Hong AS, Rosen EL, Soo MS, Baker JA. BI-RADS for sonography: positive and negative predictive values of sonographic features. AJR Am J Roentgenol. 2005;184(4):1260–5. doi: 10.2214/ajr.184.4.01841260. [DOI] [PubMed] [Google Scholar]
- Horsch K, Giger M, Vyborny C, Lan L, Mendelson E, Hendrick R. Classification of breast lesions with multimodality computer-aided diagnosis: observer study results on an independent clinical data set. Radiology. 2006;240(2):357. doi: 10.1148/radiol.2401050208. [DOI] [PubMed] [Google Scholar]
- Kallel F, Ophir J. A least-squares strain estimator for elastography. Ultrasonic imaging. 1997;19(3):195–208. doi: 10.1177/016173469701900303. [DOI] [PubMed] [Google Scholar]
- Kolb T, Lichy J, Newhouse J. Comparison of the performance of screening mammography, physical examination, and breast US and evaluation of factors that influence them: an analysis of 27,825 patient evaluations. Radiology. 2002;225(1):165. doi: 10.1148/radiol.2251011667. [DOI] [PubMed] [Google Scholar]
- Konofagou E, Harrigan T, Ophir J. Shear strain estimation and lesion mobility assessment in elastography. Ultrasonics. 2000;38(1–8):400–404. doi: 10.1016/s0041-624x(99)00125-0. [DOI] [PubMed] [Google Scholar]
- Konofagou E, Ophir J. A new elastographic method for estimation and imaging of lateral displacements, lateral strains, corrected axial strains and Poisson’s ratios in tissues. Ultrasound in Medicine and Biology. 1998;24:1183–1200. doi: 10.1016/s0301-5629(98)00109-4. [DOI] [PubMed] [Google Scholar]
- Krouskop T, Dougherty D, Vinson F. A pulsed Doppler ultrasonic system for making noninvasive measurements of the mechanical properties of soft tissue. Journal of rehabilitation research and development. 1987;24(2):1–8. [PubMed] [Google Scholar]
- Kuhl C, Schrading S, Leutner C, Morakkabati-Spitz N, Wardelmann E, Fimmers R, Kuhn W, Schild H. Mammography, breast ultrasound, and magnetic resonance imaging for surveillance of women at high familial risk for breast cancer. Journal of clinical oncology. 2005;23(33):8469. doi: 10.1200/JCO.2004.00.4960. [DOI] [PubMed] [Google Scholar]
- Leibman A, Lewis M, Kruse B. Tubular carcinoma of the breast: mammographic appearance. American Journal of Roentgenology. 1993;160(2):263–265. doi: 10.2214/ajr.160.2.8424330. [DOI] [PubMed] [Google Scholar]
- Lubinski M, Emelianov S, Raghavan K, Yagle A, Skovoroda A, O’Donnell M. Lateral displacement estimation using tissue incompressibility. IEEE Transactions on Ultrasonics Ferroelectrics and Frequency Control. 1996;43(2):247–256. doi: 10.1109/58.660158. [DOI] [PubMed] [Google Scholar]
- Madsen EL, Frank GR, Hobson MA, Shi H, Jiang J, Varghese T, Hall TJ. Spherical lesion phantoms for testing the performance of elastography systems. Phys Med Biol. 2005;50(24):5983–95. doi: 10.1088/0031-9155/50/24/015. [DOI] [PMC free article] [PubMed] [Google Scholar]
- Mainiero MB, Goldkamp A, Lazarus E, Livingston L, Koelliker SL, Schepps B, et al. Characterization of breast masses with sonography: can biopsy of some solid masses be deferred? J Ultrasound Med. 2005;24(2):161–7. doi: 10.7863/jum.2005.24.2.161. [DOI] [PubMed] [Google Scholar]
- Mariappan YK, Glaser KJ, Manduca A, Romano AJ, Venkatesh SK, Yin M, Ehman RL. High-frequency mode conversion technique for stiff lesion detection with magnetic resonance elastography (MRE) Magn Reson Med. 2009;62(6):1457–65. doi: 10.1002/mrm.22091. [DOI] [PMC free article] [PubMed] [Google Scholar]
- Moon W, Myung J, Lee Y, Park I, Noh D, Im J. US of Ductal Carcinoma In Situ 1. RadioGraphics. 2002;22(2):269–281. doi: 10.1148/radiographics.22.2.g02mr16269. [DOI] [PubMed] [Google Scholar]
- Moon WK, Huang CS, Shen WC, Takada E, Chang RF, Joe J, Nakajima M, Kobayashi M. Analysis of elastographic and B-mode features at sonoelastography for breast tumor classification. Ultrasound Med Biol. 2009;35(11):1794–802. doi: 10.1016/j.ultrasmedbio.2009.06.1094. [DOI] [PubMed] [Google Scholar]
- Nightingale KR, Kornguth PJ, Walker WF, McDermott BA, Trahey GE. A novel ultrasonic technique for differentiating cysts from solid lesions: preliminary results in the breast. Ultrasound Med Biol. 1995;21(6):745–51. doi: 10.1016/0301-5629(95)00020-r. [DOI] [PubMed] [Google Scholar]
- Nightingale KR, Kornguth PJ, Trahey GE. The use of acoustic streaming in breast lesion diagnosis: a clinical study. Ultrasound Med Biol. 1999;25(1):75–87. doi: 10.1016/s0301-5629(98)00152-5. [DOI] [PubMed] [Google Scholar]
- Ophir J, Alam S, Garra B, Kallel F, Konofagou E, Krouskop T, Varghese T. Elastography: ultrasonic estimation and imaging of the elastic properties of tissues. Proceedings of the Institution of Mechanical Engineers, Part H: Journal of Engineering in Medicine. 1999;213(3):203–233. doi: 10.1243/0954411991534933. [DOI] [PubMed] [Google Scholar]
- Ophir J, Cespedes I, Ponnekanti H, Yazdi Y, Li X. Elastography: A quantitative method for imaging the elasticity of biological tissues. Ultrasonic imaging. 1991;13(2):111–134. doi: 10.1177/016173469101300201. [DOI] [PubMed] [Google Scholar]
- Parker K, Huang S, Musulin R, Lerner R. Tissue response to mechanical vibrations for sonoelasticity imaging. Ultrasound in medicine & biology. 1990;16(3):241–246. doi: 10.1016/0301-5629(90)90003-u. [DOI] [PubMed] [Google Scholar]
- Rahbar G, Sie A, Hansen G, Prince J, Melany M, Reynolds H, Jackson V, Sayre J, Bassett L. Benign versus Malignant Solid Breast Masses: US Differentiation 1. Radiology. 1999;213(3):889–894. doi: 10.1148/radiology.213.3.r99dc20889. [DOI] [PubMed] [Google Scholar]
- Rao M, Chen Q, Shi H, Varghese T, Madsen E, Zagzebski J, Wilson T. Normal and shear strain estimation using beam steering on linear-array transducers. Ultrasound in medicine & biology. 2007;33(1):57–66. doi: 10.1016/j.ultrasmedbio.2006.07.027. [DOI] [PMC free article] [PubMed] [Google Scholar]
- Regner D, Hesley G, Hangiandreou N, Morton M, Nordland M, Meixner D, Hall T, Farrell M, Mandrekar J, Harmsen W, et al. Breast Lesions: Evaluation with US Strain Imaging-Clinical Experience of Multiple Observers 1. Radiology. 2006;238(2):425–437. doi: 10.1148/radiol.2381041336. [DOI] [PMC free article] [PubMed] [Google Scholar]
- Schaefer FK, Heer I, Schaefer PJ, Mundhenke C, Osterholz S, Order BM, Hofheinz N, Hedderich J, Heller M, Jonat W, Schreer I. Breast ultrasound elastography-Results of 193 breast lesions in a prospective study with histopathologic correlation. Eur J Radiol. 2009 doi: 10.1016/j.ejrad.2009.08.026. [DOI] [PubMed] [Google Scholar]
- Siegmann KC, Xydeas T, Sinkus R, Kraemer B, Vogel U, Claussen CD. Diagnostic value of MR elastography in addition to contrast-enhanced MR imaging of the breast-initial clinical results. Eur Radiol. 2010;20(2):318–25. doi: 10.1007/s00330-009-1566-4. [DOI] [PubMed] [Google Scholar]
- Shi H, Varghese T. Two-dimensional multi-level strain estimation for discontinuous tissue. Physics in Medicine and Biology. 2007;52(2):389–402. doi: 10.1088/0031-9155/52/2/006. [DOI] [PubMed] [Google Scholar]
- Skaane P, Engedal K. Analysis of sonographic features in the differentiation of fibroadenoma and invasive ductal carcinoma. American Journal of Roentgenology. 1998;170(1):109–114. doi: 10.2214/ajr.170.1.9423610. [DOI] [PubMed] [Google Scholar]
- Smart C, Hendrick R, Rutledge J, III, Smith R. Benefit of mammography screening in women ages 40 to 49 years. Current evidence from randomized controlled trials. Cancer. 1995;75(7):1619–26. doi: 10.1002/1097-0142(19950401)75:7<1619::aid-cncr2820750711>3.0.co;2-t. [DOI] [PubMed] [Google Scholar]
- Stavros A, Thickman D, Rapp C, Dennis M, Parker S, Sisney G. Solid breast nodules: use of sonography to distinguish between benign and malignant lesions. Radiology. 1995;196(1):123–134. doi: 10.1148/radiology.196.1.7784555. [DOI] [PubMed] [Google Scholar]
- Tabar L, Duffy S, Vitak B, Chen H, Prevost T. The natural history of breast carcinoma. Cancer. 1999;86(3):449–462. [PubMed] [Google Scholar]
- Tanter M, Bercoff J, Athanasiou A, Deffieux T, Gennisson JL, Montaldo G, Muller M, Tardivon A, Fink M. Quantitative assessment of breast lesion viscoelasticity: initial clinical results using supersonic shear imaging. Ultrasound Med Biol. 2008;34(9):1373–86. doi: 10.1016/j.ultrasmedbio.2008.02.002. [DOI] [PubMed] [Google Scholar]
- Techavipoo U, Chen Q, Varghese T, Zagzebski J. Estimation of displacement vectors and strain tensors in elastography using angular insonifications. IEEE transactions on medical imaging. 2004;23(12):1479. doi: 10.1109/TMI.2004.835604. [DOI] [PMC free article] [PubMed] [Google Scholar]
- Thitaikumar A, Krouskop T, Garra B, Ophir J. Visualization of bonding at an inclusion boundary using axial-shear strain elastography: a feasibility study. Physics in Medicine and Biology. 2007;52(9):2615–33. doi: 10.1088/0031-9155/52/9/019. [DOI] [PubMed] [Google Scholar]
- Thitaikumar A, Mobbs L, Kraemer-Chant C, Garra B, Ophir J. Breast tumor classification using axial shear strain elastography: a feasibility study. Physics in Medicine and Biology. 2008;53(17):4809–4823. doi: 10.1088/0031-9155/53/17/022. [DOI] [PubMed] [Google Scholar]
- Ueno E, Tohno E, Itoh K. Classification and diagnostic criteria in breast echography. Jpn J Med Ultrasonics. 1986;13:19–31. [Google Scholar]
- Varghese T. Quasi-static ultrasound elastography. Ultrasound Clinics. 2099;4:323–338. doi: 10.1016/j.cult.2009.10.009. [DOI] [PMC free article] [PubMed] [Google Scholar]
- Viola F, Walker W. Shear strain elastography. Proceedings; 2002 IEEE Ultrasonics Symposium; 2002; 2002. pp. 1907–1911. [Google Scholar]


