Abstract
Amperometric detection of S-nitrosothiols (RSNOs) at sub-micromolar levels in blood samples is of potential importance for monitoring endothelial function and other disease states that involve changes in physiological nitric oxide (NO) production. It is shown here that the elimination of dissolved oxygen from samples is critical when using covalently attached diselenocystamine-based amperometric RSNO sensors for practical RSNO measurements. The newest generation of RSNO sensors utilizes an amperometric NO gas sensor with a thin organoselenium modified dialysis membrane mounted at the distal sensing tip. Sample RSNOs are catalytically reduced to NO within the dialysis membrane by the immobilized organoselenium species. In the presence of oxygen the sensitivity of these sensors for measuring low levels of RSNOs (< μM) is greatly reduced. It is demonstrated that the main scavenger of the generated nitric oxide is not the dissolved oxygen, but rather superoxide anion radical generated from the reaction of the reduced organoselenium species (the reactive species in the catalytic redox cycle) and dissolved oxygen. Computer simulations of the response of the RSNO sensor using rate constants and diffusion coefficients for the reactions involved, known from the literature or estimated from fitting to the observed amperometric response curves, as well as the specific geometric dimensions of the RSNO sensor, further support that nitric oxide and superoxide anion radical quickly react resulting in near zero sensor sensitivity toward RSNO concentrations in the sub-micromolar concentration range. Elimination of oxygen from samples helps improve sensor detection limits to ca. 10 nM levels of RSNOs.
Introduction
S-Nitrosothiols (RSNOs) are bioactive molecules generated in vivo by the nitrosylation of thiols with oxidative intermediates of endogenous nitric oxide (NO).1 RSNOs have been suggested as a carrier and reservoir for NO under physiological conditions, since most of the decomposition pathways of RSNOs lead to localized NO generation.2-4 Hence, the biological roles of RSNOs are similar to NO, such as vasculature relaxation and the inhibition of platelet adhesion and activation.4, 5
In recent years, our group has been developing electrochemical RSNO sensors using catalytic layers consisting of copper ions or organoselenium-based nitric oxide generating polymers.6-9 Initially, the goal was to use these NO generating polymers to prepare a new generation of thromboresistant biomedical coatings via spontaneous generation of NO from endogenous RSNOs in blood. However, values reported in literature for endogenous RSNO concentrations vary widely.10 Indeed, RSNOs are extremely labile species that are rapidly decomposed by light, heat and certain metal ions.11-13 Thus, it has been suggested that measurement in fresh blood samples protected from light is essential for accurate quantitation of the global plasma levels of these species.
The first amperometric RSNO sensors employed various immobilized copper catalyst reagents.6 The sensitivities of copper-based sensors toward different low molecular weight RSNO species (e.g., S-nitrosocysteine, S-nitrosoglutathione, etc.) varied widely, thus they could not be used for measurement of total low molecular weight RSNOs in blood. The second generation of RSNO sensors utilized organoselenium-based catalysts.9 The idea to use these species came from the finding that glutathione peroxidase enzyme possesses a selenocysteine residue at its active site which is capable of catalyzing the decomposition of RSNOs to NO in the presence of glutathione.14 The immobilization of the enzyme at the distal end of an amperometric NO sensor proved to be a viable approach to preparing an RSNO selective sensor. The resulting device yielded excellent response to most low molecular weight RSNOs. However, the stability of this device was poor, with a significant loss in sensitivity after 1-2 d. More robust sensors were prepared by crosslinking a hydrogel layer of diseleno-dipropionic acid conjugated to polyethyleneimine (PEI) between an outer dialysis membrane and the gas permeable membrane of the NO sensor.7 This sensor design showed nearly equal amperometric response for the low molecular weight RSNOs. Recently, a new RSNO sensor was developed with organoselenium species directly linked to the dialysis membrane.8 Using this configuration the analyte does not have to diffuse through an inert dialysis membrane as in the case of hydrogel-based sensors. This indeed resulted in a lower detection limit and a higher sensitivity, when measurements were made in deoxygenated solutions. Futher, it was shown in this earlier work8 that macromolecular RSNOs, such as S-nitrosoalbumin, a major carrier of NO in blood, can also be detected by such sensors via a transnitrosation reaction with excess of added thiols (e.g., glutathione). The added thiols are required to keep the immobilized selenium catalyst in the reduced selenol state, the species that reacts with RSNOs to liberate NO.
Ideally, sub-micromolar detection of S-nitrosothiols in the presence of oxygen would be desired for fresh blood measurements. In earlier work we demonstrated that RSNOs can be detected at ca. 100 nM levels when fresh porcine blood (with physiological oxygen levels) is diluted (1:3) into deoxygenated buffers.8 We now show in this work that the presence of dissolved oxygen, however, can greatly decrease the sensitivity of RSNO sensors in sub-micromolar range of concentrations. This could be ascribed to either direct reaction of NO with oxygen or NO can react with superoxide anion radical catalytically generated from any oxygen present by the reduced organoselenium species (selenol) that also is the reactive reducing agent to generate NO from RSNOs. Herein we prove through experiments and support via modeling that the formation of superoxide anion radical from oxygen is the primary mechanism of the reduce amperometric response of the sensor at low RSNO concentrations and demonstrate that operation of the sensor in the absence of oxygen greatly enhances amperometric response. The theory and experimental data reported herein may also be applicable to better understanding the behavior of immobilized organoselenium-based NO generating polymeric materials that have been suggested as new thromboresistive biomedical coatings for blood contacting biomedical devices.15 These coatings utilize endogenous RSNOs in blood to locally produce NO, a potent inhibitor of platelet function.
Materials and Methods
Materials
Dialysis membranes (Spectra/Por 7, MWCO= 50 kDa) were purchased from Spectrum Laboratories Inc. (Rancho Dominguez, CA). Glutathione (GSH), ethylenediamine tetraacetic acid (EDTA), N,N′-dimethyl-9,9′-bisacridinium nitrate (lucigenin), dimethyl sulphoxide (DMSO), xanthine, xanthine oxidase, sodium hydroxide, glycine and sodium periodate (>99%) were products of Sigma–Aldrich (St. Louis, MO) and were used as received. ((2-(p-Hydroxybenzyl)-6-(p-hydroxyphenyl)-8-benzyl-imidazol[1,2-a]pyrazin-3-(7H)-one (coelenterazine), sodium cyanoborohydride and N-nitroso-L-proline were also used as received from NanoLight Technology (Pinetop, AZ), Acros Organics (Morris Plains, NJ) and TRC Inc. (North York, ON, Canada), respectively. Selenocystamine (SeCA) was synthesized as described in the literature.16 S-Nitrosoglutathione (GSNO) was synthesized by nitrosating sulfhydryl groups of GSH in acidified nitrite solution as described elsewhere.15 Buffers as well as all other solutions employed in this work were prepared in the laboratory from Milli-Q grade deionized water (18.2 MΩ, Millipore Corp., Billerica, MA).
Organoselenium catalyst immobilization on cellulose dialysis membrane
All pieces of dialysis membranes (DMs) used in this study were pre-soaked at least overnight in 1 mM EDTA solution to remove trace metal contaminants before use. Then, the cellulose backbone of DM was first oxidized in 10 mM NaIO4 solution for 1.5 h to create dialdehydes (from diols of glucopyranose units17), and subsequently reacted with 10 mM SeCA for 1 h in 0.1 M MOPS buffer (pH 7.6). Sodium cyanoborohydride was then added to the reaction mixture so that the Schiff-base linkage created from reaction between aldehydes and amines (of SeCA) can be further reduced for 6 h to form the desired C–N single bonds. Fresh organoselenium immobilized DMs (RSeDM) were further soaked in 100 μM GSNO and 200 μM GSH for 2 h before use so that any uncoupled halves of the diselenide (SeCA) species can be effectively removed. The resultant RSeDMs were stored at 4 °C in PBS.
Fabrication of amperometric NO/RSNO sensors
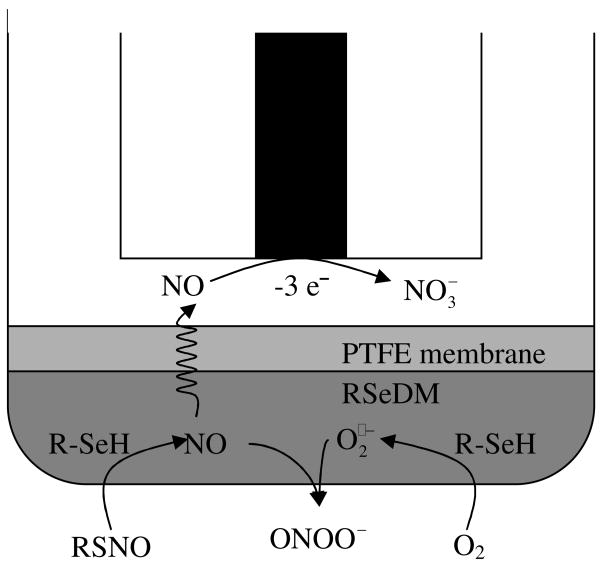
The RSNO sensor (Fig. 1) is based on an NO sensor configuration that we reported previously.18 Platinum wire (0.5-mm diameter; Sigma–Aldrich, St. Louis, MO) was employed to prepare a planar working electrode sealed in a glass capillary. To minimize ammonia interference, the microporous PTFE-gas permeable membrane (PTFE-GPM) was treated in advance with 0.5 μL TeflonAF® (DuPont Fluoroproducts, Wilmington, DE) after mounting on the tip of the sensor body.19 Finally, fabrications of the RSNO sensor was completed by attaching a wet piece of RSeDM prepared as described above to the outside of the PTFE-GPM with an O-ring. All subsequent calibrations and measurements were performed at the applied potential of +0.75 V vs. Ag/AgCl.
Figure 1. Amperometric detection scheme of RSNO sensor.
Enhancing the reproducibility of NO/RSNO sensors
The optimal distance between the PTFE-GPM and the Pt working electrode was adjusted with electrochemical impedance spectroscopy measurements (EG&G Instruments, Model 6310). The impedance spectra were recorded in the frequency range 100 kHz - 1 Hz by using a sinusoidal excitation signal with amplitude of 5 mV and DC potential of +0.75 V. The highest RSNO sensor sensitivity was achieved when the impedance of the inner solution was between 30 and 300 kΩ. For values lower than 30 kΩ, the inner solution layer was too thick, thus the NO that diffused through the PTFE-GPM was diluted in a large volume of inner solution. For impedances over 300 kΩ, the measured amperometric responses were noisy due to the possible bubble formation between the hydrophobic PTFE-GPM and the platinum surface. Amperometric responses from both NO and RSNO sensors were collected via a multi-channel potentiostat (Biostat®, ESA Biosciences Inc., Chelmsford, MA) and associated software. Other experimental conditions were as reported earlier.8
Measurement of chemiluminescence
To prove that the immobilized selenium species can react with oxygen to produce superoxide, lucigenin-derived chemiluminence and coelenterazine-derived chemiluminence were utilized.20-23 The lucigenin-derived chemiluminescence (LDCL) was monitored with a photomultiplier tube (Thorlabs, PMM02) at 1.4 V gain level. A 0.05 M glycine-NaOH buffer (pH 10.0) was used for all LDCL measurements. The lucigenin was dissolved in DMSO to a final concentration of 6.25 mM. The coelenterazine-derived chemiluminescence (CDCL) was registered with a spetrofluorophotometer (Shimadzu RF-1501). Coelenterazine was first dissolved in methanol in 2 mM concentration. Finally, this solution was diluted tenfold in phosphate buffer (pH 7.4). All solutions were bubbled with air for 20 min to ensure ambient levels of oxygen.
Before measuring LDCL of the RSeDM, 40 μL lucigenin solution was mixed in 960 μL glycine-NaOH buffer in the plastic luminometer cuvette. The RSeDM was gripped in a holder so that only a circle of 5 mm diameter was in contact with the solution. The holder with the RSeDM was immersed in the lucigenin solution. LDCL was measured as described above. For CDCL measurements, 250 μL coelenterazine solution was mixed with 750 μL phosphate buffer (pH 7.4) containing 100 μM EDTA and 4 mL/L Triton X-100 surfactant. The RSeDM was placed directly into the resulting solution.
Calibration of superoxide was conducted using xanthine - xanthine oxidase system. Xanthine and xanthine oxidase in 0.5 mM and 0.2 U/mL concentrations were dissolved in 0.05 M glycine-NaOH buffer (pH 10) in the case of LDCL and in phosphate buffer (pH 7.4) containing 100 μM EDTA and 4 mL/L Triton X-100 surfactant in the case of CDCL. One hundred μL xanthine oxidase was then mixed with the chemiluminescent dye solution and buffer in the plastic luminometer cuvette to give 1 mL total volume. Xanthine was added to the mixture to start the reaction. Chemiluminescence intensities were registered 5 min after the start of the reaction.
Theory
Reactions in RSeDM
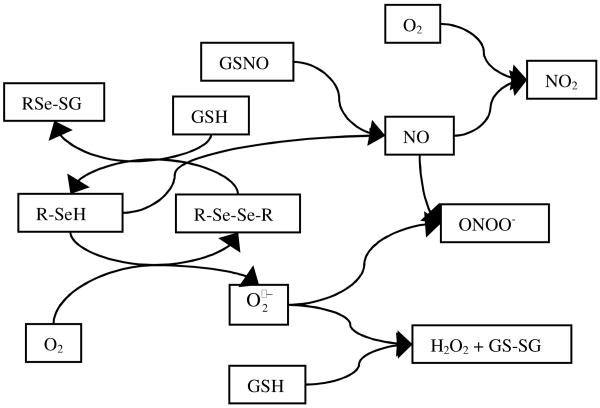
The proposed reaction scheme to generate NO from RSNOs by the selenium catalyst, as well as potential scavenging reactions that are dependent on oxygen, are summarized in Figure 2. Nitric oxide is only produced from the reaction of GSNO (used here as the model S-nitrosothiol substrate) and selenol (R-SeH), and it is scavenged quickly by superoxide anion radical producing peroxynitrite (ONOO-), and via a slower reaction by reaction with GSH. The reaction of NO with is the fastest among the reactions examined, with a reaction rate constant of 6.7·109 M-1s-1.24 The is only produced from the reaction of oxygen and R-SeH, and it reacts with both GSH and NO. The reaction rate constant of GSH with superoxide anion radical is 1.8·105 M-1s-1,25 which is more than four orders of magnitude lower than its reaction rate with NO. Taking the calculated NO and GSH concentrations in the RSeDM at 10 μM GSNO level (250 nM and 50 μM, respectively) into consideration, the reaction of NO with is ca. 200 times faster then the reaction of GSH with under these specific conditions. Due to this difference, superoxide anion radical reacts mainly with NO and not excess GSH, when RSNOs are present. Superoxide also reacts with GSNO but this reaction is even slower than the reaction with GSH under our experimental conditions.26 Moreover, GSH concentration is higher than GSNO concentration during the entire course of measurement.
Figure 2. Scheme of reactions occurring in RSeDM.
It should be noted that GSH or other thiols are typically added to the background buffers when using RSNO sensors to ensure rapid reduction of any RSe-SeR sites in the catalytic layer to reactive RSeH sites,15 and can also enhance response to macromolecular RSNOs in the sample by shifting the transnitrosation equilibrium to form more low-MW RSNOs.8 GSH was chosen over cysteine in this work as the reducing agent to avoid the additional uncertainty of the transnitrosation of GSNO to S-nitrosocysteine in the theoretical model that was developed.
Finite-difference model of RSNO sensor
The finite-difference method is a widely used numerical tool to simulate the time dependent response of electrochemical sensors. The arrangement of simulation used here was one-dimensional. The platinum electrode was at d = 0, where the concentration of NO is considered as = 0 (voltage applied is adequate to achieve complete concentration polarization of the surface). The first layer was the inner solution (10 mM HCl and 0.1 M KCl, in this case), the second layer was the PTFE-GPM, the third layer was RSeDM, and the last layer was the unstirred sample solution. The thickness of inner solution layer, dialysis membrane and diffusion layer were considered (estimated) as 60 μm, 60 μm and 160 μm, respectively. Only gases can penetrate through the PTFE-GPM and the transport of NO was assumed to be instantaneous between the inner solution and the dialysis membrane. GSH, GSNO, could only be found in the dialysis membrane and the sample solution ([GSH] = 50 μM). Selenium species were only present in the dialysis membrane (since they are immobilized covalently in this layer). Diffusion coefficients of NO, GSNO and were 2.21·10-5, 0.67·10-5, 2·10-5 cm2s-1, respectively, based on reported literature values.27, 28 The diffusion coefficient of GSNO is assumed to be equal to the diffusion coefficient of GSH. The concentrations of NO, GSNO and were calculated in each time instance with differential equations shown below.
, where k1, k2, k3, k4, k5 are 6.7·109 M-1s-1, 2.6·10-4 s-1, 4.4·10-2 s-1, 1.8·105 M-1s-1, 2.1·106 M-2s-1. The reaction rate constants k1, k4, k5 can be found in the literature.24, 25, 29 Thicknesses of the inner solution and the diffusion layer and reaction rate constants k2 and k3 were determined by fitting the simulated curves to the experimentally measured amperometric response curves. The Nelder-Mead simplex algorithm was used in the fittings.30
The time resolution of the numerical simulation was 0.001 s, and the spatial resolution was 5 μm. The current was calculated by taking the quotient of current response measured at 0.5 μM NO bulk concentration and the gradient of NO at the platinum electrode simulated for this system; then simulated NO gradients were multiplied by this quotient to obtain the simulated current.
Results and Discussion
Effect of oxygen on the amperometric response of RSNO sensors
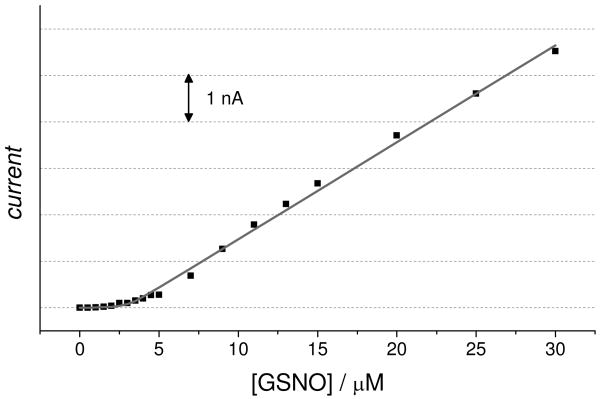
The calibration curve for the RSNO sensor in the presence of oxygen can be divided in two distinct regions (Fig. 3). When the concentration of GSNO is less than 2 μM GSNO, the calibration curve is relatively flat; however at > 5 μM the sensor exhibits good sensitivity. This effect is due to the produced by the RSeDM in the presence of the GSH added to the solution as a reducing agent.
Figure 3.
Calibration curve of GSNO in the presence of oxygen in PBS (pH 7.4) solution containing 50 μM GSH. Black squares are experimental data points; gray line is the simulated curve.
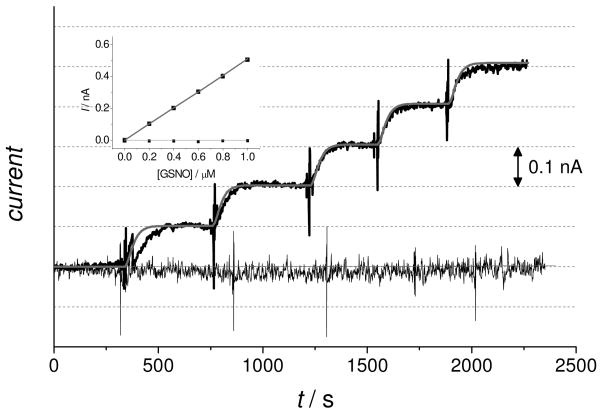
The sensor has poor sensitivity to GSNO in the presence of atmospheric levels of oxygen at sub-micromolar concentrations (Fig. 4). However, in the complete absence of oxygen the sensor shows very good response in this low concentration region.
Figure 4.
Amperometric responses of an RSNO sensor at sub-micromolar concentrations of GSNO in PBS (pH 7.4) solution containing 50 μM GSH. The thick black curve shows the experimental data and the thick gray curve shows the simulated data in absence of oxygen. The thin black curve shows the experimental data and the thin gray curve shows the simulated data in presence of oxygen. The inset shows the calibration curve of the GSNO sensor, the color codes are the same as above.
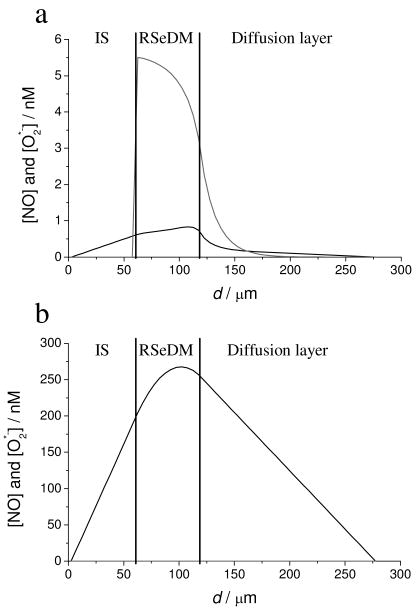
According to the numerical simulations, in the presence of dissolved oxygen at 1 μM GSNO, the concentration is higher than the NO concentration (see Fig. 5a) in the membrane. This results in a reduced NO release from the DM and hence the measured current is lowered. However, at 10 μM GSNO, the NO concentration in the sensing layer is more than three orders of magnitude higher than the concentration (see Fig. 5b). This difference is due to the higher GSNO concentration. Three μM GSNO is enough to generate NO that scavenges most of the produced from ambient levels of dissolved oxygen (0.29 mM), and thus the excess amount of NO can diffuse to the platinum electrode surface to oxidize and cause the observed anodic current.
Figure 5.
Simulated steady-state concentration profiles of NO and in an RSNO sensor at a) 1 μM GSNO; b) 10 μM GSNO at varying distances from the surface of the platinum electrode in the amperometric RSNO sensor configuration. The black curve represents the NO concentration; the gray curve represents the concentration.
Nitric oxide measurement with NO/RSNO membranes
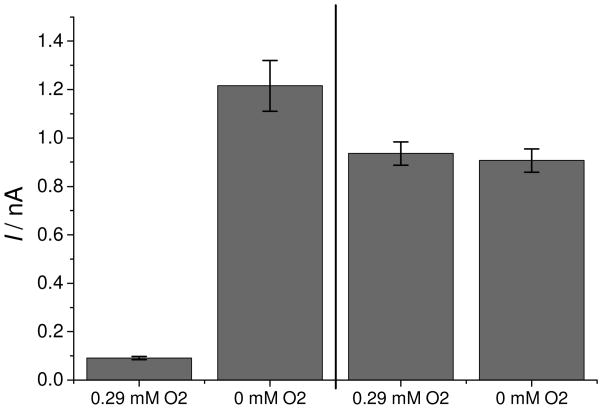
To show that the insufficient sensitivity at sub-micromolar ranges using the RSNO sensor is caused by superoxide anion radical and not by direct reaction of oxygen with NO produced from RSe-based catalytic reeaction, the amperometric response of separate RSNO and NO sensors were measured with 0.5 μM NO in absence and in presence of oxygen. The presence of oxygen resulted in a large decrease in the measured current when the RSNO sensor was employed to monitor the NO. However, no significant effect of oxygen could be detected when the NO sensor without the RSeDM was employed (see Fig. 6). This confirms the findings based on finite-difference modeling that at low concentrations of NO, the decay of NO is mainly caused by reaction with superoxide anion radical and not by the dissolved NO's direct reaction with oxygen.
Figure 6.
Amperometric responses of an RSNO sensor (1st and 2nd bar) and an NO sensor (3rd and 4th bar) to 0.5 μM NO in 50 μM GSH in PBS (pH 7.4).
Detection of superoxide anion radical
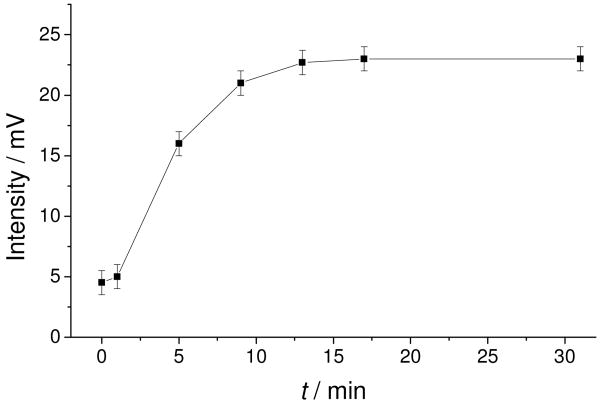
To prove that superoxide can be generated by the catalytic RSeDM layer, the chemiluminescene dye lucigenin can be used for the selective detection of superoxide.20, 21 This dye was employed to show the production of superoxide by the RSeDM. The radical form of lucigenin is generated by univalent reduction, which then reacts with superoxide radical anion; the resulting molecule decomposes into two molecules, one of which emits photon.21 Once the membrane is placed into a luminescence cuvette containing the lucigenin, the time dependence of lucigenin-derived chemiluminescence (LDCL) can be observed (see Fig 7.). After 15 min, the emitted light levels off. It is important to note that after the addition of a reducing agent (GSH) to the solution, the LDCL actually decreases. Indeed, the presence of 10 μM GSH decreases the LDCL by more than 90% (Fig. S1), owing to the slower reaction of thiols with superoxide.
Figure 7.
Time dependence of lucigenin-derived chemiluminescence of RSeDM in glycine-NaOH buffer (pH 10.0) solution containing 0.25 mM lucigenin.
To confirm that the lucigenin-based chemiluminescence system was functioning as a useful superoxide sensing method, xanthine and xanthine oxidase were used to produce superoxide for calibration. The RSeDM emitted an equivalent amount of light as 13 nM xanthine. If it is assumed that superoxide is only produced locally in the RSeDM layer, the calculated superoxide concentration becomes 0.9 μM. This further confirms why the sensitivity of the RSNO sensor in the presence of oxygen is close to zero at low RSNO concentrations. At sub-micromolar RSNO concentrations, the produced superoxide levels are in the membrane layer are in excess to the NO and the superoxide scavenges the majority of NO produced from GSNO. At higher concentrations of GSNO, the NO becomes excess to the superoxide, and amperometric response to increasing RSNOs is clearly observed.
To further prove that superoxide is produced by the RSeDMs used to prepare RSNO sensors, we carried out similar studies with an alternate superoxide sensitive dye, coelenterazine. This compound has been reported by others to also yield significant chemlilumescence upon reaction with superoxide.22, 23, 31 Lucigenin has been reported to increase superoxide production, thus the LDCL experiments potentially overestimate the actual generated superoxide concentration.32 Coelenterazine does not produce artifacts when used as superoxide indicator.23 Results with this dye further confirmed superoxide generation in RSeDMs. Time dependence of the chemiluminescence was similar to the lucigenin-based assay (Fig. S2). The concentration of after 15 min immersion of a 2 cm2 RSeDM in coelenterazine solution was equivalent to 8.4 μM xanthine at pH 7.4.
Conclusions
It has been demonstrated here that superoxide anion radical can significantly reduce the nitric oxide detected at the surface of newly developed electrochemical RSNO sensors when these devices are used to monitor levels of GSNO in samples that contain oxygen. The superoxide anion radical is generated by the catalytic reaction of dissolved oxygen and reduced organoselenium species (selenol/selenate). A solution to this problem is to spin tonometer samples using a nitrogen/5% carbon dioxide gas stream to maintain physiological pH while removing oxygen. This approach is now being used in current collaborative clinically oriented research to detect RSNOs in the range of 100-2000 nM in fresh animal blood samples. An even more promising method to eliminate the effect of oxygen in future generations of RSNO sensors will be the application of alternate immobilized organoselenium species - such as ebselen - which do not produce significant amounts of yet still generate NO efficiently from RSNOs.33 Indeed, the use of immobilized ebselen type organoselenium species that exhibit less reactivity with oxygen should also aid in advancing the use of polymer bound RSe sites to generate NO spontaneously in blood to reduce activation of platelets and other cells at the surface of intravascular medical devices. Studies in these directions are now underway in this laboratory.
Supplementary Material
Acknowledgments
We thank the National Institutes of Health for providing funding for the research via NIH grant (EB-000783 and EB-004527). We also thank to Michael Morris and Francis Esmonde-White for their help in conducting the chemiluminescence experiments.
References
- 1.Wink D, Nims R, Darbyshire J, Christodoulou D, Hanbauer I, Cox G, Laval F, Laval J, Cook J, Krishna M, Degraff W, Mitchell J. Chem Res Toxicol. 1994;7:519–525. doi: 10.1021/tx00040a007. [DOI] [PubMed] [Google Scholar]
- 2.Stamler J, Simon D, Jaraki O, Osborne J, Francis S, Mullins M, Singel D, Loscalzo J. P Natl Acad Sci USA. 1992;89:8087–8091. doi: 10.1073/pnas.89.17.8087. [DOI] [PMC free article] [PubMed] [Google Scholar]
- 3.Stamler J, Singel D, Loscalzo J. Science. 1992;258:1898–1902. doi: 10.1126/science.1281928. [DOI] [PubMed] [Google Scholar]
- 4.Rassaf T, Kleinbongard P, Preik M, Dejam A, Gharini P, Lauer T, Erckenbrecht J, Duschin A, Schulz R, Heusch G, Feelisch M, Kelm M. Circ Res. 2002;91:470–477. doi: 10.1161/01.res.0000035038.41739.cb. [DOI] [PubMed] [Google Scholar]
- 5.Radomski M, Rees D, Dutra A, Moncada S. Brit J Pharmacol. 1992;107:745–749. doi: 10.1111/j.1476-5381.1992.tb14517.x. [DOI] [PMC free article] [PubMed] [Google Scholar]
- 6.Cha W, Lee Y, Oh B, Meyerhoff M. Anal Chem. 2005;77:3516–3524. doi: 10.1021/ac048192u. [DOI] [PubMed] [Google Scholar]
- 7.Cha W, Meyerhoff M. Langmuir. 2006;22:10830–10836. doi: 10.1021/la0612116. [DOI] [PubMed] [Google Scholar]
- 8.Cha W, Anderson M, Zhang F, Meyerhoff M. Biosens Bioelectron. 2009;24:2441–2446. doi: 10.1016/j.bios.2008.12.022. [DOI] [PMC free article] [PubMed] [Google Scholar]
- 9.Musameh M, Moezzi N, Schauman L, Meyerhoff M. Electroanal. 2006;18:2043–2048. [Google Scholar]
- 10.Giustarini D, Milzani A, Colombo R, Dalle-Donne I, Rossi R. Clin Chim Acta. 2003;330:85–98. doi: 10.1016/s0009-8981(03)00046-9. [DOI] [PubMed] [Google Scholar]
- 11.Askew S, Barnett D, Mcaninly J, Williams D. J Chem Soc Perk T 2. 1995:741–745. [Google Scholar]
- 12.Shishido S, De Oliveira M. Photochem Photobiol. 2000;71:273–280. doi: 10.1562/0031-8655(2000)071<0273:pgmrtr>2.0.co;2. [DOI] [PubMed] [Google Scholar]
- 13.Pfeiffer S, Schrammel A, Schmidt K, Mayer B. Anal Biochem. 1998;258:68–73. doi: 10.1006/abio.1998.2562. [DOI] [PubMed] [Google Scholar]
- 14.Hou Y, Guo Z, Li J, Wang P. Biochem Bioph Res Co. 1996;228:88–93. doi: 10.1006/bbrc.1996.1620. [DOI] [PubMed] [Google Scholar]
- 15.Cha W, Meyerhoff M. Biomaterials. 2007;28:19–27. doi: 10.1016/j.biomaterials.2006.08.019. [DOI] [PubMed] [Google Scholar]
- 16.Gunther W, Mautner H. J Am Chem Soc. 1965;87:2708–&. doi: 10.1021/ja01090a031. [DOI] [PubMed] [Google Scholar]
- 17.Kim U, Kuga S, Wada M, Okano T, Kondo T. Biomacromolecules. 2000;1:488–492. doi: 10.1021/bm0000337. [DOI] [PubMed] [Google Scholar]
- 18.Lee Y, Oh B, Meyerhoff M. Anal Chem. 2004;76:536–544. doi: 10.1021/ac035064h. [DOI] [PubMed] [Google Scholar]
- 19.Cha W, Meyerhoff M. Chem Anal-Warsaw. 2006;51:949–961. [Google Scholar]
- 20.Bai Z, Harvey L, Mcneil B. Biotechnol Bioeng. 2001;75:204–211. doi: 10.1002/bit.1180. [DOI] [PubMed] [Google Scholar]
- 21.Faulkner K, Fridovich I. Free Radical Bio Med. 1993;15:447–451. doi: 10.1016/0891-5849(93)90044-u. [DOI] [PubMed] [Google Scholar]
- 22.Kervinen M, Patsi J, Finel M, Hassinen I. Anal Biochem. 2004;324:45–51. doi: 10.1016/j.ab.2003.09.004. [DOI] [PubMed] [Google Scholar]
- 23.Teranishi K, Shimomura O. Anal Biochem. 1997;249:37–43. doi: 10.1006/abio.1997.2150. [DOI] [PubMed] [Google Scholar]
- 24.Huie R, Padmaja S. Free Radical Res Com. 1993;18:195–199. doi: 10.3109/10715769309145868. [DOI] [PubMed] [Google Scholar]
- 25.Dikalov S, Khramtsov V, Zimmer G. Arch Biochem Biophys. 1996;326:207–218. doi: 10.1006/abbi.1996.0067. [DOI] [PubMed] [Google Scholar]
- 26.Jourd'heuil D, Mai C, Laroux F, Wink D, Grisham M. Biochem Bioph Res Co. 1998;244:525–530. doi: 10.1006/bbrc.1998.8227. [DOI] [PubMed] [Google Scholar]
- 27.Zacharia I, Deen W. Ann Biomed Eng. 2005;33:214–222. doi: 10.1007/s10439-005-8980-9. [DOI] [PubMed] [Google Scholar]
- 28.Jin W, Chen H. Chromatographia. 2000;52:17–21. [Google Scholar]
- 29.Lewis R, Deen W. Chem Res Toxicol. 1994;7:568–574. doi: 10.1021/tx00040a013. [DOI] [PubMed] [Google Scholar]
- 30.Nelder J, Mead R. Comput J. 1965;7:308–313. [Google Scholar]
- 31.Saleh L, Plieth C. Nat Protoc. 2010;5:1635–1641. doi: 10.1038/nprot.2010.121. [DOI] [PubMed] [Google Scholar]
- 32.Liochev S, Fridovich I. Arch Biochem Biophys. 1997;337:115–120. doi: 10.1006/abbi.1997.9766. [DOI] [PubMed] [Google Scholar]
- 33.Mugesh G, Singh H. Chem Soc Rev. 2000;29:347–357. [Google Scholar]
Associated Data
This section collects any data citations, data availability statements, or supplementary materials included in this article.


