Abstract
Oscillatory activity is generated by many neural systems. γ band (∼40 Hz) oscillations in the thalamus and cortex occur spontaneously and in response to sensory stimuli. Fast rhythmic bursting (FRB) cells (also called chattering cells) comprise a unique class of cortical neurons that, during depolarization by current injection, intrinsically generate bursts of high-frequency action potentials with an interburst frequency between 30 and 50 Hz. In the present study, we show for the first time that FRB cells in the primary visual cortex can be either simple or complex and are distributed throughout all cortical layers. Strikingly, both simple and complex FRB cells generate spike bursts at γ frequencies in response to depolarizing current pulses, but only simple FRB cells exhibit a selective, stimulus feature-dependent increase in γ oscillations in response to visual stimulation. In addition, we find that hyperpolarization does not reduce the relative power of visually evoked γ oscillations in the Vm response of FRB cells. Our results thus indicate that visually evoked γ activity in individual simple and complex FRB cells is generated in large part by rhythmic synaptic input, rather than by depolarization-dependent activation of intrinsic properties. Finally, the presence of FRB cells in layer 6 suggests a role for corticothalamic feedback in potentiating thalamic oscillations and facilitating the generation of a corticothalamocortical oscillatory loop. We propose that rather than functioning as pacemakers, FRB cells amplify and distribute stimulus-driven γ oscillations in the neocortex.
Keywords: contrast, intracellular, orientation, in vivo, intrinsic properties, chattering, feature dependent
Introduction
Rhythmic activity, a common behavior of neural systems, may result from the activity of pacemaker cells endowed with intrinsic oscillatory activity and connected to a population with specific resonant properties (Llinás, 1988; Hutcheon and Yarom, 2000). Alternatively, oscillatory patterns may emerge from cellular interactions within a network, even if none of the constituent elements are capable of autorhythmicity (Bremer, 1958). Understanding the generation and distribution of oscillations provides essential clues about the dynamic organization of the substrate neural networks.
γ band (30-50 Hz) oscillations in cortical and thalamic networks occur spontaneously (Steriade et al., 1991, 1996) during periods of alertness (Lopes da Silva et al., 1970; Bouyer et al., 1981; Freeman and van Dijk, 1987; Murthy and Fetz, 1992) and in response to sensory stimuli in animal models (Gray and Singer, 1989; Jagadeesh et al., 1992; Wehr and Laurent, 1996; Jones and Barth, 1997) and in humans (Pantev et al., 1991; Ribary et al., 1991; Joliot et al., 1994; Tallon-Baudry et al., 1996; Kwon et al., 1999). Long-range coordination of visually evoked cortical γ oscillations has been implicated in the integration of visual responses across distant cortical areas (König et al., 1995; Singer and Gray, 1995; Bertrand and Tallon-Baudry, 2000).
After depolarization, subpopulations of thalamic and cortical neurons intrinsically generate repetitive action potentials at γ frequencies. In the thalamus, these include neurons in the rostral portion of the intralaminar nuclei (Steriade et al., 1993), thalamocortical relay neurons (Pedroarena and Llinás, 1997; Rhodes and Llinás, 2005), and a subpopulation of GABAergic thalamic reticular neurons (Pinault and Deschênes, 1992; Bal and McCormick, 1993; Contreras et al., 1993). Some pyramidal cells in association and somatomotor cortex demonstrate intrinsic γ oscillations (Nuñez et al., 1992), as do some aspiny interneurons in layer 4 of the frontal cortex (Llinás et al., 1991).
A unique category of γ oscillating cortical neurons, fast rhythmic bursting (FRB) cells, generate high-frequency (350-700 Hz) bursts of action potentials with an interburst frequency of 30-50 Hz in response to suprathreshold depolarizing current injection (Gray and McCormick, 1996; Steriade et al., 1998; Brumberg et al., 2000; Nowak et al., 2003). FRB cells have been described in layers 2/3 of the primary visual cortex (Gray and McCormick, 1996) and in layers 2/3, 5, and 6 of sensorimotor and association cortex (Steriade et al., 1998). Previous work by Gray and McCormick (1996) found that FRB cells in the cat primary visual cortex generated visually evoked γ frequency spike bursts. Furthermore, these cells exhibited exclusively simple visual receptive field properties (Gray and McCormick, 1996).
We studied in detail the visual responses of FRB cells in the cat primary visual cortex. In contrast to previous reports, we found both simple and complex FRB cells distributed throughout layers 2-6 of the cortex. All FRB cells demonstrated identical firing patterns in response to suprathreshold current injection, but only simple FRB cells responded to visual stimulation with a specific increase in γ activity. This visually evoked γ activity was not decreased by hyperpolarization. Because intrinsic γ oscillations occur only during suprathreshold depolarization, our results suggest that Vm γ oscillations in FRB cells are mainly driven by rhythmic synaptic input.
Materials and Methods
Surgical protocol. Experiments were conducted in accordance with the ethical guidelines of the National Institutes of Health and with the approval of the Institutional Animal Care and Use Committee of the University of Pennsylvania. Adult cats (2.5-3.5 kg) were anesthetized with an initial intraperitoneal injection of thiopental (25 mg/kg). Supplementary halothane (2-4% in a 70:30 mixture of N2O and O2) permitted the placement of two venous catheters. Subsequently, deep anesthesia was maintained during surgery with intravenous thiopental as needed and maintained for the duration of the experiment (14-16 h) with a continuous infusion (3-10 mg/h). Atropine sulfate (0.05 mg/kg, i.m.) was administered to prevent secretions and dexamethasone (4 mg, i.m.) to prevent cerebral edema. Lidocaine (2%) was generously applied to all skin incisions and pressure points. The animal was paralyzed with gallamine triethiodide (Flaxedil) by an initial injection of 60 mg and maintained with continuous intravenous infusion (20 mg/h). After paralysis, the level of anesthesia was determined by continuously monitoring the heart rate (180-200 beats/min) and monitoring the EEG for the presence of low-frequency, high-amplitude activity. Because thiopental was infused continuously, we obtained a very stable level of anesthesia throughout the experiment. The end-tidal CO2 concentration was kept at 3.7 ± 0.2%, and the rectal temperature was kept at 37-38°C with a heating pad.
The surface of the visual cortex was exposed with a craniotomy centered at Horsley-Clarke coordinates posterior 4.0, lateral 2.0. The stability of the recordings was ensured by performing a bilateral pneumothorax, drainage of the cisterna magna, hip suspension, and by filling the cranial defect with a solution of 4% agar.
Intracellular recording procedures. Intracellular recordings were performed with glass micropipettes (50-80 MΩ) filled with 3 m potassium acetate. The depth of the cells was estimated from the microdrive reading, which was calibrated previously by comparing those readings with the depths of cells filled with neurobiotin and found to have differences of <30 μm. In those cases in which FRB cells were not filled, microdrive depth was confirmed by measuring the depth of nearby filled cells.
Visual stimulation. The corneas were protected with neutral contact lenses after dilating the pupils with 1% ophthalmic atropine and retracting the nictitating membranes with phenylephrine (Neosynephrine). Spectacle lenses were chosen by the tapetal reflection technique to optimize the focus of stimuli on the retina. The position of the monitor was adjusted with an x-y stage so that the area centralae were well centered on the screen and their coordinates entered into the computer for tracking receptive field positions in retinal coordinates.
Stimuli were presented on an Image Systems (Minnetonka, MN) model M09LV monochrome monitor operating at 125 frames per second at a spatial resolution of 1024 × 786 pixels and a mean luminance of 47 cd/m2. The screen subtends 36 by 27° (28.7 pixels per degree), and lookup tables were linearized for a contrast range of ±100%. Stimuli were synthesized using custom software by means of the framestore portion of a Cambridge Research Systems (Cambridge, UK) visual stimulus generator card mounted in a conventional personal computer. Programs provide for stimulus control, on-line displays of acquired signals (Vm and spikes), and a graphical user interface for controlling all stimulus parameters. In addition to this on-line control, all data were stored on Nicolet Vision (Nicolet Instrument Technologies, Madison, WI), and it was from these records that off-line analyses were performed. Vm and stimulus marks were sampled at 10 kHz with 16 bit analog-to-digital converters.
Computer-assisted hand plotting routines were used with every cell to estimate quickly and accurately the optimal orientation, direction of movement, and spatial and temporal frequencies and to determine the receptive field position and dimensions. Tuning for orientation and spatial frequency were determined with a series of drifting sinusoidal gratings spanning the initial estimates. For broadly tuned cells, orientation was varied in steps of 22.5°. For most cells, orientation was varied in smaller, graduated steps around the mean (±3, ±6, ±12, ±18, ±26, ±34, ±44°), providing much finer resolution of the tuning curve. To assess contrast response functions, we used stimulus contrast levels of 0, 2, 4, 8, 16, 32, and 64%. When orientation or contrast was varied, all other parameters of the stimuli, including mean luminance, were held constant. All stimuli in a given series were presented in pseudorandom order.
Cells were classified as simple or complex based on two criteria. First, the relative modulation of spike trains evoked by an optimized patch of drifting sinusoidal grating was measured. If the response at the fundamental temporal frequency of the stimulus (F1) exceeded the average (DC) response, the cell was classified as simple. Otherwise, the cell was classified as complex (Skottun et al., 1991). Second, we estimated the one-dimensional spatiotemporal weighting function by averaging membrane potential and spike responses to bright and dark bars distributed across the receptive field at the optimal orientation [akin to the line weighting function (Movshon et al., 1978)]. Bars (n = 16 each for bright and dark) were presented one at a time (128 ms presentation followed by 128 ms mean luminance) in pseudorandom order. This sequence constituted one pass. Five to 20 passes comprised a complete data set. Cells exhibiting nonoverlapping regions excited by bright and dark stimuli were classified as simple. Cells showing excitation to bright and dark stimuli throughout their receptive fields were classified as complex. These two measures yielded the same functional classification in every case.
Spike removal. Spikes were removed by detecting the spike threshold at the base of the action potential and extrapolating the Vm values from the start to the end of the spike, followed by smoothing with a three point running average. Spike threshold was calculated as the value of Vm at the peak of the second derivative of the Vm trace within a time window of 2 ms preceding the peak of the spike.
Quantification of membrane potential activity. We quantified the visually evoked membrane potential activity by calculating the power spectra of membrane potential recordings digitally filtered from 10 to 100 Hz after spike removal. Because we and others (Gray and McCormick, 1996) have observed γ activity in FRB neurons to be expressed predominantly between 30 and 50 Hz, we assessed power in that frequency band in response to visual stimuli. To quantify the relative power (Prel) within a specific frequency band (e.g., 30-50 Hz), we calculated the power within that band (P30-50) divided by the total power from 10 to 100 Hz (P10-100) as follows: Prel = P30-50/P10-100.
We also compared the total power within a specific frequency band (e.g., P30-50) during the presentation of different visual stimuli. Comparing changes in the total power within a band to the changes in relative power in that band across stimuli allowed us to determine whether visual stimuli evoked broadband activity in a cell or specifically amplified a particular range of frequencies, such as γ activity.
To quantify the changes in the power within a specific frequency band in response to changes in visual stimuli, we computed the relative power ratio (Pratio) using the relative power in that band during two different stimuli (Stim1 and Stim2) as follows: Pratio = Prel Stim1/Prel Stim2.
If the relative power in a range did not change with stimulus parameters, the expected relative power ratio was 1. A decrease in power during presentation of the optimal stimulus would yield a ratio of <1, whereas an increase in power would give a ratio of >1.
Histology. At the end of each experiment in which neurobiotin was included in the recording pipette, the animal was given a lethal dose of sodium pentobarbital and perfused intracardially with 0.9% saline followed by cold 4% paraformaldehyde in 0.1 m PBS. The brain was removed and postfixed overnight in the same fixative. Coronal sections (100 μm thick) were cut on a vibratome, washed three times in PBS, and preincubated for 1 h at room temperature in PBS with 10% normal goat serum (Vector Laboratories, Burlingame, CA), 1% albumin from bovine serum (Sigma, St. Louis, MO), and 0.4% Triton X-100 (Sigma). Sections were then incubated overnight at room temperature in the previous solution containing 0.1% cyanine 3 (Cy3)-conjugated streptavidin (Jackson ImmunoResearch, West Grove, PA). After several rinses with PBS, the tissue was mounted on gelatinized glass slides and coverslipped with Vectashield (Vector Laboratories). Cy3-labeled cells were visualized with an Olympus (Melville, NY) BX51 microscope and a filter cube set for tetramethylrhodamine isothiocyanate/DiI/Cy3 (excitation, 540 nm; dichroic, 565 nm; emission, 605 nm; Chroma Technology, Rockingham, VT). Pictures were taken using an Olympus MagnaFire digital camera.
Results
Our goal was to characterize the functional properties of FRB cells in the cat visual cortex in vivo. Intracellular recordings with sharp glass microelectrodes were obtained from layers 2-6 of the primary visual cortex (area 17). Cells were classified electrophysiologically by their firing pattern in response to depolarizing intracellular current injection and functionally as simple or complex by the spatial organization of their receptive fields and their responses to drifting sinusoidal gratings of optimal parameters. Of the 44 FRB cells recorded intracellularly in 33 cats, we selected 29 cells for analysis (15 simple, 14 complex) based on two criteria: (1) a stable resting Vm more negative than -60 mV for at least 15 min, coupled with overshooting action potentials and (2) presentation of at least one complete series of visual stimuli.
Intrinsic properties of FRB cells
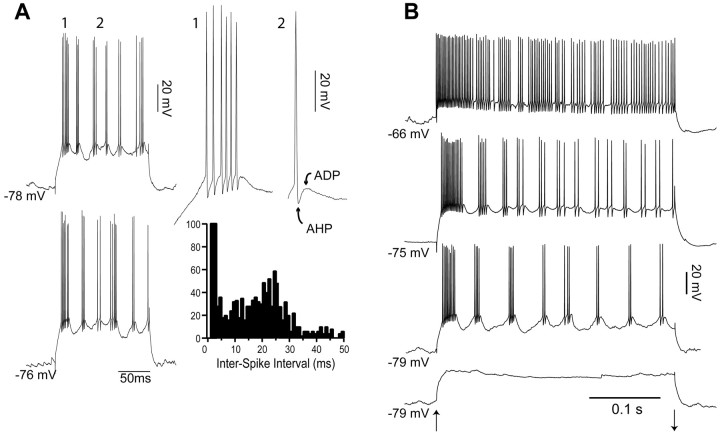
As reported previously (Gray and McCormick, 1996; Steriade et al., 1998; Brumberg et al., 2000; Nowak et al., 2003), FRB cells fired rhythmic high-frequency bursts in response to depolarizing current injection (Fig. 1A). FRB spike bursts typically consisted of two to eight action potentials with intraburst frequencies of 400-700 Hz (interspike intervals of 1.4-2.5 ms) (Fig. 1A) and interburst frequencies in the γ frequency range of 30-50 Hz (intervals of 33-20 ms) (Fig. 1A). The first burst in response to current injection was characteristically longer and of higher frequency (Fig. 1A, detail 1). In addition, FRB cells had brief (<0.5 ms at half-height) action potentials followed by a clear afterhyperpolarization (AHP) and afterdepolarization (ADP) sequence (Fig. 1A, detail 2). Subthreshold depolarizing pulses did not elicit Vm oscillations at γ frequency (Fig. 1B, bottom trace), in agreement with previous findings showing that intrinsic γ oscillations in FRB cells occur exclusively during suprathreshold activation (Gray and McCormick, 1996; Brumberg et al., 2000). Increasing the amplitude of the suprathreshold depolarizing pulse led to an increase in the intraburst frequency and a decrease in the latency of the first burst, an increase in the interburst frequency, and an increase in the number of spikes per burst (Gray and McCormick, 1996; Brumberg et al., 2000; Nowak et al., 2003). Increasing the amplitude of the depolarizing pulses or depolarizing the baseline Vm with steady current injection (n = 4) caused the bursts to fuse into a single tonic discharge with high-frequency firing (350-600 Hz) and little adaptation (Fig. 1B). This firing pattern is indistinguishable from that of fast spiking neurons, as has been shown previously in vivo (Steriade et al., 1998; Steriade, 2004).
Figure 1.
Intrinsic properties of FRB cells. A, During depolarization with a 0.8 nA current pulse, this FRB cell fired repeated bursts of high-frequency action potentials (400-700 Hz) with an interburst interval of 20-33 ms. Two examples are shown in the left column. The first burst of the top pulse is expanded in detail 1. Detail 2 shows the large AHP and ADP after the spike. The interspike interval histogram of spikes elicited in this cell by current pulses shows a peak centered on 1.5 ms, indicating high-frequency firing during bursts, and a peak centered on 25 ms, indicating a burst frequency at ∼40 Hz. B, The burst frequency of FRB cells is dependent on the degree of extrinsic depolarization. Onset and offset of the current pulses is indicated by the up and down arrows, respectively. The two bottom pulses were given at resting membrane potential, the next pulse at a holding current of +0.2 nA, and the top trace at a holding current of +0.4 nA. The depolarizing current pulses were as follows from bottom to top: +0.6, +1.2, +0.6, +1.2 nA. Increasing the amplitude of the holding current and the depolarizing current pulse (indicated at bottom) led to a decrease in the interburst interval until the bursts fused in a single tonic discharge.
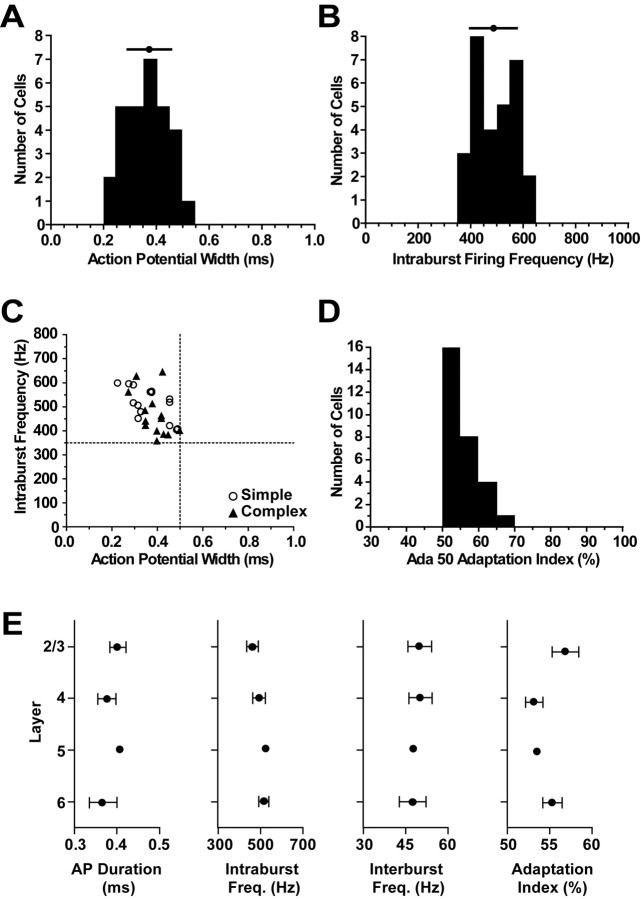
To directly compare our data with those of other studies, we quantified the responses to depolarizing current injection for the whole population following criteria established previously in vivo (Nowak et al., 2003). The mean action potential width at half-height was 0.38 ± 0.1 ms (Fig. 2A), and mean intraburst firing frequency was 490.1 ± 82.3 Hz (n = 29 cells) (Fig. 2B). The relationship between action potential width and intraburst firing frequency (Fig. 2C) shows that all FRB cells demonstrated action potential widths of <0.5 ms and intraburst firing frequencies of >350 Hz. We calculated an adaptation index value for each cell by dividing the number of spikes in the first 50 ms of a current pulse by the total number of spikes in the first 100 ms of the current pulse (Ada 50 adaptation index). The adaptation index values for all cells fell between 50 and 70%, with a mean of 55.1 ± 4.2% (Fig. 2D). Thus, the population of cells reported here is comprised of FRB cells according to the criteria developed by Nowak et al. (2003).
Figure 2.
Quantification of FRB cell firing characteristics. A, Mean action potential half-width at half-height was 0.38 ± 0.1 ms. B, Mean intraburst firing frequency was 490.1 ± 82.3 Hz. C, Both simple and complex FRB cells had action potential widths of <0.5 ms (vertical dashed line) and intraburst firing frequencies of >350 ms (horizontal dashed line), as shown by their position in the top left quadrant. D, The mean adaptation index was 55.1 ± 4.2%. E, Mean action potential (AP) duration (layer 2/3, 0.4 ± 0.06 ms; layer 4, 0.38 ± 0.06 ms; layer 5, 0.41 ms; layer 6, 0.37 ± 0.09 ms), intraburst frequency (Freq.) (layer 2/3, 462 ± 88.8 Hz; layer 4, 492 ± 85.4 Hz; layer 5, 529 Hz; layer 6, 514.5 ± 71.6 Hz), interburst frequency (layer 2/3, 49.9 ± 13.1 Hz; layer 4, 50.1 ± 11.6 Hz; layer 5, 48.1 Hz; layer 6, 47.5 ± 15.1 Hz), and adaptation index (layer 2/3, 56.9 ± 5.1%; layer 4, 53.1 ± 2.9%; layer 5, 53.4%; layer 6, 55.3 ± 3.7%) for FRB cells in each cortical layer. No significant differences were observed between layers. Error bars represent SEM.
We compared the intrinsic properties of FRB cells in different layers. Figure 2E shows a comparison of action potential duration, intraburst frequency, interburst frequency, and adaptation index values for FRB cells in layers 2/3 (n = 10), 4 (n = 8), 5 (n = 1), and 6 (n = 10). No significant differences were found between the layers for any of these parameters.
Functional properties of FRB cells
We observed both simple and complex FRB cells. Figure 3 shows representative examples of a simple FRB cell from layer 4 (left column) and a complex FRB cell from layer 2/3 (right column). Both cells responded to suprathreshold depolarizing current injection with characteristic spike bursts at 30-50 Hz (Fig. 3A). The simple cell produced bursts at 46.1 ± 12.7 Hz with an intraburst frequency of 399.3 ± 68.1 Hz (Fig. 3A, left column), and the complex cell produced bursts at 35.8 ± 7.8 Hz with an intraburst frequency of 383.4 ± 49.3 Hz (Fig. 3A, right column). In the simple cell, a drifting sinusoidal grating evoked a strong modulation of the Vm at the temporal frequency of the stimulus that was accompanied by bursts of action potentials (Fig. 3B, left column). In contrast, in the complex cell, a drifting sinusoidal grating evoked an unmodulated response consisting of large (15-20 mV) depolarizations at 10-20 Hz accompanied by a sustained increase in firing rate (Fig. 3B, right column). The F1/DC ratios for spikes were 1.62 and 0.56 for the simple and complex cell, respectively. The visually evoked spikes in the simple cell showed a characteristic FRB pattern (Fig. 3B, left column, detail) with a peak in the interspike interval histogram at very short interspike intervals (2.5 ms) and a secondary peak centered on 25 ms (∼40 Hz). The complex cell showed only the peak at short intervals (1.5 ms), indicating that although it produced characteristic high-frequency bursts in response to visual stimuli, they were not rhythmic (Fig. 3B, right column, detail).
Figure 3.
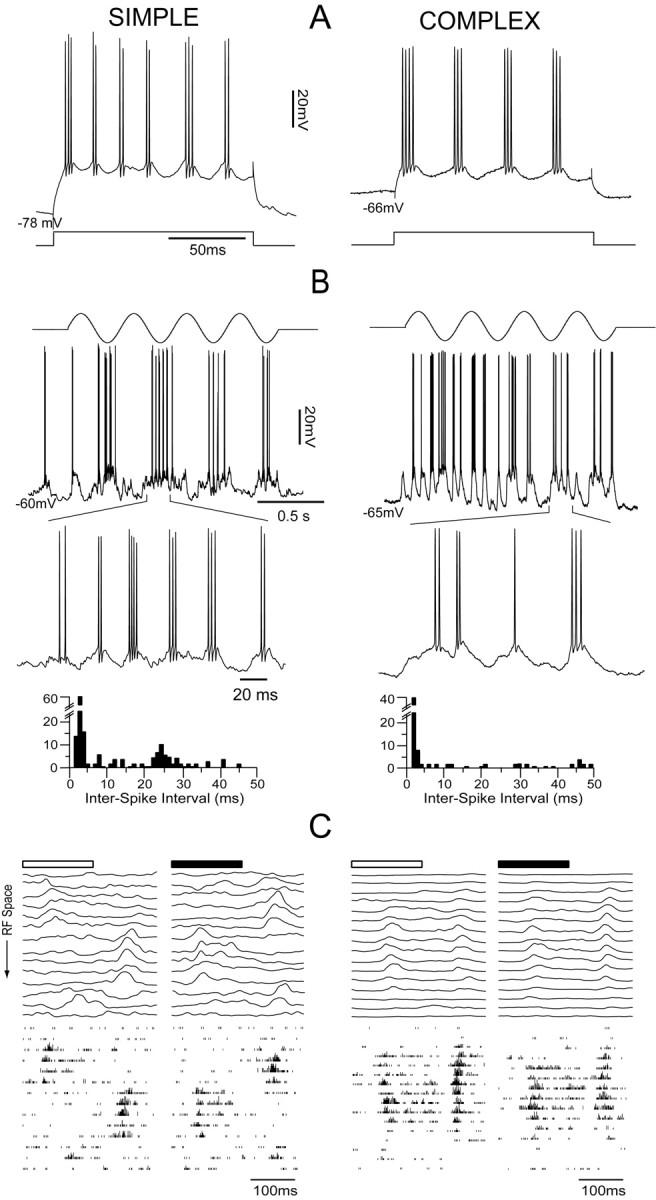
Simple and complex FRB cells. Representative examples of a simple FRB cell in layer 4 (left column) and a complex cell in layer 2/3 (right column). A, In response to current pulses of 0.75 nA, the simple cell fired spike bursts at 46.1 ± 12.7 Hz with intraburst firing at 399.3 ± 68.1 Hz, and the complex cell fired bursts at 35.8 ± 7.8 Hz with intraburst firing at 383.4 ± 49.3 Hz. B, In response to stimulationwith an optimal drifting grating (top), the simple cell showed a characteristic modulation of Vm and firing rate at the temporal frequency of the stimulus (middle trace). As shown by the enlarged portion (bottom trace) and the interspike interval histogram below, this cell demonstrated visually evoked bursts at 40 Hz. In contrast, in response to an optimal drifting grating (top), the complex cell showed a sustained, unmodulated increase in firing rate (middle trace). As shown by the enlarged portion (bottom trace) and the interspike interval histogram below, this cell fired some bursts of high-frequency action potentials but did not burst at 40 Hz. C, The one-dimensional spatiotemporal weighting function of the Vm response (top traces) represents the averaged responses to 12 presentations of a bright or dark bar in one of 14 positions in the receptive field (RF). The bottom traces represent the spike responses to the same stimuli. The simple cell (left) showed distinct regions of synaptic responses of opposite signs to the bright and dark bars. The complex cell (right) showed synaptic responses of the same sign to both bright and dark bars. The spike outputs of both cells (bottom) reflected the organization of their synaptic responses.
To further demonstrate the functional identity of the two cells, we mapped their receptive fields by averaging the responses to optimally oriented bright and dark bars presented at 16 positions spanning the full extent of the receptive field (one-dimensional spatial weighting function; see Materials and Methods). In Figure 3C (top), each trace is the mean of 12 stimulus presentations after spike removal, whereas the bottom panels are histograms showing the summed spike responses to the same 12 stimulus presentations. In each case, the responses to bright stimuli are shown on the left, and those to dark stimuli are shown on the right. The receptive field of the simple cell consisted of nonoverlapping subregions excited alternately by bright and dark stimuli. In any given subregion, stimuli of the “wrong” contrast evoked inhibitory responses (data not shown) (Palmer and Davis, 1981; Ferster, 1988; Hirsch, 2003). In contrast, the complex cell exhibited excitation to bright and dark stimuli throughout its receptive field. The spike outputs of both cells (Fig. 3C, bottom panels) reflected the organization of their synaptic responses.
FRB cells are present in cortical layers 2-6
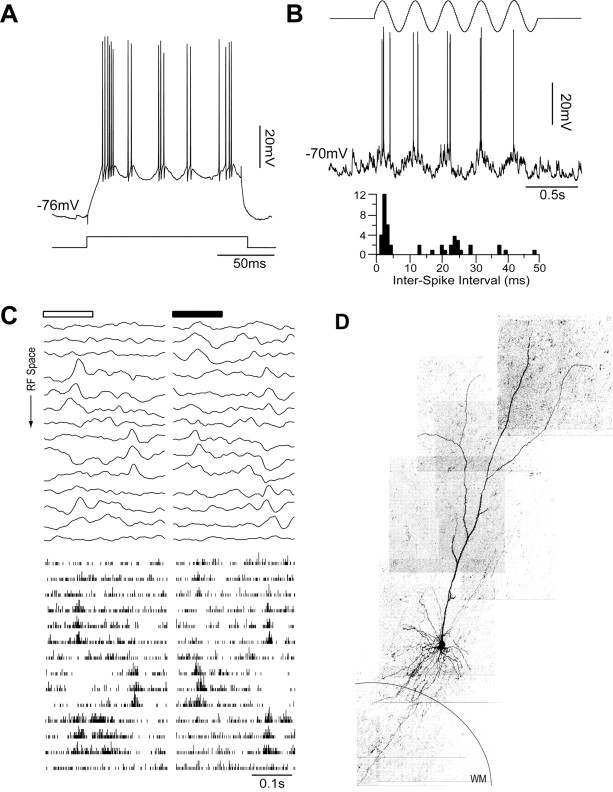
We found FRB cells in layers 2-6 of the primary visual cortex. Figure 4 shows an example of a simple FRB cell in layer 6. In this cell, a depolarizing current injection triggered rhythmic bursting at 46.1 ± 4.7 Hz with an intraburst frequency of 518.0 ± 70.6 Hz (Fig. 4A). An optimal drifting sinusoidal grating strongly modulated the Vm and the firing rate at the temporal frequency of the stimulus (Fig. 4B). The F1/DC ratio of the spike response for this cell was 1.91. The interstimulus interval histogram (Fig. 4B, bottom trace) calculated from the response to the drifting grating revealed a characteristic FRB firing pattern with a peak at very short intervals (2.5 ms) and a secondary peak centered at 24 ms. The receptive field consisted of subregions alternately excited by bright and dark stimuli. This is evident in the one-dimensional spatial weighting functions for both Vm (Fig. 4C, top) and spikes (Fig. 4C, bottom). The morphology of this cell is characteristic of pyramidal cells in the upper half of layer 6 (Fig. 4D), with a long apical dendrite extending toward the pia, a rich set of basilar dendrites, and an axon extending into the white matter.
Figure 4.
Representative example of a simple FRB cell in layer 6. A, This cell responded to a 0.85 nA depolarizing current pulse with bursts at 46.1 ± 4.7 Hz and an intraburst firing frequency of 518.0 ± 70.6 Hz. B, In response to an optimal drifting sinusoidal grating (top), the Vm and firing rate were modulated at the frequency of the stimulus. As shown by the interspike interval histogram below, the visual stimulus evoked the typical FRB pattern with a peak at very short intervals (2.5 ms) and a secondary peak centered on 24 ms. C, The Vm (top) and spike (bottom) responses show that the receptive field (RF) consisted of subregions alternately excited by bright and dark stimuli. D, This cell had a long apical dendrite extending toward the pia, a large number of basilar dendrites, and an axon extending toward the white matter (WM).
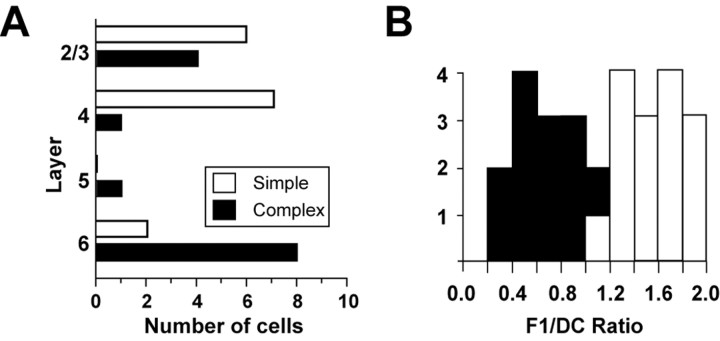
The distribution of all cells according to depth is shown in Figure 5A. Simple FRB cells (open bars) were found in layer 4, deep layer 3, and layer 6, whereas complex FRB cells (filled bars) were found in layers 2/3, 4, 5, and 6. Figure 5B shows the distribution of F1/DC response ratios taken from spike responses, with complex cells (n = 14) having a mean F1/DC ratio of 0.68 ± 0.2 and simple cells (n = 15) having a mean ratio of 1.57 ± 0.3.
Figure 5.
Laminar distribution of simple and complex FRB cells. A, Simple FRB cells (n = 15) were found in layers 2/3, 4, and 6. Complex FRB cells (n = 14) were found in layers 2/3, 4, 5, and 6. B, F1/DC ratios taken from the spike responses of the FRB cells. The mean complex F1/DC ratio was 0.68 ± 0.2 (filled bars), and the mean simple F1/DC ratio was 1.57 ± 0.3 (open bars).
Visually evoked membrane potential oscillations in simple and complex FRB cells
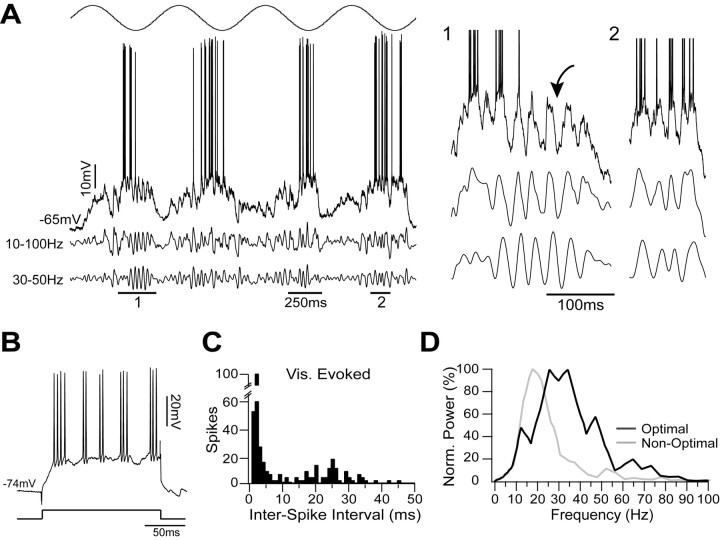
To verify whether the differences in γ activity observed between simple and complex FRB cells (Fig. 3) were consistent, we compared in detail the responses of a subset of simple (n = 10) and complex (n = 12) FRB cells to visual stimuli. Although all FRB cells responded similarly to depolarizing current injection (Figs. 1, 3, 4), visual stimuli elicited different oscillatory behavior from simple and complex cells. Figure 6 depicts an example of a representative simple FRB cell. This cell was classified as simple on the basis of the strong modulation of its Vm and spike output at the frequency of an optimal drifting grating (F1/DC ratio, 1.59) (Fig. 6A). Depolarizing current injection elicited a bursting pattern typical of FRB cells, with bursts at 51.9 ± 13.8 Hz and an intraburst firing frequency of 455.3 ± 80.6 Hz (Fig. 6B). Visual stimulation also resulted in rhythmic, high-frequency (∼400 Hz) bursts of action potentials at 40 Hz as indicated by the two peaks in the interspike interval histogram at ∼2.5 and 25 ms (Fig. 6C). After spike removal, the data were digitally filtered between 10 and 100 Hz (Fig. 6A, middle trace) and between 30 and 50 Hz (Fig. 6A, bottom trace). During the depolarizing phases of the response to the grating, both traces showed strong modulation at 40 Hz, which was often, but not always, accompanied by bursts of action potentials (Fig. 6A, details 1 and 2).
Figure 6.
Simple FRB cells show visually evoked γ oscillations. A, Simple cell stimulated with an optimal drifting sinusoidal grating (top). After spike removal, the trace was filtered between 10 and 100 Hz (middle trace) and between 30 and 50 Hz (bottom trace). During the depolarizing phases of the response to the grating, the traces showed a strong modulation at ∼40 Hz (details 1 and 2), which was often, but not always, accompanied by spikes (arrow). B, This cell responded to a depolarizing current pulse of 0.8 nA with the typical FRB bursting pattern. C, The interspike interval histogram of visually (Vis.) evoked activity showed a peak at short latencies (2.5 ms) and one centered on 25 ms. D, The power spectra of short epochs (400 ms; n = 8 epochs) from the 10-100 Hz filtered traces were calculated for an optimal stimulus and a nonoptimal stimulus (18° from optimal). Each set of power spectra was then averaged, and the resulting mean power spectrum was normalized (Norm.) to its maximum value. Whereas the mean power spectrum for the nonoptimal stimulus (gray line) showed the most power between 10 and 30 Hz, the power spectrum for the optimal stimulus (black line) showed increased power in the 30-50 Hz range.
To quantify the spectral content of the Vm behavior during visual stimulation, we calculated the power spectra of short epochs (400 ms; n = 8) from the 10-100 Hz filtered Vm traces. Figure 6D shows a comparison of the averaged power spectrum of the responses to an optimally oriented grating (Fig. 6D, black) with that of the responses to a nonoptimally oriented grating (18° deviated from optimal) (Fig. 6D, gray). Presentation of the optimally oriented stimulus resulted in a decrease of the relative power in the 10-30 Hz range and an increase of the relative power in the 30-50 Hz range. To quantify this shift in spectral composition, we compared the relative power within these two specific frequency bands during the two visual stimuli. Relative power was calculated as the total power within a frequency band divided by the total power between 10 and 100 Hz (see Materials and Methods). Relative power in the 10-30 Hz range was 0.74 during stimuli of the nonoptimal orientation and 0.35 during stimuli of optimal orientation. In contrast, relative power in the 30-50 Hz range was 0.12 during the nonoptimal orientation and 0.42 during the optimal orientation.
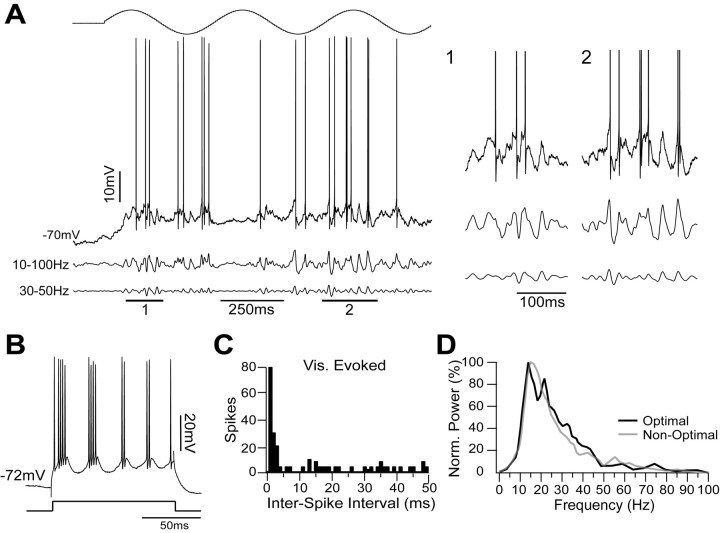
Similar visual stimulation of complex FRB cells yielded a different result. The cell in Figure 7 was classified as complex because of the lack of modulation of the Vm and spike responses to an optimal drifting grating (F1/DC ratio, 0.59) (Fig. 7A). Like the simple cell shown in Figure 6, this cell was classified as FRB, because it responded to depolarizing current injection with bursts at 46.4 ± 15.3 Hz and an intraburst firing frequency of 450.3 ± 42.8 (Fig. 7B). However, in contrast to the simple cell shown in Figure 6, visual stimulation generated high-frequency firing without a prominent peak at 25 ms in the interspike interval histogram (Fig. 7C). The underlying Vm oscillations shown in the filtered traces showed strong activity in the 10-30 Hz range but little activity in the 30-50 Hz range during the visual stimulation (Fig. 7A, details 1 and 2). The average power spectrum (400 ms; n = 8 epochs) during stimulation with the optimally oriented grating (Fig. 7D, light gray) showed only a very small increase in oscillations between 30 and 50 Hz compared with a nonoptimal stimulus (18° deviated from optimal) (Fig. 7D, dark gray). Relative power in the 10-30 Hz range was 0.59 during stimulation with the nonoptimal orientation and 0.63 during the optimal orientation. In contrast, relative power in the 30-50 Hz range was 0.13 during the nonoptimal orientation and 0.15 during the optimal orientation. These data suggest that changing the stimulus features modulates γ activity in simple, but not complex, FRB cells.
Figure 7.
In contrast to the simple FRB cells, the complex FRB cells did not show stimulus-dependent γ oscillations. A, Complex FRB cell stimulated with an optimal drifting sinusoidal grating (top). After spike removal, the trace was filtered between 10 and 100 Hz (middle trace) and between 30 and 50 Hz (bottom trace). During the visual stimulation, the cell showed a DC depolarization and large deflections at ∼20 Hz but very little γ activity (details 1 and 2). B, Like the simple cell, this cell responded to a depolarizing current pulse of 0.9 nA with the typical FRB bursting pattern. C, The interspike interval histogram of visually (Vis.) evoked activity showed a peak at short latencies but no peak at 25 ms. D, The normalized (Norm.) mean power spectrum (400 ms; n = 8) during stimulation with the optimally oriented grating (black line) showed only a very small increase in power between 30 and 50 Hz compared with the response to the nonoptimal grating (18° from optimal) (gray line).
Orientation dependence
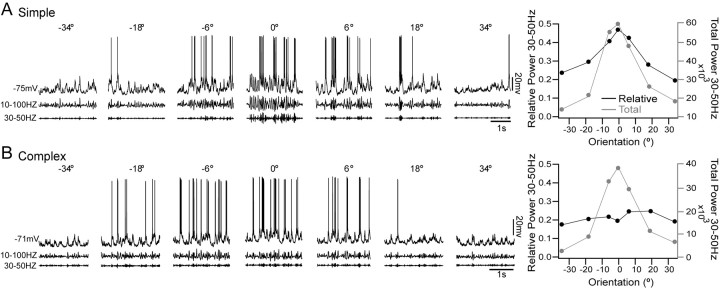
To quantify the observed relationship between stimulus features, such as orientation, and evoked Vm oscillations in our population of simple and complex FRB cells, we compared the responses of each cell to drifting gratings of varying orientations. In the examples shown in Figure 8, the optimal orientation has been normalized to 0°. We filtered the raw data (Fig. 8A, B, top traces) after spike removal between 10 and 100 Hz (middle traces) and between 30 and 50 Hz (bottom traces). Using the 10-100 Hz broadband filtered data, we calculated the total (Fig. 8A, B, right plots, gray line) and relative (black line) power between 30 and 50 Hz as a function of stimulus orientation. The simple cell in Figure 8A showed robust oscillations at 30-50 Hz at the optimal orientation of 0°. However, relative power in this range fell off as stimulus orientation deviated from optimal. Both total and relative power at 30-50 Hz increased as stimulus orientation approached optimal, indicating a specific increase in the 30-50 Hz range. In contrast, the complex cell shown in Figure 8B showed increases in total 30-50 Hz power with optimal stimulation but no increase in relative power in this range, indicating that activity increased nonspecifically over a broad range of 10-100 Hz.
Figure 8.
Orientation dependence of γ activity. A, Simple cell stimulated with sinusoidal drifting gratings at varying orientations. Optimal orientation is shown as 0°. After spike removal, the traces were filtered from 10 to 100 Hz (middle) and from 30 to 50 Hz (bottom). Increased 30-50 Hz activity can been seen in the filtered traces at optimal orientation. The graph to the right shows relative (black) and total (gray) power in the 30-50 Hz range during stimuli of each orientation. Both total and relative power between 30 and 50 Hz increased as the stimulus orientation approached optimal. B, Complex cell stimulated with sinusoidal drifting gratings at varying orientations. In contrast to the simple cell, little γ activity was present in the filtered traces. As shown by the graph on the right, total power in the 30-50 Hz range (gray) increased with orientation, but relative power (black) remained constant, suggesting a broadband response to the visual stimuli without a specific increase in γ oscillations.
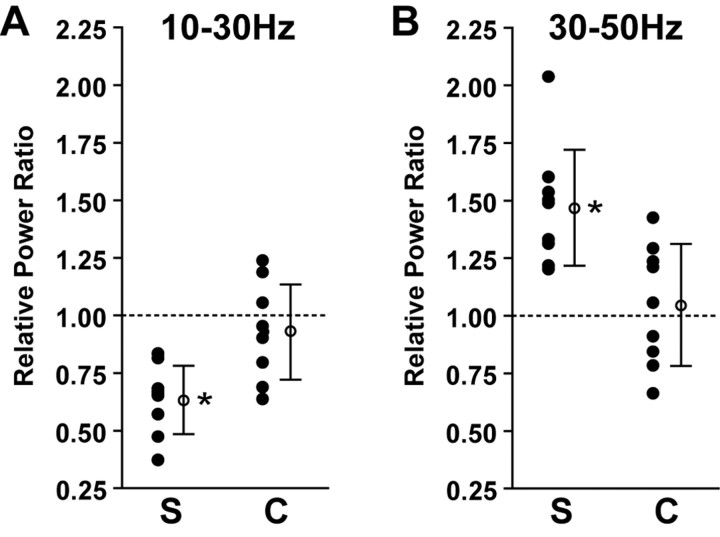
We quantified the 10-30 Hz and 30-50 Hz Vm activity during optimally and nonoptimally oriented visual stimuli for the populations of simple and complex FRB cells. The 10-30 Hz range was selected because of the observed stimulus-dependent shift from this range toward the 30-50 Hz range in simple FRB cells, as shown in Figure 6D. All stimuli were presented at optimal spatial and temporal frequency. Relative power ratios for a given frequency band were calculated by dividing the relative power in that band during optimal stimulation by the relative power in that band during nonoptimal stimulation (see Materials and Methods). Figure 9A shows the relative power ratios for the 10-30 Hz range in simple (left) and complex (right) cells. If the relative power in a range did not change with orientation, the expected ratio would be 1. A decrease in power during presentation of the optimal stimulus would yield a ratio of <1, whereas an increase in power would give a ratio of >1. The simple cells (n = 10) showed a mean relative power ratio in the 10-30 Hz range of 0.76 ± 0.2, indicating a significant decrease in that frequency range after a shift to the sinusoidal grating with optimal orientation (mean different from 1; p < 0.0001; one-sample t test) (Fig. 9A). In contrast, the complex cells (n = 12) showed a mean relative power ratio of 0.96 ± 0.2 in the 10-30 Hz range (mean not different from 1; p > 0.05), indicating an absence of a specific decrease in 10-30 Hz for the optimally oriented grating. The mean 10-30 Hz relative power ratio of the simple cells was significantly lower than that of the complex cells (p < 0.01; unpaired t test). During the same series of visual stimulations, the simple cells demonstrated a mean relative power ratio of 1.5 ± 0.3 in the 30-50 Hz range, indicating a significant increase during stimulation with an optimally oriented grating (mean different from 1; p < 0.0001) (Fig. 9B). In contrast, the complex cells demonstrated a mean relative power ratio of 1.0 ± 0.2 in the 30-50 Hz range (mean not different from 1; p > 0.05). The mean 30-50 Hz relative power ratio of the simple cells was significantly higher than that of the complex cells (p < 0.01). The Vm activity in every simple cell shifted from lower (10-30 Hz) to higher (30-50 Hz) frequencies as the stimulus approached optimal orientation. In contrast, complex cells showed a broadband increase in activity without a major change in spectral content.
Figure 9.
Specific increase in γ activity is orientation dependent in simple but not complex FRB cells. Relative power ratios were calculated as the relative power in a frequency range during an optimally oriented stimulus divided by the relative power in that range during a stimulus oriented 18° from optimal. If there was no impact of the stimulus on the spectral content of the Vm activity, the expected ratio would be 1. A, Power in the 10-30 Hz range was significantly decreased in simple cells (S) (n = 10; p < 0.0001) and unchanged in complex cells (C) (n = 12; p > 0.05) during stimuli of optimal orientation. The mean 10-30 Hz relative power ratio for the simple cells was significantly lower than that of the complex cells (p < 0.01; unpaired t test). B, In contrast, power in the 30-50 Hz range was significantly increased in simple cells (S) (p < 0.0001) and unchanged in the complex cells (C) (p > 0.05) during stimuli of optimal orientation. The mean 30-50 Hz relative power ratio for the simple cells was significantly higher than that of the complex cells (p < 0.01). Asterisks denote p < 0.01. Error bars represent SEM.
Stimulus intensity
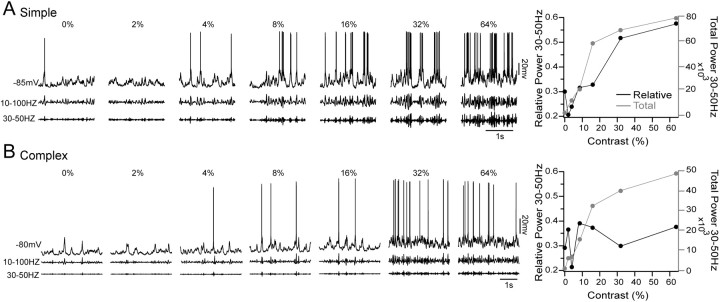
The preceding results establish a relationship between one stimulus feature, orientation, and the spectral content of the Vm response in FRB cells. To determine whether a similar relationship exists between stimulus intensity and Vm response, we also measured changes in Vm spectral content as a function of stimulus contrast for drifting grating stimuli of optimal parameters. Figure 10A shows the responses of a representative simple FRB cell to optimally oriented stimuli of 0, 2, 4, 8, 16, 32, and 64% contrasts. As contrast increased, both broadband oscillatory activity between 10 and 100 Hz (middle traces), and activity in the 30-50 Hz band (bottom traces) increased. The graph at right shows that both total (gray line) and relative (black line) power in the 30-50 Hz range increased strongly with contrast. However, the complex FRB cell shown in Figure 10B did not respond to increasing contrast with robust 30-50 Hz Vm oscillations. As depicted by the graph to the right, total power in the 30-50 Hz range increased with contrast (gray line), but relative power in this range did not (black line).
Figure 10.
Contrast dependence of γ activity. A, Simple FRB cell stimulated with optimal drifting sinusoidal gratings at contrasts of 0, 2, 4, 8, 16, 32, and 64%. After spike removal, the traces were filtered from 10 to 100 Hz (middle traces) and from 30 to 50 Hz (bottom traces). As the contrast increased, the amount of activity in the 30-50 Hz range also increased. The graph at the right shows the relative (black line) and total (gray line) power between 30 and 50 Hz at each contrast. Both total and relative power in this range rose as contrast increased. B, Complex FRB cell stimulated with optimal drifting sinusoidal gratings of varying contrasts. Unlike the simple cell, very little activity between 30 and 50 Hz was observed, even at high contrast. In the graph at right, total power (gray line) between 30 and 50 Hz increased with contrast, but relative power (black line) did not, suggesting a broadband increase in activity without a specific increase in γ oscillations.
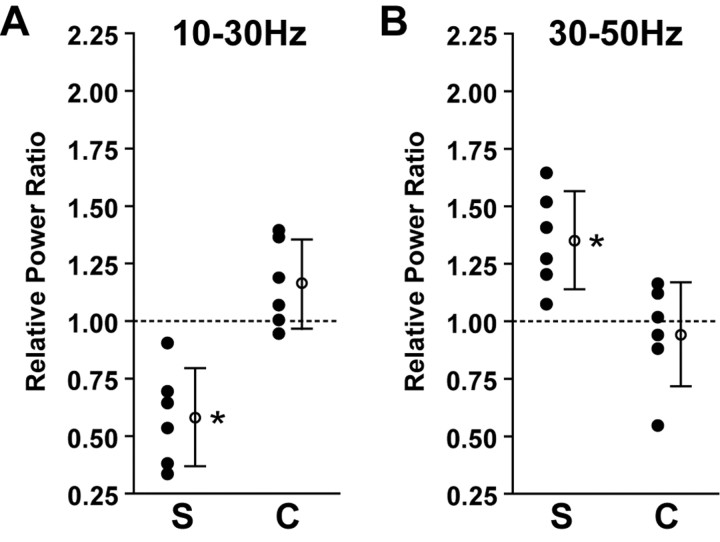
To quantify the effect of stimulus contrast on membrane potential activity in the population of simple and complex FRB cells, we again compared relative power in the 10-30 Hz and 30-50 Hz ranges during different stimuli. Relative power ratios were calculated by dividing the relative power within a frequency range during a stimulus of 64% contrast by the relative power within that range during a stimulus of 2% contrast. Figure 11A shows the relative power ratios for the 10-30 Hz range in simple (left) and complex (right) cells. The simple cells (n = 6) showed a mean relative power ratio of 0.58 ± 0.2 in the 10-30 Hz range, indicating a significant decrease after a shift to a sinusoidal grating of high contrast (mean different from 1; p < 0.001; one-sample t test) (Fig. 11A). Complex cells (n = 6) showed a mean relative power ratio of 1.16 ± 0.2 in the 10-30 Hz range (mean not different from 1; p > 0.05). The mean 10-30 Hz relative power ratio of the simple cells was significantly lower than that of the complex cells (p < 0.01; unpaired t test). During the same series of visual stimulations, the simple cells demonstrated a mean relative power ratio of 1.36 ± 0.2 in the 30-50 Hz range, indicating a significant increase after stimulation with a high-contrast grating (mean different from 1; p < 0.001) (Fig. 11B). In contrast, the complex cells demonstrated a mean relative power ratio of 0.95 ± 0.2 in the 30-50 Hz range (mean not different from 1; p > 0.05). The mean 30-50 Hz relative power ratio of the simple cells was significantly higher than that of the complex cells (p < 0.01). Increasing stimulus intensity thus led to a shift in the spectral composition of simple, but not complex, FRB cells from lower (10-30 Hz) to higher (30-50 Hz) frequencies.
Figure 11.
Specific increase in γ activity is contrast dependent in simple but not complex FRB cells. Relative power ratios were calculated using the responses to drifting sinusoidal gratings at contrasts of 2 and 64% contrasts. A, Power in the 10-30 Hz range was significantly decreased in simple cells (S) (n = 6; p < 0.001) and unchanged in complex cells (C) (n = 6; p > 0.05) during stimuli of optimal orientation. The mean 10-30 Hz relative power ratio for the simple cells was significantly lower than that of the complex cells (p < 0.01). B, In contrast, power in the 30-50 Hz range was significantly increased in simple cells (S) (p < 0.001) and unchanged in the complex cells (C) (p > 0.05) during stimuli of optimal orientation. The mean 30-50 Hz relative power ratio for the simple cells was significantly higher than that of the complex cells (p < 0.01). Asterisks denote p < 0.01. Error bars represent SEM.
Synaptic generation of γ oscillations
The γ oscillations observed in FRB cells in response to visual stimulation could derive from intrinsic cellular properties, rhythmic synaptic input, or a combination of both. γ oscillations based on FRB intrinsic properties are only generated at suprathreshold membrane potentials (Fig. 1B) (Gray and McCormick, 1996; Steriade et al., 1998; Brumberg et al., 2000). The degree to which γ oscillations are reduced by hyperpolarization below threshold is thus a measure of the contribution by mechanisms intrinsic to the cell. We therefore measured the relative power between 30-50 Hz in the Vm responses of simple and complex FRB cells to optimal gratings of increasing contrast (0-64%) at rest and under hyperpolarization.
Figure 12, A and B, shows the responses of a simple and a complex cell, respectively, to an optimal grating of 64% contrast shown while the cell was at rest (left) and under hyperpolarization (right). In each case, the relative amount of γ-range activity was unchanged despite the fact that no suprathreshold response was evoked during hyperpolarization. Figure 12C shows the relative power in the 30-50 Hz band measured in each cell for stimuli of each contrast at each Vm. As already shown in Figures 10 and 11, the relative power in the 30-50 Hz range increased with contrast in the response of the simple cell but stayed relatively constant in the response of the complex cell. However, there was no impact of Vm hyperpolarization on the contrast dependence of γ activity in either cell. We observed similar results in other cells (n = 5 simple; n = 3 complex). Mean Vm at rest was -65.8 ± 4.0 mV and mean hyperpolarized Vm was -89.0 ± 3.9 mV. During 64% contrast stimulation in simple FRB cells, the mean relative power in the 30-50 Hz band at rest was 0.43 ± 0.03 and during hyperpolarization was 0.48 ± 0.02 (p > 0.05; Wilcoxon matched-pairs test). During 64% contrast stimulation in complex cells, the mean relative power in the 30-50 Hz band at rest was 0.19 ± 0.01, and during hyperpolarization Vm was 0.20 ± 0.02 (p > 0.05). These results show that the synaptic input observed during visual stimulation contains the same relative power at γ frequencies as the suprathreshold response, suggesting that visually evoked γ oscillations in FRB cells are in large part generated by synaptic inputs rather than intrinsic properties.
Figure 12.
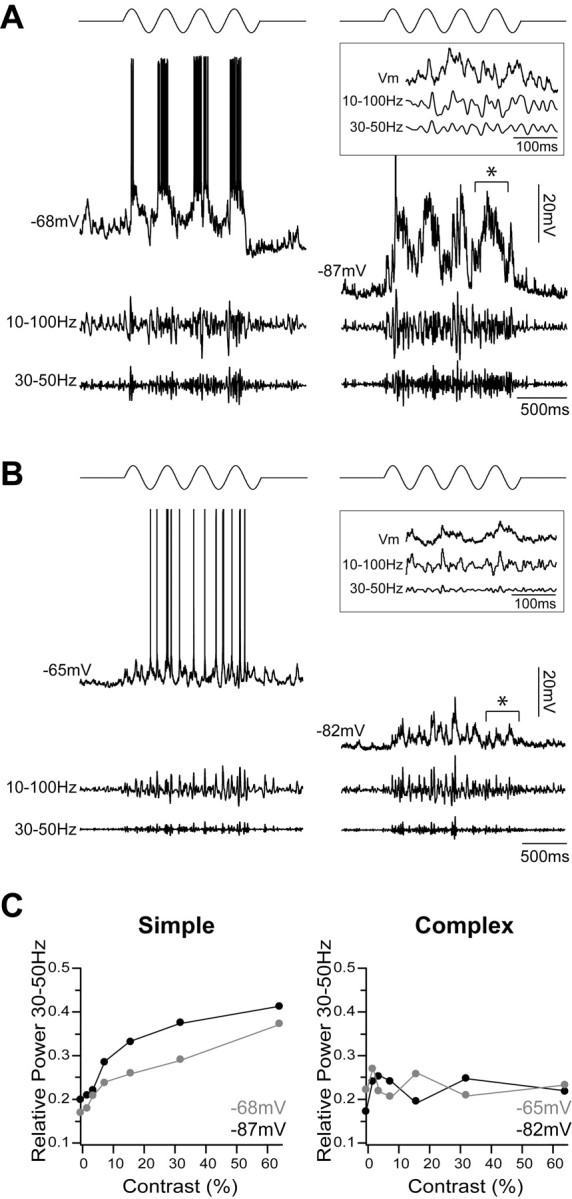
γ oscillations in Vm responses to visual stimuli are generated by synaptic input. A, Simple FRB cell stimulated with a sinusoidal drifting grating of 64% contrast (top) at resting Vm (left) and under enough hyperpolarization to preclude a suprathreshold response (right). After spike removal, the traces were filtered from 10 to 100 Hz (middle traces) and from 30 to 50 Hz (bottom traces). The relative amount of γ activity did not change under hyperpolarization. An expanded example of subthreshold activity, denoted by the asterisk, is shown in the inset box. B, Complex FRB cell stimulated with an optimal sinusoidal drifting grating of 64% contrast. As observed with the simple cell, an equivalent amount of γ activity was evoked at rest (left) and during hyperpolarization (right). Again, an expanded example of subthreshold activity, denoted by the asterisk, is shown in the inset box. C, Relative power in the 30-50 Hz range was measured for stimuli of 0, 2, 4, 8, 16, 32, and 64% contrasts at resting (gray) and hyperpolarized (black) membrane potentials. As shown in Figures 10 and 11, relative 30-50 Hz power increased with contrast in the simple cell (left) and was invariant in the complex cell (right). There was no effect of Vm on γ activity in either cell, suggesting a synaptic, rather than intrinsic, origin.
Discussion
We investigated the stimulus-evoked responses of FRB cells [also called chattering cells (Gray and McCormick, 1996)] in the cat primary visual cortex in vivo. We found that FRB cells were either simple or complex and were distributed throughout layers 2-6. Simple and complex FRB cells exhibited indistinguishable intrinsic properties in response to suprathreshold current pulses but demonstrated significantly different oscillatory responses to visual stimuli. Optimal visual stimuli evoked a specific increase in relative power in the γ (30-50 Hz) frequency band in the responses of simple, but not complex, FRB cells. This change in spectral composition was both orientation and contrast dependent, suggesting that it was mainly related to the degree of activation of the local network. Hyperpolarization with current injection did not change the relative amount of γ activity in the Vm of FRB cells during visual stimulation, suggesting that the visually evoked γ oscillations were primarily caused by rhythmic synaptic input.
Intrinsic properties of FRB cells
Using the quantitative criteria developed by Nowak et al. (2003), we showed that the FRB cells reported here are identical to the chattering cells reported in previous studies (Gray and McCormick, 1996; Brumberg et al., 2000; Nowak et al., 2003). Our data agree well with current-source density analysis showing that γ oscillations are associated with alternating microsources and miscrosinks throughout all layers (Steriade and Amzica, 1996). Our data are also in agreement with a previous extracellular study in which no laminar bias was found in the distribution of cortical cells that demonstrated visually evoked γ activity (Ghose and Freeman, 1992).
FRB cells represent a population of bursting cortical neurons with intrinsic properties not shared by regular spiking, fast spiking, or intrinsically bursting cells (Connors et al., 1982; Connors and Gutnick, 1990; Nowak et al., 2003). After depolarization with a suprathreshold current pulse, FRB cells produce repetitive, high-frequency (350-700 Hz) bursts of action potentials at 30-50 Hz (Gray and McCormick, 1996; Steriade et al., 1998; Brumberg et al., 2000; Nowak et al., 2003). They also display very short (<0.5 ms) action potentials and a large AHP followed by an ADP. Bursts of high-frequency action potentials in FRB cells are based on a suprathreshold mechanism that depends on the persistent Na+ current, responsible for the ADP, and a fast K+ current, responsible for the fast spike repolarization and the AHP (Brumberg et al., 2000). As shown in Figure 1 (Steriade et al., 1998; Brumberg et al., 2000), subthreshold depolarization does not evoke γ oscillations in FRB cells.
Visual properties of FRB cells
Although a previous report found that FRB cells in the visual cortex were restricted to the superficial cortical layers (Gray and McCormick, 1996), we found FRB cells throughout the primary visual cortex, including the deep layers. Cells in the visual cortex are differentiated into two functional categories, simple and complex, based on their synaptically determined receptive field properties (Hubel and Wiesel, 1962; Palmer and Davis, 1981; Ferster, 1988; Hirsch, 2003). Previous findings suggested that all FRB cells are simple (Gray and McCormick, 1996). In contrast, we found simple FRB cells in layers 2/3, 4, and 6 and complex FRB cells in layers 2/3, 4, 5, and 6.
γ activity in simple and complex FRB cells
Simple and complex FRB cells generated identical trains of spike bursts at γ frequency when activated with suprathreshold current pulses, but only simple FRB cells responded to optimal visual stimuli with a shift in membrane potential activity from lower (10-30 Hz) to higher (30-50 Hz) frequencies and spike bursts at 30-50 Hz. The responses of the simple cells shown here are in agreement with previous observations of visually evoked γ activity in simple FRB cells in layer 2/3 (Gray and McCormick, 1996). Although the simple FRB cells reported here all expressed a selective, visually evoked increase in γ activity, the population of complex FRB cells was more variable, with some cells showing a small increase in γ activity, and others showing a decrease or no change. As a group, complex FRB cells did not show a significant change in relative γ-band power in response to visual stimuli. As described above, the intrinsic generation of FRB γ oscillations depends on ionic conductances active only during suprathreshold depolarization. If the γ oscillations observed during visual stimulation were caused by activation of the intrinsic properties of the cell by depolarization, power in the γ range would decrease after hyperpolarization below threshold. Hyperpolarizing simple and complex FRB cells so that the response to visual stimulation was entirely subthreshold did not change the relative power of γ oscillations in the Vm response in either class of cells. These results suggest that visually evoked γ oscillations in the Vm of FRB cells may be primarily imposed by rhythmic synaptic input during visual stimulation, rather than resulting from activation of the intrinsic conductances of the recorded neuron. Our results are in agreement with preliminary observations of barrages of 40 Hz synaptic activity in FRB cells (Gray and McCormick, 1996; Steriade et al., 1998). In addition, our observations agree well with findings that the repetitive burst discharges of FRB neurons occur in close association with γ oscillations in the local field potentials (Gray and Singer, 1989; Steriade and Amzica, 1996; Steriade et al., 1996), which predominantly reflect synaptic activity (Eccles et al., 1966; Niedermeyer and Lopes da Silva, 2005).
Several possible synaptic mechanisms may underlie the different expression of γ activity in simple and complex FRB cells. The functional properties of simple and complex cells are determined by the structure of their synaptic input. Simple cells receive substantial thalamic input (Humphrey et al., 1985; Stratford et al., 1996; Usrey et al., 2000; Alonso et al., 2001; Kara et al., 2002), whereas complex cells are likely dominated by corticocortical input (Alonso and Martinez, 1998; Martinez and Alonso, 2001). Thus, one straightforward possibility is that synchronized thalamic input rich in γ oscillations is imposed on target simple FRB cells and further amplified by resonance with their suprathreshold intrinsic electrophysiological properties. In turn, complex FRB cells may receive synaptic inputs from cortical cells that individually express γ activity but are not in temporal phase with each other, generating a broadband response to visual stimuli. Several lines of evidence suggest that thalamocortical projections play a role in generating cortical γ oscillations. Individual cells in the LGN oscillate in the 20-80 Hz range (Bishop et al., 1964; Arnett, 1975; Munemori et al., 1984; Neuenschwander and Singer, 1996), and these oscillations may be synchronous with γ activity originating in the retina (Ghose and Freeman, 1992). Many thalamocortical cells also display spontaneous and depolarization-induced oscillations in the 30-80 Hz range (Steriade et al., 1993; Pedroarena and Llinás, 1997) that are transferred to cortical cells (Steriade et al., 1991). However, our observation of FRB cells in layer 6 supports the idea that γ activity in the cortex may also potentiate thalamic oscillations through a corticothalamocortical feedback loop (Castelo-Branco et al., 1998).
An alternative mechanism underlying differential γ expression by simple and complex FRB cells is that the two populations of cells may receive equivalent synaptically generated γ activity but exhibit different postsynaptic processing. For instance, simple and complex FRB cells might exhibit different dendritic conductances (Schwindt and Crill, 1999; Hausser et al., 2000). However, such differences are beyond the resolution of our current-clamp recordings.
Role of FRB cells in cortical γ oscillations
Our results suggest that visually evoked γ oscillations in FRB cells may be primarily the result of network input, rather than the intrinsic properties of the individually recorded neurons. However, this observation does not preclude a critical role for FRB cells in neocortical oscillations. The high-frequency bursts of action potentials, which represent the electrophysiological signature of FRB cells, generate powerful excitatory synaptic potentials in their targets. The profuse axonal projections of FRB cells suggest that they contact many postsynaptic targets, possibly including other FRB cells (Gray and McCormick, 1996; Steriade et al., 1998; Cunningham et al., 2004; Traub et al., 2005b). Thus, each FRB cell may receive synaptic input rich in γ activity, which would be amplified by the intrinsic suprathreshold properties of the cell and contributed back to the local network. In fact, several lines of evidence suggest that FRB cells are necessary for the expression of γ activity in the cortex. Blocking FRB burst firing with phenytoin (a blocker of persistent Na+) eliminates kainite-induced γ activity in neocortical slices (Cunningham et al., 2004). Similarly, blocking gap junctions with carbenoxolone eliminates γ-band power in local field potentials (Traub et al., 2005a). In addition, computer models suggest participation of FRB cells in the generation of γ oscillations via axonal gap junctions between themselves and with other pyramidal cells in the network (Cunningham et al., 2004; Traub et al., 2005a). Our results showing visually evoked γ activity in simple FRB cells further support a critical role for these cells in amplifying and distributing γ oscillations in the primary visual cortex.
Footnotes
This work was sponsored by the National Institutes of Health-National Eye Institute. We thank Esther Garcia de Yebenes for the histology and Michael J. Higley, Mircea Steriade, and Roger D. Traub for helpful comments during the preparation of this manuscript.
Correspondence should be addressed to Diego Contreras, Department of Neuroscience, University of Pennsylvania School of Medicine, 215 Stemmler Hall, Philadelphia, PA 19106-6074. E-mail: diegoc@mail.med.upenn.edu.
Copyright © 2005 Society for Neuroscience 0270-6474/05/255339-12$15.00/0
References
- Alonso JM, Martinez LM (1998) Functional connectivity between simple cells and complex cells in cat striate cortex. Nat Neurosci 1: 395-403. [DOI] [PubMed] [Google Scholar]
- Alonso JM, Usrey WM, Reid RC (2001) Rules of connectivity between geniculate cells and simple cells in cat primary visual cortex. J Neurosci 21: 4002-4015. [DOI] [PMC free article] [PubMed] [Google Scholar]
- Arnett DW (1975) Correlation analysis of units recorded in the cat dorsal lateral geniculate nucleus. Exp Brain Res 24: 111-130. [DOI] [PubMed] [Google Scholar]
- Bal T, McCormick DA (1993) Mechanisms of oscillatory activity in guineapig nucleus reticularis thalami in vitro: a mammalian pacemaker. J Physiol (Lond) 468: 669-691. [DOI] [PMC free article] [PubMed] [Google Scholar]
- Bertrand O, Tallon-Baudry C (2000) Oscillatory gamma activity in humans: a possible role for object representation. Int J Psychophysiol 38: 211-223. [DOI] [PubMed] [Google Scholar]
- Bishop PO, Levick WR, Williams WO (1964) Statistical analysis of the dark discharge of lateral geniculate neurones. J Physiol (Lond) 170: 598-612. [DOI] [PMC free article] [PubMed] [Google Scholar]
- Bouyer JJ, Montaron MF, Rougeul A (1981) Fast fronto-parietal rhythms during combined focused attentive behaviour and immobility in cat: cortical and thalamic localizations. Electroencephalogr Clin Neurophysiol 51: 244-252. [DOI] [PubMed] [Google Scholar]
- Bremer F (1958) Cerebral and cerebellar potentials. Physiol Rev 38: 357-388. [DOI] [PubMed] [Google Scholar]
- Brumberg JC, Nowak LG, McCormick DA (2000) Ionic mechanisms underlying repetitive high-frequency burst firing in supragranular cortical neurons. J Neurosci 20: 4829-4843. [DOI] [PMC free article] [PubMed] [Google Scholar]
- Castelo-Branco M, Neuenschwander S, Singer W (1998) Synchronization of visual responses between the cortex, lateral geniculate nucleus, and retina in the anesthetized cat. J Neurosci 18: 6395-6410. [DOI] [PMC free article] [PubMed] [Google Scholar]
- Connors BW, Gutnick MJ (1990) Intrinsic firing patterns of diverse neocortical neurons. Trends Neurosci 13: 99-104. [DOI] [PubMed] [Google Scholar]
- Connors BW, Gutnick MJ, Prince DA (1982) Electrophysiological properties of neocortical neurons in vitro. J Neurophysiol 48: 1302-1320. [DOI] [PubMed] [Google Scholar]
- Contreras D, Curro Dossi R, Steriade M (1993) Electrophysiological properties of cat reticular thalamic neurones in vivo. J Physiol (Lond) 470: 273-294. [DOI] [PMC free article] [PubMed] [Google Scholar]
- Cunningham MO, Whittington MA, Bibbig A, Roopun A, LeBeau FE, Vogt A, Monyer H, Buhl EH, Traub RD (2004) A role for fast rhythmic bursting neurons in cortical gamma oscillations in vitro. Proc Natl Acad Sci USA 101: 7152-7157. [DOI] [PMC free article] [PubMed] [Google Scholar]
- Eccles JC, Llinás R, Sasaki K (1966) The action of antidromic impulses on the cerebellar Purkinje cells. J Physiol (Lond) 182: 316-345. [DOI] [PMC free article] [PubMed] [Google Scholar]
- Ferster D (1988) Spatially opponent excitation and inhibition in simple cells of the cat visual cortex. J Neurosci 8: 1172-1180. [DOI] [PMC free article] [PubMed] [Google Scholar]
- Freeman WJ, van Dijk BW (1987) Spatial patterns of visual cortical fast EEG during conditioned reflex in a rhesus monkey. Brain Res 422: 267-276. [DOI] [PubMed] [Google Scholar]
- Ghose GM, Freeman RD (1992) Oscillatory discharge in the visual system: does it have a functional role? J Neurophysiol 68: 1558-1574. [DOI] [PubMed] [Google Scholar]
- Gray CM, McCormick DA (1996) Chattering cells: superficial pyramidal neurons contributing to the generation of synchronous oscillations in the visual cortex. Science 274: 109-113. [DOI] [PubMed] [Google Scholar]
- Gray CM, Singer W (1989) Stimulus-specific neuronal oscillations in orientation columns of cat visual cortex. Proc Natl Acad Sci USA 86: 1698-1702. [DOI] [PMC free article] [PubMed] [Google Scholar]
- Hausser M, Spruston N, Stuart GJ (2000) Diversity and dynamics of dendritic signaling. Science 290: 739-744. [DOI] [PubMed] [Google Scholar]
- Hirsch JA (2003) Synaptic physiology and receptive field structure in the early visual pathway of the cat. Cereb Cortex 13: 63-69. [DOI] [PubMed] [Google Scholar]
- Hubel DH, Wiesel TN (1962) Receptive fields, binocular interaction and functional architecture in the cat's visual cortex. J Physiol (Lond) 160: 106-154. [DOI] [PMC free article] [PubMed] [Google Scholar]
- Humphrey AL, Sur M, Uhlrich DJ, Sherman SM (1985) Projection patterns of individual X- and Y-cell axons from the lateral geniculate nucleus to cortical area 17 in the cat. J Comp Neurol 233: 159-189. [DOI] [PubMed] [Google Scholar]
- Hutcheon B, Yarom Y (2000) Resonance, oscillation and the intrinsic frequency preferences of neurons. Trends Neurosci 23: 216-222. [DOI] [PubMed] [Google Scholar]
- Jagadeesh B, Gray CM, Ferster D (1992) Visually evoked oscillations of membrane potential in cells of cat visual cortex. Science 257: 552-554. [DOI] [PubMed] [Google Scholar]
- Joliot M, Ribary U, Llinás R (1994) Human oscillatory brain activity near 40 Hz coexists with cognitive temporal binding. Proc Natl Acad Sci USA 91: 11748-11751. [DOI] [PMC free article] [PubMed] [Google Scholar]
- Jones MS, Barth DS (1997) Sensory-evoked high-frequency (gamma-band) oscillating potentials in somatosensory cortex of the unanesthetized rat. Brain Res 768: 167-176. [DOI] [PubMed] [Google Scholar]
- Kara P, Pezaris JS, Yurgenson S, Reid RC (2002) The spatial receptive field of thalamic inputs to single cortical simple cells revealed by the interaction of visual and electrical stimulation. Proc Natl Acad Sci USA 99: 16261-16266. [DOI] [PMC free article] [PubMed] [Google Scholar]
- König P, Engel AK, Singer W (1995) Relation between oscillatory activity and long-range synchronization in cat visual cortex. Proc Natl Acad Sci USA 92: 290-294. [DOI] [PMC free article] [PubMed] [Google Scholar]
- Kwon JS, O'Donnell BF, Wallenstein GV, Greene RW, Hirayasu Y, Nestor PG, Hasselmo ME, Potts GF, Shenton ME, McCarley RW (1999) Gamma frequency-range abnormalities to auditory stimulation in schizophrenia. Arch Gen Psychiatry 56: 1001-1005. [DOI] [PMC free article] [PubMed] [Google Scholar]
- Llinás RR (1988) The intrinsic electrophysiological properties of mammalian neurons: insights into central nervous system function. Science 242: 1654-1664. [DOI] [PubMed] [Google Scholar]
- Llinás RR, Grace AA, Yarom Y (1991) In vitro neurons in mammalian cortical layer 4 exhibit intrinsic oscillatory activity in the 10- to 50-Hz frequency range. Proc Natl Acad Sci USA 88: 897-901. [DOI] [PMC free article] [PubMed] [Google Scholar]
- Lopes da Silva FH, van Rotterdam A, Storm van Leeuwen W, Tielen AM (1970) Dynamic characteristics of visual evoked potentials in the dog. II. Beta frequency selectivity in evoked potentials and background activity. Electroencephalogr Clin Neurophysiol 29: 260-268. [DOI] [PubMed] [Google Scholar]
- Martinez LM, Alonso JM (2001) Construction of complex receptive fields in cat primary visual cortex. Neuron 32: 515-525. [DOI] [PubMed] [Google Scholar]
- Movshon JA, Thompson ID, Tolhurst DJ (1978) Spatial summation in the receptive fields of simple cells in the cat's striate cortex. J Physiol (Lond) 283: 53-77. [DOI] [PMC free article] [PubMed] [Google Scholar]
- Munemori J, Hara K, Kimura M, Sato R (1984) Statistical features of impulse trains in cat's lateral geniculate neurons. Biol Cybern 50: 167-172. [DOI] [PubMed] [Google Scholar]
- Murthy VN, Fetz EE (1992) Coherent 25- to 35-Hz oscillations in the sensorimotor cortex of awake behaving monkeys. Proc Natl Acad Sci USA 89: 5670-5674. [DOI] [PMC free article] [PubMed] [Google Scholar]
- Neuenschwander S, Singer W (1996) Long-range synchronization of oscillatory light responses in the cat retina and lateral geniculate nucleus. Nature 379: 728-732. [DOI] [PubMed] [Google Scholar]
- Niedermeyer E, Lopes da Silva F (2005) Electroencephalography: basic principles, clinical applications, and related fields, Ed 5. Philadelphia: Lippincott Williams and Wilkins.
- Nowak LG, Azouz R, Sanchez-Vives MV, Gray CM, McCormick DA (2003) Electrophysiological classes of cat primary visual cortical neurons in vivo as revealed by quantitative analyses. J Neurophysiol 89: 1541-1566. [DOI] [PubMed] [Google Scholar]
- Nuñez A, Amzica F, Steriade M (1992) Voltage-dependent fast (20-40 Hz) oscillations in long-axoned neocortical neurons. Neuroscience 51: 7-10. [DOI] [PubMed] [Google Scholar]
- Palmer LA, Davis TL (1981) Receptive-field structure in cat striate cortex. J Neurophysiol 46: 260-276. [DOI] [PubMed] [Google Scholar]
- Pantev C, Makeig S, Hoke M, Galambos R, Hampson S, Gallen C (1991) Human auditory evoked gamma-band magnetic fields. Proc Natl Acad Sci USA 88: 8996-9000. [DOI] [PMC free article] [PubMed] [Google Scholar]
- Pedroarena C, Llinás R (1997) Dendritic calcium conductances generate high-frequency oscillation in thalamocortical neurons. Proc Natl Acad Sci USA 94: 724-728. [DOI] [PMC free article] [PubMed] [Google Scholar]
- Pinault D, Deschênes M (1992) Voltage-dependent 40-Hz oscillations in rat reticular thalamic neurons in vivo. Neuroscience 51: 245-258. [DOI] [PubMed] [Google Scholar]
- Rhodes PA, Llinás R (2005) A model of thalamocortical relay cells. J Physiol (Lond), in press. [DOI] [PMC free article] [PubMed]
- Ribary U, Ioannides AA, Singh KD, Hasson R, Bolton JP, Lado F, Mogilner A, Llinas R (1991) Magnetic field tomography of coherent thalamocortical 40-Hz oscillations in humans. Proc Natl Acad Sci USA 88: 11037-11041. [DOI] [PMC free article] [PubMed] [Google Scholar]
- Schwindt P, Crill W (1999) Mechanisms underlying burst and regular spiking evoked by dendritic depolarization in layer 5 cortical pyramidal neurons. J Neurophysiol 81: 1341-1354. [DOI] [PubMed] [Google Scholar]
- Singer W, Gray CM (1995) Visual feature integration and the temporal correlation hypothesis. Annu Rev Neurosci 18: 555-586. [DOI] [PubMed] [Google Scholar]
- Skottun BC, De Valois RL, Grosof DH, Movshon JA, Albrecht DG, Bonds AB (1991) Classifying simple and complex cells on the basis of response modulation. Vision Res 31: 1079-1086. [DOI] [PubMed] [Google Scholar]
- Steriade M (2004) Neocortical cell classes are flexible entities. Nat Rev Neurosci 5: 121-134. [DOI] [PubMed] [Google Scholar]
- Steriade M, Amzica F (1996) Intracortical and corticothalamic coherency of fast spontaneous oscillations. Proc Natl Acad Sci USA 93: 2533-2538. [DOI] [PMC free article] [PubMed] [Google Scholar]
- Steriade M, Dossi RC, Paré D, Oakson G (1991) Fast oscillations (20-40 Hz) in thalamocortical systems and their potentiation by mesopontine cholinergic nuclei in the cat. Proc Natl Acad Sci USA 88: 4396-4400. [DOI] [PMC free article] [PubMed] [Google Scholar]
- Steriade M, Curro Dossi R, Contreras D (1993) Electrophysiological properties of intralaminar thalamocortical cells discharging rhythmic (approximately 40 HZ) spike-bursts at approximately 1000 HZ during waking and rapid eye movement sleep. Neuroscience 56: 1-9. [DOI] [PubMed] [Google Scholar]
- Steriade M, Amzica F, Contreras D (1996) Synchronization of fast (30-40 Hz) spontaneous cortical rhythms during brain activation. J Neurosci 16: 392-417. [DOI] [PMC free article] [PubMed] [Google Scholar]
- Steriade M, Timofeev I, Durmuller N, Grenier F (1998) Dynamic properties of corticothalamic neurons and local cortical interneurons generating fast rhythmic (30-40 Hz) spike bursts. J Neurophysiol 79: 483-490. [DOI] [PubMed] [Google Scholar]
- Stratford KJ, Tarczy-Hornoch K, Martin KA, Bannister NJ, Jack JJ (1996) Excitatory synaptic inputs to spiny stellate cells in cat visual cortex. Nature 382: 258-261. [DOI] [PubMed] [Google Scholar]
- Tallon-Baudry C, Bertrand O, Delpuech C, Pernier J (1996) Stimulus specificity of phase-locked and non-phase-locked 40 Hz visual responses in human. J Neurosci 16: 4240-4249. [DOI] [PMC free article] [PubMed] [Google Scholar]
- Traub RD, Bibbig A, Lebeau FE, Cunningham MO, Whittington MA (2005a) Persistent gamma oscillations in superficial layers of rat auditory neocortex: experiment and model. J Physiol (Lond) 562: 3-8. [DOI] [PMC free article] [PubMed] [Google Scholar]
- Traub RD, Contreras D, Cunningham MO, Murray H, Lebeau FE, Roopun A, Bibbig A, Wilent WB, Higley M, Whittington MA (2005b) A single-column thalamocortical network model exhibiting gamma oscillations, sleep spindles and epileptogenic bursts. J Neurophysiol 93: 2194-2232. [DOI] [PubMed] [Google Scholar]
- Usrey WM, Alonso JM, Reid RC (2000) Synaptic interactions between thalamic inputs to simple cells in cat visual cortex. J Neurosci 20: 5461-5467. [DOI] [PMC free article] [PubMed] [Google Scholar]
- Wehr M, Laurent G (1996) Odour encoding by temporal sequences of firing in oscillating neural assemblies. Nature 384: 162-166. [DOI] [PubMed] [Google Scholar]


