

Abstract
The hydrophobic cavity of the C-terminal domain (CTD) of HIV-1 capsid has been recently validated as potential target for antiviral drugs by peptide-based inhibitors; however, there is no report yet of any small molecule compounds that target this hydrophobic cavity. In order to fill this gap and discover new classes of ant-HIV-1 inhibitors, we undertook a docking-based virtual screening and subsequent analog search, and medicinal chemistry approaches to identify small molecule inhibitors against this target. This article reports for the first time, to the best of our knowledge, identification of diverse classes of inhibitors that efficiently inhibited the formation of mature-like viral particles verified under electron microscope (EM) and showed potential as anti-HIV-1 agents in a viral infectivity assay against a wide range of laboratory-adapted as well as primary isolates in MT-2 cells and PBMC. In addition, the virions produced after the HIV-1 infected cells were treated with two of the most active compounds showed drastically reduced infectivity confirming the potential of these compounds as anti-HIV-1 agents. We have derived a comprehensive SAR from the antiviral data. The SAR analyses will be useful in further optimizing the leads to potential anti-HIV-1 agents.
Keywords: Human immunodeficiency virus type-1 (HIV-1); N-terminal domain (NTD); C-terminal domain (CTD); Capsid (CA); Peripheral Blood Mononuclear Cell (PBMC); [(sodium 3′-(1-(phenylamino)-carbonyl)-3,4-tetrazolium-bis(4-methoxy-6-nitro) bezenesulfonic acid hydrate)] (XTT); Structure-activity relationship (SAR)
1. Introduction
The HIV-1 genome is composed of three major genes, gag, pol and env. The gag gene encodes the Gag protein, the critical structural protein of HIV-1, whereas pol encodes the viral enzymes reverse transcriptase (RT), protease (PR) and integrase (IN), essential for the HIV-1 replication. During HIV-1 assembly and morphogenesis, the structural protein, Gag, organizes into two completely different arrangements, immature and mature forms. In the immature form, Gag remains intact, whereas in the mature form Gag is cleaved by the viral protease. The formation of this mature particle is essential for HIV-1 infectivity and the capsid protein obtained from the Gag cleavage product plays a central role in forming the conical core of the virus that surrounds the viral genome. The capsid protein (CA, p24) is a hydrophobic protein consisting of two domains, the N-terminal domain (NTD, aa 1–145) and the C-terminal domain (CTD, aa 146–231). These two domains are connected with a 5-amino acid linker. Although the exact nature of the CA-CA contacts and their interactions in immature particles are not fully known, in mature particles the CA lattice has been modeled based on structural studies and image reconstructions by cryo-electron microscopy of mature virions and assembled VLPs1–4. Recently, a pseudo-atomic model of the full-length HIV-1 capsid hexameric structure has been reported, which provided structural insights on the mechanism of action of some known assembly inhibitors5. HIV-1 capsid plays a crucial role in viral assembly, maturation and also early post-entry steps1–4,6. Mutations in both the NTD and CTD lead to defects in viral assembly and release7–18. In addition, capsid has been shown to be a dominant determinant of HIV-1 infectivity in non-dividing cells19. Taken together, it is evident that capsid plays an important role in HIV-1 assembly and maturation, and has been recognized as a potential target for developing a new generation of drugs for AIDS therapy20–22.
Several peptides and small molecules that disrupt HIV-1 assembly have been reported in the literature23–28. The first breakthrough in identifying small-molecule inhibitors (CAP-1 and CAP-2) targeted to the NTD of capsid was reported by Summers’s group26. These compounds affect virus stability and/or assembly. Only CAP-1 showed dose-dependent HIV-1 inhibition in viral infectivity assays, while CAP-2 was cytotoxic. Although the affinity of CAP-1 for the NTD was low (Kd ~800 μM) it serves as a lead compound for more potent inhibitors against this target. Recently, the structure of CAP-1 in complex with the NTD has been solved29. A small-molecule inhibitor, PA-457, which blocks HIV-1 maturation by inhibiting CA-SP1 cleavage, has been recently reported28,30–35. PA-457 has shown low nM antiviral potency in cell culture, providing credence to the hypothesis that highly potent inhibitors to Gag can be identified despite the fact that literally thousands of copies of Gag are present in a virion. This compound is currently in Phase 2b clinical trials (http://www.myriadpharma.com/product-pipeline/clinical/mpc-4326). Recently, a 12-mer peptide, CAI, was identified by phage-display technique and shown to inhibit HIV-1 assembly in vitro by targeting the CTD36. CAI was the first peptide reported to disrupt both immature- and mature-like particles in vitro. However, CAI could not inhibit HIV-1 in cell culture due to its lack of cell permeability and hence could not consider as a viable drug candidate.
Recently, we successfully applied the hydrocarbon stapling technique37 to convert CAI to a cell-penetrating peptide (NYAD-1), which binds to the CTD. The stapling technique involves the introduction of two α, α-disubstituted non-natural amino acids containing terminal olefinic side chains at positions i and (i+4) or (i+7) and cyclized using ruthenium catalyzed metathesis reaction to create the stapled peptides. NYAD-1 disrupts the formation of both immature- and mature-like virus particles in cell-free and cell-based in vitro assembly systems. In addition, NYAD-1 displays potent anti-HIV-1 activity in cell culture against a range of laboratory-adapted and primary HIV-1 isolates. It binds to a hydrophobic cavity identified previously in x-ray studies of CTD complexed with CAI38 with an improved affinity (Kd ~ 1 μM) compared to CAI (Kd ~ 15 μM)39. In this study, we have exploited the same hydrophobic cavity as a target to identify organic small molecule inhibitors using a docking-based virtual screening approach followed by synthetic medicinal chemistry. We have identified several small molecule inhibitors which may serve as effective leads against this target for further optimization.
2. Results
2.1.1. Virtual screening
The binding site of the first reported peptide, CAI, was mapped in an NMR chemical shift perturbation study to a highly conserved hydrophobic cavity formed by residues 169–191 of CTD of HIV-1 capsid36,38. This was also confirmed by a high-resolution x-ray structure analysis of the CAI structure in complex with the CTD38 (PDB code: 2buo), which revealed the molecular details of the interaction of this peptide in the hydrophobic cavity. Our recent NMR structure of the next generation peptide-based inhibitor, NYAD-1, also demonstrated that it bound to the same region of the CTD (aa 169–192)40. These studies have provided us with a wealth of structural information on the binding mode of these inhibitors in the hydrophobic cavity and surrounding area. We wanted to exploit the same hydrophobic cavity to indentify organic small molecules that might disrupt the formation and maturation of virus particles and inhibit virus infection. We have screened a subset of 100,000 drug-like molecules from the ZINC41 database using virtual screening based on high-throughput flexible docking technique, which is becoming an emerging technology for structure-based rational lead discovery. We have selected 200 top-scored compounds for visual analysis using 3D Stereoscopic glasses to identify compounds, which had the best possible interactions at the hydrophobic cavity of the CTD and selected 50 compounds for experiments. We have initially ordered 8 compounds from a vendor and tested their antiviral activity against HIV-1 IIIB. Two of the 8 compounds, (6 and 50) belonging to two diverse scaffolds showed antiviral potency and one compound (6) was potent and had a selectivity index (SI) of > 60 (SI = CC50/IC50; Table-3). Structures of selected few active compounds have been shown in Figure-1. A further search of analogs of these two hits from commercial sources resulted in additional compounds. Then we initiated medicinal chemistry on one of the active hits, 6 to derive a comprehensive SAR.
Table 3.
Antiviral activity of 6, 50 and 55 in laboratory-adapted and primary HIV-1 isolates
| HIV-1 virus | Subtype | Cell Type | Coreceptor | IC50 (μM ±SD) |
||
|---|---|---|---|---|---|---|
| 6 | 50 | 55 | ||||
|
Laboratory Strains | ||||||
| IIIB | B | MT-2 | X4 | 1.06 ± 0.05 | 6.69±0.3 | 1.78±0.17 |
| MN | B | MT-2 | X4 | 2.88±0.3 | 7.09±0.72 | 6.01 ±0.32 |
| SF2 | B | MT-2 | R5X4 | 2.43±0.37 | 5.72±1.74 | 3.59±0.25 |
| RF | B | MT-2 | X4 | 1.64±0.05 | 3.37±0.18 | 4.01±0.24 |
| BaL | B | PBMC | R5 | 4.22±0.78 | 4.9±0.57 | 3.22±0.7 |
| 89.6 | B | PBMC | R5X4 | 6.17±0.5 | 6.6±0.6 | 5±1.2 |
|
RT-Resistant Isolate | ||||||
| AZT-R | B | MT-2 | X4 | 5.77±0.55 | 3.97±0.67 | 3.15±0.1 |
|
Protease-Resistant Isolate | ||||||
| HIV-1 RF/L-323-12-3 | B | MT-2 | X4 | 1.18±0.03 | 9.05±1.13 | 5.7±0.6 |
|
Primary isolates | ||||||
| 94UG103 | A | PBMC | R5X4 | 3.93±0.25 | 3.6±0.93 | 1.24±0.08 |
| 92UG037 | A | PBMC | R5 | - | 1.12±0.2 | 0.73±0.13 |
| 92US657 | B | PBMC | R5 | 5.46 ± 0.4 | 2.7 ± 0.22 | 4.57 ± 1.55 |
| 93IN101 | C | PBMC | R5 | 2.7 ± 0.48 | 3.36 ± 0.21 | 2.87 ± 0.14 |
| 92UG024 | D | PBMC | X4 | 2.57±0.45 | 4.9±1.01 | 3±0.2 |
| 93BR020 | F | PBMC | R5X4 | 4.18±1.93 | 1.93±0.12 | 5±0.48 |
| RU570 | G | PBMC | R5 | 2.84±0.28 | 3.9±0.2 | 2.74±0.42 |
| BCF02 | Group (0) | PBMC | R5 | 6.07±0.21 | 10.95±2.51 | 8.95±0.9 |
| Small Molecules | CC50 (μM) in MT-2 | CC50 (μM) in PBMC | ||||
| 6 | >61.45 | >61.45 | ||||
| 50 | >128.08 | >64 | ||||
| 55 | >37.6 | >37.6 | ||||
Figure 1.

Chemical structures of selected inhibitors identified by docking-based virtual screening and similarity search techniques.
Compounds 6 and 50 both disrupt the formation of mature-like particles
We have characterized these compounds for their inhibitory effect on viral assembly and maturation. Spherical immature-like particles were formed by using full length gag proteins. The effect of inhibitors on immature- and mature-like particle assembly was studied by performing assembly reactions in the presence of varied doses of 6 and 50. These compounds failed to disrupt immature-like particle formation even at molar equivalent dose (data not shown). Tube-shaped mature-like particles were obtained from purified CA as reported.3,42 The rationale behind using CA instead of CANC to form the mature-like particles was to confirm that 6 and 50 targets CA only 39. In vitro data indicate that 6 and 50 disrupt the formation of mature-like particles (Figure-2) in a dose-dependent manner as observed with the hydrocarbon-stapled peptide, NYAD-139, which was used as positive control. After incubation with 0.5-fold molar equivalents of 6, the integrity of tube-like particles was greatly damaged. After incubation with one or five molar equivalent of 6, the assembly of tube-shaped particles was completely blocked. In case of 50, three molar equivalents completely disrupted the formation of tube-shaped particles.
Figure 2.

Inhibition of in vitro assembly by 6 and 50. Negatively stained EM images of mature-like particles resulting from in vitro assembly of CA proteins in the presence of no inhibitors (Control), 0.5-, 1.0-, molar equivalent of NYAD-1 (positive control), 6 and 50. Two higher doses were used in case of NYAD-1 (5.0-molar equivalent) and for 50 (3.0-molar equivalent) to reach complete inhibition.
2.1.2. Antiviral activity and cytotoxicity of small molecule compounds in cell-based assays
Since both 6 and 50 showed inhibition of mature-like particle assembly in cell-free assay we decided to test all similar compounds identified from database against a laboratory-adapted strain HIV-1 IIIB in MT-2 cells. The inhibition of p24 production by these molecules was measured over a range of concentrations to determine the IC50 values (concentration of inhibitor required to produce 50% reduction in p24 production). The results in Table-1 showed that the analogs of 6 showed very good activity ranging from 1.06 – 12.4 μM. Similarly, Table-2 indicated the activity ranges of the 50 type analogs tested. Although most of the compounds showed low to moderate activity two compounds (50 and 55) showed very good activity profile.
Table 1.
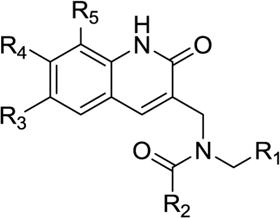
Antiviral activity of 1 and its analogs against HIV-1 IIIB in MT-2 cells.
 | |||||||
|---|---|---|---|---|---|---|---|
| No. | R1 | R2 | R3 | R4 | R5 | μM (± SD) | |
| IC50 | CC50 | ||||||
| 1 |  |
 |
H | H | CH3 | 4.02 ± 0.28 | >67.13 |
| 2 |  |
 |
H | H | CH3 | 4.23 ± 0.39 | >64.7 |
| 3 |  |
 |
H | H | CH3 | 7.25 ± 0.54 | >64 |
| 4 |  |
 |
H | H | CH3 | >16.5 | >66.1 |
| 5 |  |
 |
H | H | CH3 | 2.67 ± 0.5 | 9.2 ±1.0 |
| 6 |  |
 |
CH3 | H | H | 1.06 ± 0.05 | >61.45 |
| 7 |  |
 |
CH3 | H | H | >16.7 | ND |
| 8 |  |
 |
CH3 | H | H | 2.16 ± 0.07 | >55.4 |
| 9 |  |
 |
CH3 | H | H | 9.28 ± 0.68 | >67.1 |
| 10 |  |
CF3 | CH3 | H | H | >27.5 | ND |
| 11 |  |
 |
CH3 | H | H | >24.5 | ND |
| 12 |  |
 |
CH3 | H | H | >25.6 | ND |
| 13 |  |
 |
CH3 | H | H | 9.2 ± 0.7 | 70.7 ± 5.4 |
| 14 |  |
 |
CH3 | H | H | >23.6 | ND |
| 15 |  |
 |
CH3 | H | H | 7.1 ± 0.4 | >20.4 |
| 16 |  |
 |
CH3 | H | H | >25.2 | ND |
| 17 |  |
 |
CH3 | H | H | 8.2 ± 1.2 | >23.5 |
| 18 |  |
 |
CH3 | H | H | >21.9 | ND |
| 19 |  |
 |
CH3 | H | H | >24.8 | ND |
| 20 |  |
 |
CH3 | H | H | >24.1 | ND |
| 21 |  |
 |
CH3 | H | H | >23.6 | ND |
| 22 |  |
 |
CH3 | H | H | >26.6 | ND |
| 23 |  |
 |
CH3 | H | H | 4.7 ± 0.6 | >24.5 |
| 24 |  |
 |
CH3 | H | H | >22.1 | ND |
| 25 |  |
 |
CH3 | H | H | >38.9 | ND |
| 26 |  |
 |
CH3 | H | H | 9.27 ± 0.3 | 44.5 ± 5.5 |
| 27 |  |
 |
C2H5 | H | H | >13.9 | ND |
| 28 |  |
 |
C2H5 | H | H | 12.3 ± 0.85 | >127.4 |
| 29 |  |
 |
OCH3 | H | H | >13 | ND |
| 30 |  |
 |
OCH3 | H | H | 7.87 ± 1.0 | >31 |
| 31 |  |
 |
OCH3 | H | H | >25.7 | ND |
| 32 |  |
 |
CH3 | H | H | 11.7 ± 1.2 | >63.4 |
| 33 |  |
 |
CH3 | H | H | 11.8 ± 0.4 | >64 |
| 34 |  |
 |
CH3 | H | H | >12.9 | ND |
| 35 |  |
 |
CH3 | H | H | 5.0 ± 0.2 | 12.7 ± 1.0 |
| 36 |  |
 |
CH3 | H | CH3 | 8.6 ± 1.1 | >96 |
| 37 |  |
 |
OCH3 | H | H | 7.9 ± 0.4 | 25 ± 1.0 |
| 38 |  |
 |
OCH3 | H | H | 6.1 ± 0.7 | >48 |
| 39 |  |
 |
H | CH3 | H | >14.6 | ND |
| 40 |  |
 |
H | CH3 | H | >15 | ND |
| 41 |  |
 |
H | CH3 | H | >16.8 | ND |
| 42 |  |
 |
H | CH3 | H | 12.4 ± 0.6 | >51.2 |
| 43 |  |
 |
H | CH3 | H | >16.2 | ND |
| 44 |  |
 |
H | H | CH3 | 3.59 ± 0.36 | >60 |
| 45 |  |
 |
CH3 | H | H | 3.09 ± 0.55 | >67.13 |
| 46 |  |
 |
CH3 | H | H | 6.51 ± 0.94 | >65 |
| 47 |  |
 |
CH3 | H | H | 6.4 ± 0.17 | >19.8 |
| 48 |  |
 |
CH3 | H | H | 5.8 ±0.36 | >117 |
ND, Not determined
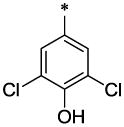
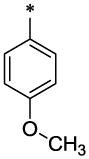
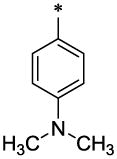
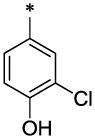
Table 2.
Antiviral activity of compound 49 and its analogs against HIV-1 IIIB in MT-2 cells.
 | |||
|---|---|---|---|
| New No. | R | μM (± SD) | |
| IC50 | CC50 | ||
| 49 |  |
33.5§ | >134.41 |
| 50 |  |
6.69 ± 0.3 | >128.08 |
| 51 |  |
6.8 ± 0.25 | <7.6 |
| 52 |  |
33.23§ | 42.10§ |
| 53 |  |
30.0§ | >34.15† |
| 54 |  |
6.9 ± 0.7 | 24.04§ |
| 55 |  |
1.78± 0.17 | >37.50† |
| 56 |  |
>30.6† | >30.60§ |
| 57 |  |
>32† | >63.7§ |
| 58 |  |
>16.5† | >66.1§ |
50% antiviral activity or toxicity at this dose
0–30% antiviral activity or toxicity at this dose
The encouraging data in the primary antiviral screening along with inhibition of mature-like particles by 6 and 50 motivated us to select these compounds to assess their antiviral activities in a wide variety of laboratory-adapted belonging to subtype B but different co-receptor use (X4, R5 and R5X4). The activities were assessed in primary cell lines (MT-2 and PBMC). All three compounds showed excellent activity profiles (IC50 ~ 1.06 – 7.09 μM; Table-3). In addition, we also tested these compounds against one RT-resistant and one protease-resistant strain. Remarkably, they all showed very similar activities as laboratory strains indicating their possible potential for further optimization as potential anti-HIV-1 agents with broad-spectrum activity.
We also tested these three molecules against a panel of primary isolates in PBMC representing diverse subtypes from A to O and diverse coreceptor use. The compounds showed excellent activity in all the primary isolates tested (0.73 – 5.46 μM) except group O (6.07 – 10.95 μM). 50 and 55 showed potent activity against one primary isolate (92UG037 under subtype A). All three compounds showed broad-spectrum activity (Table-3), which is very encouraging. This provides additional confidence that some of these lead molecules will be amenable for further modification to increase potency and selectivity.
The cytotoxicity of these compounds was assessed by the XTT method in either MT-2 cells or in both MT-2 cells and PBMC. Cytotoxicity assays were performed in parallel with the HIV-1 inhibition assays. The CC50 (concentration of inhibitor required to produce 50% cytotoxicity) values for MT-2 and PBMC were presented in Table-1–3.
2.1.3. Virions released from HIV-1 infected cells after treatment with the inhibitors are less infectious
Antiviral assays have shown a decrease in HIV-1 viral particle release by small molecules represented by reduction in p24 production (Table-1–3). In addition, 6 and 50 effectively inhibited mature-like particles and prevented assembly in vitro (Figure-3). Therefore, we reason that the effect of these molecules on newly generated virions is much greater than can be envisioned by the antiviral data. In other words, we believe that these molecules may possibly interfere with viral uncoating and viral assembly/maturation inducing irreparable damage to the viral particles newly produced and released in the supernatant, therefore, making them less infectious. To support our hypothesis we evaluated not only the quantity but also the quality of the virus progenies released in the supernatant using two of the most active compounds, 6 and 55. We first quantified the p24/viral particles released in the supernatant following AMD3100 (positive control), 6 and/or 55 treatment then we treated cells with the identical amount of p24-normalized supernatants. However, it is pertinent to note that at higher doses of AMD3100, 6 and 55 we could detect very little to no p24 in the supernatants. Therefore, we used the maximum quantities of supernatants possible to infect MT-2 cells for measuring the infectivity of the virus progenies released in the supernatant. As expected, we detected no viral infectivity for samples treated with AMD3100 and with 5 μM of 6 and 4 μM of 55 (Figure-3). We calculated the TCID50 considering only those doses which showed measurable infectivity. Infectivity efficiency of virus progenies was expressed as percentage of infectivity with respect to the untreated control. We detected about 60% of infectivity in the virus produced by the cells treated with 2.5 μM of 6 and 2 μM of 55. Taken together these results suggest that 6 and 55-treated virus-producing cells yield less infectious viruses; therefore, these molecules interfere with viral assembly and/or maturation.
Figure 3.

The percentage of infectivity of the virions in the supernatant. p24 normalized viruses produced by HIV-1 IIIB infected MT-2 cells treated with different doses of 6 and 55 or AMD3100 (1 μg/mL) were tittered on MT-2 cells to calculate TCID50.
2.1.4. Structure Activity Relationship (SAR) analysis
Molecular docking-based virtual screening identified two compounds (6,Table-1) and (50, Table-2) with diverse chemical structures, which showed consistent antiviral activity against a broad-range of laboratory-adapted and primary isolates. We further searched several commercial databases and identified similar analogs, synthesized a series of analogs of 6 and tested them against HIV-1 IIIB. The inhibitory data indicated a trend in SAR, as described below, which may be used as a guiding tool to optimize these two classes of inhibitors.
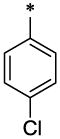
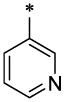
The SAR analyses of 6 and its analogs (Table-1) reveal that R1 and R2 positions require hydrophobic moieties (6, 8 and 45–47). Thiophene (32–38) containing compounds, although an isostere of furan, showed somewhat reduced activity profile. It appears that R1 position can also accommodate groups like phenyl (44 and 45), however, hydrophilic moieties such as pyridine (7), piperazine (11) and pyrazole (22) in R2 position showed detrimental effect on antiviral activity. The R2 position showed trend towards more elongated, bulkier hydrophobic group, such as phenyl (1, 2, 5, 6, 8, 23, 35, 44, and 45); however, the activity was dictated in parallel by the substitutions in the phenyl ring as well as in the quinolinone ring. In terms of phenyl ring substitutents, 4-Cl, 4-Br and 4-CH3 showed better activity; however, phenyl group with a bulkier group attached to it such as 4-iPr, 4-OCH3 (39 & 40) showed reduced activity. Surprisingly, two compound with furan at R1 and a 3-piperidinyl-4-chloro-phenyl group at R2 and a 4-Cl phenyl at R1 and a bulkier group imidazo[1,2-a]pyridine showed reasonable activity; however, these compounds also showed enhanced toxicity. The quinolinone ring seems very critical for antiviral activity as evidenced in the docked pose (Figure-4) where –NH-moiety of quinolinone ring forms a hydrogen bond with Asn183 located at the hydrophobic cavity of CTD. Similarly, the methyl group at position R3 is also important, which is positioned near a narrow hydrophobic pocket. The SAR analysis also confirms that a bulkier group such as OCH3 (29–31, 37 and 38) and C2H5 (27 and 28) showed much reduced activity. It appears that with furyl substituent at R1 and phenyl (and its analogs) at R2, CH3 at position R5 showed equally potent activity (1–3, 5, 36, 44).
Figure 4.
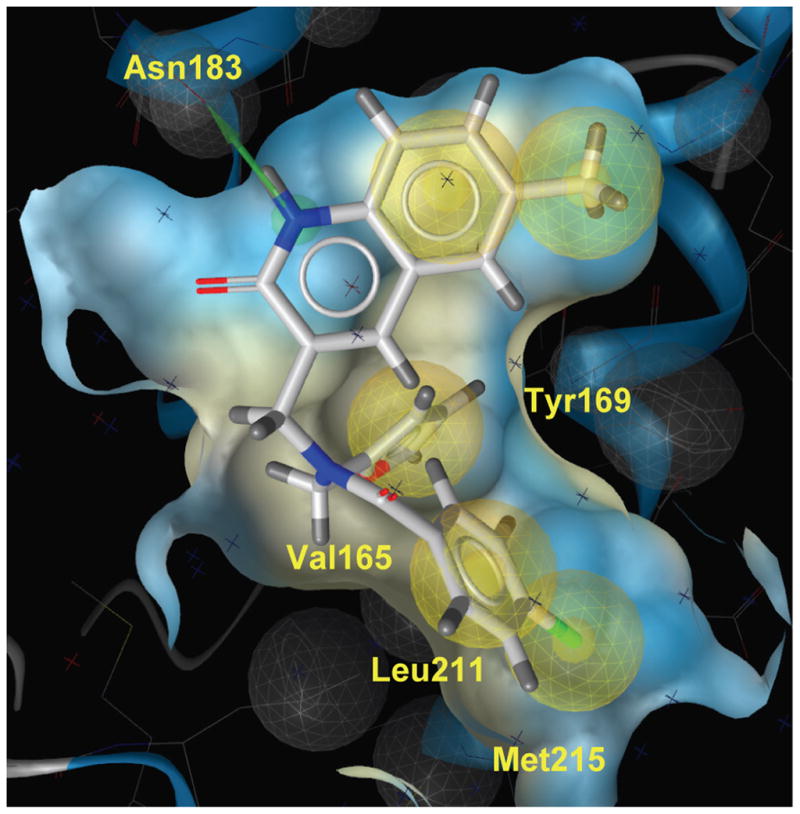
GLIDE docking pose of 6 the hydrophobic cavity of the CTD of HIV-1 capsid. The quinolinone NH forms a H-bond with Asn183 indicated in green line. The phenyl and furan group are located in the hydrophobic grove formed by residues Val165, Tyr169, Leu211 and Met215.
The SAR analyses of compounds in Table-2 revealed that a relatively hydrophobic bulkier group is necessary for activity (50, 51, 54, and 55). However, relatively weak activity of 49 and 52 could not be explained based on this analysis. Compound 55, which shows excellent antiviral potency, has the most bulker R group and the end portion is very hydrophobic. It is interesting to note that in the Glide-based docking simulation, the biphenyl moieties of the best pose of 55 make substantial hydrophobic contact with the hydrophobic residues in the cavity (Val165, Thr186 and Leu211) and also make a π-π interaction with the amino acid residue Y169 (Figure-5). These interactions are missing in other relatively weak active molecules.
Figure 5.

GLIDE docking pose of 55 in the hydrophobic cavity of the CTD of HIV-1 capsid. Two phenyl groups of this molecule are positioned in a hydrophobic group formed by residues Val165, Thr186, Leu211 and Tyr 169. The phenyl moiety of Tyr169 forms π-π interaction with one of the phenyl ring of this molecule (shown in red arrow).
3. Discussion and Conclusions
The HIV-1 capsid has been identified as a potential target for discovering new inhibitors to fight against AIDS28,34,36,38,43. Several groups reported identification of small molecule inhibitors against capsid28,34,34,43,44. However, the target of the most active compound, PA-457 (now termed as MPC-4326), which is now in Phase 2b clinical trials (http://www.myriadpharma.com/product-pipeline/clinical/mpc-4326), is the CA-SP1 cleavage site. Summers’ group used a computational based docking technique (DOCK 4.0) to screen public domain libraries using a “β-hairpin cleft” on the surface of the N-terminal domain of the HIV-1 capsid and identified two compounds, CAP-1 and CAP-2. CAP-1 showed virtually no inhibition of virus production; however, the particles produced after treatment was poorly infectious and CAP-2 was toxic 26,29. Since then there was no report of identification of any small molecule inhibitors against HIV capsid, especially targeted to the CTD of capsid.
In order to fill this gap and to identify new classes of anti-HIV-1 agents, we have used a similar docking-based virtual screening technique used by Summer’s group; however, instead of NTD of HIV-1 capsid, we selected the hydrophobic cavity within the CTD of HIV-1 capsid, which had been shown to be large enough to accommodate a 12 residue peptide (CAI) and it’s subsequent modified stapled peptide, NYAD-136,38–40. The screening method identified several compounds belonging to two diverse structural classes (6 and 50) and inhibited HIV-1 IIIB in low μM potency in an antiviral assay. A subsequent similarity based search on different databases further identified a large number of compounds representing those two diverse structures, many of which also showed low μM potency in an antiviral assay. These compounds showed much better antiviral activity (IC50 ~1.06 – 2.16 μM) than CAP-1 or CAP-2. We have tested 6, 50 and 55 against a wide variety of primary isolates representing different subtypes and coreceptor use and they showed remarkable activity.
Despite their potential HIV-1 inhibitory activity, we wanted to confirm that these compounds target capsid and inhibit mature-like particles. Indeed 6 and 50 have been shown to be effective in preventing mature like particles as was previously shown by a stapled peptide, NYAD-1, which was shown to bind to the hydrophobic cavity of the CTD by NMR. This data give confidence that these inhibitors have broad anti-HIV-1 activity with promising selectivity index and can be used for further optimization.
A comprehensive SAR analysis of the 6 and 50 type analogs provided useful information for further optimizing this set of molecules. The docking-based analysis of the poses of these two compounds also provided additional information on the critical interaction necessary for the binding of these compounds to the hydrophobic cavity of the CTD of capsid. Future systematic synthesis effort will be geared to get a better understanding on that series.
The data presented in this report provides confidence that the hydrophobic cavity of the CTD of HIV-1 capsid is a potential target to identify antiviral agents and these preliminary data and the SAR study will be the basis of further optimization of these series of inhibitors..
4. Materials and methods
4.1. Molecular Modeling & virtual screening
All molecular modeling and virtual screening studies were performed on a HP xw9300 workstation running Red Hat Enterprise Linux 4.0 and equipped with AMD Opteron dual processors and NVIDIA Quatro FX3400 video card.
4.1.1. Selection of chemical databases
We selected ZINC database41 for the docking-based virtual screening study. This database contains ~4.6 million pre-filtered compounds in a ready-to-dock stage in 3D format, which can be downloaded free of cost from Brian Shoichet’s lab at the University of California at San Francisco (UCSF). The database contains a diverse set of compounds (diversity was assessed based on Tanimoto similarity coefficients) from a large number of vendors as well as compounds from PubChem collections, a component of NIH’s Molecular Library Roadmap Initiative. The database was created by filtering out molecules with formula weight > 700, calculated LogP > 6 and < – 4, the number of hydrogen-bond donors > 6, the number of hydrogen bond acceptors > 11, and the number of rotatable bonds > 15. The database contains only molecules having H, C, N, O, F, S, P, Cl, Br, or I atoms. However, exceptions were made by including a number of actual drugs that violate these constraints. The constraints set in the filter are based on the current opinion in the field and is a little more lenient than prescribed by the Lipinski’s ‘rule of five’45,46. We have used a subset of about 100,000 drug-like molecules in our study.
4.1.2. Docking of ligands onto the hydrophobic cavity of the capsid CTD
We used the automated docking software GLIDE 8.0 (Schrödinger, Portland, OR) that applies a two-stage scoring process to sort out the best conformations and orientations of the ligand (defined as pose) based on its interaction pattern with the receptor. GLIDE has been used successfully in drug design47–53. The starting point of the docking simulation was the x-ray structure of the CTD of HIV-1 capsid bound with a linear peptide CAI (PDB code: 2buo) available from protein data bank (PDB) at the Research Collaboratory for Structural Bioinformatics (RCSB) which has been extensively used in our research program. We decided to use this specific structure since this is the only ligand (CAI)-bound x-ray structure available for the CTD and provides information on the flexibility of the binding site for ligand binding. The peptide CAI was removed from the protein for docking study. Three-dimensional coordinates of the ligands, their isomeric, ionization and tautomeric states were generated using the LigPrep (including Ionizer) module within the Schrödinger Suite 2008 programs. The protein was prepared using the “protein preparation tool” and the structures were minimized with Macromodel software from Schrödinger. A grid file encompassing the area in the cavity that contains information on the properties of the associated receptor was created. Conformational flexibility of the ligands was handled via an exhaustive conformational search. Initially, we used Schrödinger’s proprietary GlideScore scoring function in standard precision (SP) mode. We selected 2000 top-scored compounds to dock again in extra precision (XP) mode to score the optimized poses. For each ligand fifty different poses were evaluated and 200 top-scored ligands were examined carefully using molecular visualization techniques with 3D CrystalEyes2 stereo eyewear from SteroGraphics Corporation (San Rafael, CA). The poses were selected based on hydrophobic, hydrogen bond and charge-charge interactions. Special attention was also paid to identify poses that may indicate alternative binding modes of the molecules in the hydrophobic cavity. Interaction sites of the active ligands with the CTD from dock poses were mapped using LiganScout 2.0 (Inte:Ligand, Austria).
4.2. Chemistry
All reagents were purchased from commercial suppliers and were used without further purification. Target compounds 1–11, 27–58 were purchased from commercial sources (Asinex Corp., USA and Chembridge Corp., USA). Compounds 12–26 were synthesized according to the methods described below. The melting points were measured on a Sanyo Gallenkamp melting point apparatus (Sanyo Gallenkamp, UK). The LC/MS analyses for the compounds were done at Surveyor MSQ (Thermo Finnigan, USA) with APCI ionization. The 1H NMR spectra were recorded on MERCURY plus 400 MHz spectrometer (Varian, Germany). Chemical shift values are given in ppm relative to tetramethylsilane (TMS), with the residual solvent proton resonance as internal standard. High-resolution mass spectra (HRMS) were recorded on a Bruker APEX II ICR-FTMS.
After we have performed a retro synthetic analysis of 6 the focus was on the synthetic Scheme 1 which was validated and allowed us to further explore the chemical space of these quinolin-2-one derivatives. We synthesized S2–S4 by minor modification of the published methods54,55 as described below. The secondary amines, S5–S7, were synthesized by a reductive amination of the aldehydes S456. Then these three secondary amines were subjected to a TBTU coupling reaction with appropriate acids leading to the desired products, 12–26, with yields ranging from 12 to 78%.
Scheme 1.

(a) Ac2O, TEA, MeCN; (b) POCl3, DMF; (c) HCl, AcOH; (d) R1-CH2-NH2, isopropanol then NaBH4; (e). R2COOH, TBTU, DCM
4.2.1. N-acetyl-p-toluidine (S2)54,55
TEA (24.8 g, 0.25 mol) was added at once to a solution of 25.0 g (0.23 mol) p-toluidine in 50 mL of MeCN, followed by a dropwise addition of acetic anhydride (25.2 g, 0.25 mol). The reaction mixture was stirred for 3h at 50°C (TLC control). The mixture was cooled to 0°C and the resulting precipitate was filtered, washed with water (2×25 mL) and dried on the air to afford N-acetyl-p-toluidine (S2) (25.7g, 73.4%). m/z (APCI+) 150 (M+H+). mp 145–146°C
4.2.2. 2-Chloro-6-methylquinoline-3-carbaldehyde (S3)54,55
POCl3 (111 mL, 1,19 mol) was added drop wise to DMF (40 mL, 0.51 mol) at 0°C, followed by a portion wise addition of N-acetyl-p-toluidine (S2) (25.7 g, 0.17 mol). The resulting mixture was stirred for 30 min at r.t. and the reaction mixture heated at 85°C for 6h. The resulting solution was cooled to r.t. and slowly poured into ice-water. The resulting precipitate was filtered, washed with water, dried and crystallized from ethyl acetate to give aldehyde (S3) (23.6 g, 66.7%). 1H-NMR (400MHz, DMSO-d6 ppm): 2.48 (s, 3H), 7.79 (d, 1H), 7.91 (d, 1H), 8.01 (s, 1H), 8.81 (s, 1H), 10.35 (s, 1H). m/z (APCI+) 206 (M+H+). mp 124–125°C
4.2.3. 6-Methyl-2-oxo-1,2-dihydro-quinoline-3-carbaldehyde (S4)56
A solution of 2-chloro-6-methyl-quinoline-3-carbaldehyde (S3) (23.6 g, 0.11 mol) in a mixture of AcOH:water (90 mL:10 mL) was heated at 85–90°C with stirring. After 2h a precipitation has started the reaction mixture was additionally heated for 4h at 85–90°C. The resulting mixure was cooled to 0°C leading to an intensive precipitate formation. The resulting precipitate was filtered, washed with water, 5% NaHCO3 and again with water, dried on the air to afford the title compound (S4) (14.3 g, 68.9%); mp 201–202°C. 1H-NMR (400MHz, DMSO-d6 ppm): 2.35 (s, 3H), 7.25 (d, 1H), 7.49 (d, 1H), 7.71 (s, 1H), 8.39 (s, 1H), 10.21 (s, 1H), 12.05 (br, 1H). m/z (APCI+) 188 (M+H+).
4.2.4. General procedure to synthesize intermediate compounds (S5–S7)
The suitable amine (3.00 mmol) was added to a solution of 6-methyl-2-oxo-1,2-dihydro-quinoline-3-carbaldehyde (S4) (400 mg, 2.13 mmol) in 20 mL of isopropanol. The reaction mixture was refluxed for 7h, cooled to 0°C and the resulting precipitate was filtered and washed with hexane (2×15 mL) to afford the crude Shiff base. The product was suspended in 15 mL of isopropanol. NaBH4 (100 mg, 2 mmol) was added to the resulting suspension and the mixture stirred for 4h at r.t. (TLC control). The reaction mixture was evaporated in vacuo and 20 mL of water was added to residue. The mixture was stirred for 1h, the precipitate was filtered, washed with water (1×10mL) and dried on the air to give the desired target secondary amines.
4.2.4.1. 3-{[(Furan-2-ylmethyl)-amino]-methyl}-6-methyl-1H-quinolin-2-one (S5)
S5 (119 mg, 72%, mp 129–130°C) was synthesized according the general method described above. 1H-NMR (400MHz, DMSO-d6 ppm): 2.31 (s, 3H), 3.61 (s, 2H), 3.71 (s, 2H), 6.21 (s, 1H), 6.32 (s, 1H), 7.15 (d, 1H), 7.25 (s, 1H), 7.41 (s, 1H), 7.52 (s, 1H), 7.71 (s, 1H); m/z (APCI+) 269 (M+H+).
4.2.4.2. 6-Methyl-3-{[(tetrahydro-furan-2-ylmethyl)-amino]-methyl}-1H-quinolin-2-one (S6)
S6 (290 mg, 50%, mp 110–111°C) was synthesized according the general procedure described above starting from tetrahdrofuran-2-yl-methylamine (315 mg, 3.11 mmol). 1H-NMR (400MHz, DMSO-d6 ppm): 1.50 (m, 1H), 1.86 (m, 3H), 2.35(s, 3H), 2.55(d, 2H), 3.58 (m, 3H), 3.70 (q, 1H), 3.89 (q, 1H), 7.18 (d, 1H), 7.26 (d, 1H), 7.41 (s, 1H), 7.72 (s, 1H), 11.60 (br, 1H); m/z (APCI+) 273 (M+H+).
4.2.4.3. 3-[(4-Chloro-benzylamino)-methyl]-6-methyl-1H-quinolin-2-one (S7)
S7 (375 mg, 40%, mp 118–119°C) was synthesized following the general procedure described above using 4-chlorobenzylamine (425 mg, 3.0 mmol). 1H-NMR (400MHz, DMSO-d6 ppm): 2.31 (s, 3H), 3.58 (s, 2H), 3.69 (s, 2H), 7.20 (d, 1H), 7.28 (d, 1H), 7.38 (d, 4H), 7.42 (s, 1H), 7.79 (s, 1H), 11.70 (br, 1H). m/z (APCI+) 313 (M+H+).
4.3. General procedure to synthesize target compounds (12–26)
The suitable acid (0.5 mmol) was dissolved in DCM (8 mL) and TBTU (193mg, 0.6 mmol) followed by the addition of TEA (71mg, 0.7 mmol). The resulting solution was allowed to stir for 30 min at r.t. and the suitable secondary amine (S5–S7) (0.5 mmol) was added to the reaction mixture. The stirring was continued for 8h. The reaction mixture was washed with a solution of K2CO3 (25% in water, 2×10 mL), water (1×10 mL) and dried over Na2SO4. The solvent was distilled off in vacuo and the residue was crystallized from MeOH to afford the desired target compounds (12–26).
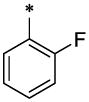
4.3.1. 4-Fluoro-N-furan-2-ylmethyl-N-(6-methyl-2-oxo-1,2-dihydro-quinolin-3-ylmethyl)-benzamide (12)
12 (119 mg, 72%; mp 129–130°C) was synthesized according to the general procedure described above, starting from the 4-Fluoro-benzoic acid and amine (S5). 1H-NMR (400MHz, DMSO-d6 ppm: 2.32 (s, 3H), 4.39 (br, 2H), 4.71 (br, 2H), 6.29 (br, 1H), 6.31 (br, 1H), 7.21 (d, 1H, J=8,5Hz), 7.31 (br, 1H,), 7.33 (m, 2H,), 7.48 (s, 1H), 7.52 (br, 2H), 7.61 (br, 2H), 11.7 (br, 1H). m/z (APCI+) 391 (M+H+). HRMS (ESI) m/z calc for C23H19FN2O3 (M+H+): 391.42; found 391.42.
4.3.2. 3,4-Dichloro-N-furan-2-ylmethyl-N-(6-methyl-2-oxo-1,2-dihydro-quinolin-3-ylmethyl)-benzamide (13)
13 (112 mg, 52%; mp 138–139°C) was synthesized according to the general procedure described above starting from the 3,4-Dichloro-benzoic acid and amine (S5). 1H-NMR (400MHz, DMSO-d6 ppm): 2.35 (s, 3H), 3.81 (br, 3H), 4.39–4.42 (two broadened signals, 2H, Z/E forms), 4.59–4.71 (two broadened signals, 2H, Z/E forms), 6.31 (br, 1H), 6.39 (br, 1H), 7.25 (d, 1H, J=8,5Hz), 7.31 (d, 1H, J=8,5Hz), 7.42 (superposition of two broad singlets, 2H), 7.55 (s, 1H), 7.61 (s, 1H), 7.75 (br, 2H), 11.6 (br, 1H). m/z (APCI+) 441, 443 (M+H+). HRMS (ESI) m/z calc for C23H18Cl2N2O3 (M+H+): 442.32; found 442.32.
4.3.3. 4-Chloro-N-furan-2-ylmethyl-3-hydroxy-N-(6-methyl-2-oxo-1,2-dihydro-quinolin-3-ylmethyl)-benzamide (14)
14 (277 mg, 22%; mp 160–161°C) was synthesized according to the general procedure described above starting from the 4-Chloro-3-hydroxy-benzoic acid and amine (S5). 1H-NMR (400MHz, DMSO-d6 ppm: 2.31 (s, 3H), 4.32 (br, 2H), 4.65 (br, 2H), 6.31 (br, 1H), 6.39 (br, 1H), 6.99 (br, 2H), 7.19 (d, 1H, J=8,5Hz), 7.31 (d, 1H, J=8,5Hz), 7.36 (s, 1H), 7.41 (s, 1H), 7.52 (superposition of two singlets, 2H), 10.3 (br, 1H), 11.7 (br, 1H). m/z (APCI+) 423, 425 (M+H+). HRMS (ESI) m/z calc for C23H18Cl2N2O3 (M+H+): 423.87; found 423.87.
4.3.4. 4-Chloro-N-furan-2-ylmethyl-N-(6-methyl-2-oxo-1,2-dihydro-quinolin-3-ylmethyl)-3-piperidin-1-yl-benzamide (15)
15 (102 mg, 48%; mp 150–151°C) was synthesized according to the general procedure described above starting from the 4-Chloro-3-piperidin-1-yl-benzoic acid and amine (S5). NMR 1H (400MHz, DMSO-d6 ppm: 1,5 (br, 6H), 2.32 (s, 3H), 2.72–2.91 (two broad peak 4H, Z/E forms), 4.22–4.41 (two broadened signals, 2H, Z/E forms), 4.61–4.75 (two broadened signals, 2H, Z/E forms), 6.31 (br, 1H), 6.39 (br, 1H), 7.15 (br, 2H), 7.21 (d, 1H, J=8,5Hz), 7.31 (d, 1H, J=8,5Hz), 7.41 (br, 1H), 7.49 (s, 1H), 7.61 (s, 1H), 7.62 (s, 1H), 11.7 (br, 1H). m/z (APCI+) 490, 492 (M+H+). HRMS (ESI) m/z calc for C28H28ClN3O3 (M+H+): 491.01; found 491.01.
4.3.5. 4-Cyano-N-furan-2-ylmethyl-N-(6-methyl-2-oxo-1,2-dihydro-quinolin-3-ylmethyl)-benzamide (16)
16 (127 mg, 63%; mp 220–221°C) was synthesized according to the general procedure described above starting from the 4-Cyano-benzoic acid and amine (S5). 1H-NMR (400MHz, DMSO-d6 ppm: 2.32 (s, 3H), 4.22–4.51 (two broadened signals, 2H, Z/E forms), 4.51–4.78 (two broadened signals, 2H, Z/E forms), 6.31 (br, 1H), 6.41 (br, 1H), 7.21 (br, 1H), 7.31 (d, 1H, J=8,5Hz), 7.51 (s, 1H), 7.59 (s, 1H), 7.62 (br, 2H), 7.72 (br, 1H), 7.81–8.05 (two broadened signals, 2H), 11.7 (br, 1H). m/z (APCI+) 398 (M+H+). HRMS (ESI) m/z calc for C24H19N3O3 (M+H+): 398.44; found 398.44.
4.3.6. 3-Chloro-4-fluoro-N-furan-2-ylmethyl-N-(6-methyl-2-oxo-1,2-dihydro-quinolin-3-ylmethyl)-benzamide (17)
17 (121 mg, 62%; mp 132–134°C) was synthesized according to the general procedure described above starting from the 3-Chloro-4-fluoro-benzoic acid and amine (S5). 1H-NMR (400MHz, DMSO-d6 ppm: 2.32 (s, 3H), 4.41 (br, 2H), 4.61 (br, 2H), 6.31 (br, 1H), 6.41 (br, 1H), 7.21 (d, 1H, J=8,5Hz), 7.35 (d, 1H, J=8,5Hz), 7.51 (br, 3H), 7.59 (s, 1H), 7.62 (s, 1H), 7.81 (br, 1H), 11.6 (br, 1H). m/z (APCI+) 425, 427 (M+H+). HRMS (ESI) m/z calc for C23H18ClFN2O3 (M+H+): 425.87; found 425.87.
4.3.7. 3,5-Dichloro-N-furan-2-ylmethyl-4-hydroxy-N-(6-methyl-2-oxo-1,2-dihydro-quinolin-3-ylmethyl)-benzamide (18)
18 (33 mg, 18%; mp 188–189°C) was synthesized according to the general procedure described above starting from the 3,5-Dichloro-4-hydroxy-benzoic acid and amine (S5). 1H-NMR (400MHz, DMSO-d6 ppm: 2.31 (s, 3H), 4.41 (br, 2H), 4.61 (br, 2H), 6.35 (br, 1H), 6.41 (br, 1H), 7.21 (d, 1H, J=8,5Hz), 7.32 (d, 1H, J=8,5Hz), 7.51 (br, 1H), 7.55 (br, 2H), 7.61 (s, 1H), 7.67 (s, 1H), 10.05 (br, 1H), 11.6 (br, 1H). m/z (APCI+) 457, 459 (M+H+). HRMS (ESI) m/z calc for C23H18Cl2N2O4 (M+H+): 458.32; found 458.32.
4.3.8. N-Furan-2-ylmethyl-6-methoxy-N-(6-methyl-2-oxo-1,2-dihydro-quinolin-3-ylmethyl)-nicotinamide (19)
19 (94mg, 52%; mp 173–175°C) was synthesized according to the general procedure described above starting from the 6-Methoxy-nicotinic acid and amine (S5). 1H-NMR (400MHz, DMSO-d6 ppm: 2.41 (s, 3H), 3.91 (br 3H), 4.41 (br, 2H), 4.68 (br, 2H), 6.31 (br, 1H), 6.39 (br, 1H), 6.89 (d, 1H, J=8,5Hz), 7.22 (d, 1H, J=8,5Hz), 7.31 (d, 1H, J=8,5Hz), 7.51 (s, 1H), 7.59 (s, 1H), 7.61 (s, 1H), 7.81 (br, 1H), 8.41 (br, 1H)11.7 (br, 1H). m/z (APCI+) 404 (M+H+). HRMS (ESI) m/z calc for C23H21N3O4 (M+H+): 404.45; found 404.45.
4.3.9. 4-Dimethylamino-N-furan-2-ylmethyl-N-(6-methyl-2-oxo-1,2-dihydro-quinolin-3-ylmethyl)-benzamide (20)
20 (96 mg, 53%; mp 147–148°C) was synthesized according to the general procedure described above starting from the 4-Dimethylamino-benzoic acid and amine (S5). 1H-NMR (400MHz, DMSO-d6 ppm: 2.31 (s, 3H), 2.92 (s, 6H), 4.38 (s, 2H), 4.68 (s, 2H), 6.32 (br, 1H), 6.38 (br, 1H), 6.71 (d, 2H, J=8,5Hz), 7.21 (d, 1H, J=8,5Hz), 7.29 (d, 1H, J=8,5Hz), 7.39 (br, 2H, J=8,5Hz), 7.41 (s, 1H), 7.61 (br, 2H), 7.62 (br, 1H), 11.5 (br, 1H). m/z (APCI+) 416 (M+H+). HRMS (ESI) m/z calc for C25H25N3O3 (M+H+): 416.50; found 416.50.
4.3.10. 3-Chloro-N-furan-2-ylmethyl-4-hydroxy-N-(6-methyl-2-oxo-1,2-dihydro-quinolin-3-ylmethyl)-benzamide (21)
21 (24 mg, 12%; mp 180–182°C) was synthesized according to the general procedure described above starting from the 3-Chloro-4-hydroxy-benzoic acid and amine (S5). 1H-NMR (400MHz, DMSO-d6 ppm: 2.35 (s, 3H), 4.35 (s, 2H), 4.62 (s, 2H), 6.31 (br, 1H), 6.41 (br, 1H), 6.99 (br d, 1H, J=8,5Hz), 7.22 (d, 1H, J=8,5Hz), 7.31 (d, 1H, J=8,5Hz), 7.35 (s, 1H), 7.51 (s, 1H), 7.53 (br, 1H), 7.58 (s, 1H), 7.61 (s, 1H), 10.5 (br, 1H), 11.6 (br, 1H). m/z (APCI+) 423, 424 (M+H+). HRMS (ESI) m/z calc for C23H19ClN2O4 (M+H+): 423.88; found 423.88.
4.3.11. 1-Methyl-1H-pyrazole-4-carboxylic acid furan-2-ylmethyl-(6-methyl-2-oxo-1,2-dihydro-quinolin-3-ylmethyl)-amide (22)
22 (26 mg, 12%; mp 230–231°C) was synthesized according to the general procedure described above starting from the 1-Methyl-1H-pyrazole-4-carboxylic acid and amine (S5). 1H-NMR (400MHz, DMSO-d6 ppm: 2.31 (s, 3H), 3.81 (br 3H), 4.41 (br, 2H), 4.75 (br, 2H), 6.31 (br, 1H), 6.35 (br, 1H), 7.19 (d, 1H, J=8,5Hz), 7.25 (d, 1H, J=8,5Hz), 7.41 (s, 1H), 7.46 (s, 1H), 7.52 (br, 1H), 7.62 (br, 1H), 8.05 (br, 1H), 11.7 (br, 1H). m/z (APCI+) 377 (M+H+). HRMS (ESI) m/z calc for C21H20N4O3 (M+H+): 377.43; found 377.43.
4.3.12. 3,4-Difluoro-N-furan-2-ylmethyl-N-(6-methyl-2-oxo-1,2-dihydro-quinolin-3-ylmethyl)-benzamide (23)
23 (99 mg, 54%; mp 142–114°C) was synthesized according to the general procedure described above starting from the 3,4-Difluoro-benzoic acid and amine (S5). 1H-NMR (400MHz, DMSO-d6 ppm: 2.31 (s, 3H), 4.41 (broad peak, 2H), 4.61 (broad peak, 2H), 6.27 (broad peak, 1H), 6.30 (broad peak, 1H), 7.19 (d, 1H, J=8,5Hz), 7.29 (d, 1H, J=8,5Hz), 7.39 (s, 1H), 7.48 (s, 1H), 7.52 (broad peak, 1H), 7.62 (broad peak, 2H), 11.6 (broad peak, 1H). m/z (APCI+) 409 (M+H+). HRMS (ESI) m/z calc for C23H18F2N2O3 (M+H+): 409.42; found 409.42.
4.3.13. N-Furan-2-ylmethyl-N-(6-methyl-2-oxo-1,2-dihydro-quinolin-3-ylmethyl)-4-sulfamoyl-benzamide (24)
24 (26 mg, 13%; mp 248–249°C) was synthesized according to the general procedure described above starting from the 4-Sulfamoyl-benzoic acid and amine (S5). 1H-NMR (400MHz, DMSO-d6 ppm: 2.35 (s, 3H), 4.29–4.38 (two broad peaks, 2H, Z/E forms), 4.41–4.71 (two broad peaks, 2H Z/E forms), 6.29 (br, 1H), 6.37 (br, 1H), 7.21 (d, 1H, J=8,5Hz), 7.29 (d, 1H, J=8,5Hz), 7.49 (s, 1H), 7.52 (s, 1H), 7.61 (br, 2H), 7.68 (br, 1H), 7.88 (br, 2H). m/z (APCI+) 452 (M+H+). HRMS (ESI) m/z calc for C23H21N3O5S (M+H+): 452.51; found 452.51.
4.3.14. 4-Chloro-N-(6-methyl-2-oxo-1,2-dihydro-quinolin-3-ylmethyl)-N-(tetrahydro-furan-2-lmethyl)-benzamide (25)
25 (51 mg, 25%; mp 223–225°C) was synthesized according to the general procedure described above starting from the 4-Chloro-benzoic acid and amine (S6). 1H-NMR (400MHz, DMSO-d6 ppm: 1.15–1.95 (two broad peaks, 4H), 2.35 (s, 3H), 3.35 (br, 1H), 3.70 (br, 2H), 4,09 (br, 2H) 4.55 (br, 2H) 7.21 (d, 1H), 7.29 (d, 1H), 7.35–7.54 (br 5H), 7.66 (br s, 1H), 11.65 (br, 1H). m/z (APCI+) 411, 413 (M+H+). HRMS (ESI) m/z calc for C23H23ClN2O3 (M+H+): 411.91; found 411.911.
4.3.15. 8-Methyl-imidazo[1,2-a]pyridine-2-carboxylic acid (4-chloro-benzyl)-(6-methyl-2-oxo-1,2-dihydro-quinolin-3-ylmethyl)-amide (26)
26 (47 mg, 20%; mp 250–251°C) was synthesized according to the general procedure described above starting from the 8-Methyl-imidazo[1,2-a]pyridine-2-carboxylic acid and amine (S7). 1H-NMR (400MHz, DMSO-d6 ppm: 2.35 (s, 6H), 4.30–4.80 (two broad peaks, 2H, Z/E forms), 5.10–5.60 (two broad peaks, 2H Z/E forms), 6.80 (br, 1H), 7.05 (br, 1H), 7.10–7.45 (br m, 7H,), 7.61 (br, 1H,), 8.35 (br, 2H), 11.62 (br, 1H). m/z (APCI+) 471, 473 (M+H+). HRMS (ESI) m/z calc for C27H23ClN4O2 (M+H+): 471.97; found 471.97.
4.4. Electron microscopy to study inhibition of in vitro assembly by small molecules
In vitro assembly systems were set up as previously reported39. Briefly, stock proteins were adjusted to the appropriate concentration (25 μM for Gag proteins and 50 μM for CA proteins) with the Na2HPO4 buffer at pH 8.0. After addition of 5% total E. coli RNA (RNA:protein =1:20 by weight), incubation with or without varied doses of NYAD-1 as positive control and 6 and 50 as test samples for 30 min at 4 °C, the samples were dialyzed overnight in Na2HPO4 buffer at pH 8.0 containing 100 mM of NaCl at 4 °C. For assembly of CA mature-like particles, addition of 5% total E. coli RNA was omitted. Negative staining was used to check the assembly. Carbon-coated copper grids (200 mesh size; EM Sciences) were treated with 20 μl of poly-L-lysine (1 mg/mL; Sigma) for 2 min. 20 μl of reaction solution was placed onto the grid for 2 min. Spotted grids were then stained with 30 μl of uranyl acetate solution for 2 min. Excess stain was removed, and grids were air-dried. Specimens were examined with a TECNAI G2 electron microscope at 80 Kv.
4.5. Measurement of antiviral activity
The inhibitory activity of small molecules on infection by laboratory-adapted HIV-1 strains was determined as previously described39. In brief, 1 × 10⁴ MT-2 cells were infected with HIV-1 at 100 TCID50 (50% tissue culture infective dose) (0.01MOI) in 200 μl RPMI 1640 medium containing 10% FBS in the presence or absence of small molecules at graded concentrations overnight. The culture supernatants were then removed and fresh media containing freshly prepared test small molecules were added. On the fourth day post-infection, 100 μl of culture supernatants were collected from each well, mixed with equal volume of 5% Triton X-100 and tested for p24 antigen by ELISA.
The inhibitory activity of selected lead compounds (6, 50 and 55) on infection by primary HIV-1 isolates was determined as previously described39. PBMCs were isolated from the blood of healthy donors at the New York Blood Center by standard density gradient centrifugation using Histopaque-1077 (Sigma-Aldrich). The cells were cultured at 37 °C for 2 h. Nonadherent cells were collected and resuspended at 5×10⁶ cells/mL RPMI-1640 medium containing 10% FBS, 5μg/mL PHA, and 100 U/mL IL-2 (Sigma-Aldrich), followed by incubation at 37 °C for 3 days. The PHA-stimulated cells (5 × 10⁴ cells/mL) were infected with primary HIV-1 isolates at 500 TCID50 (0.01 MOI) in the absence or presence of small molecule inhibitors at graded concentrations. Culture media were changed every 3 days and replaced with fresh media containing freshly prepared inhibitor. The supernatants were collected 7 days post-infection and tested for p24 antigen by ELISA. The percent inhibition of p24 production and IC50 values were calculated by the GraphPad Prism software (GraphPad Software Inc.).
4.6. Cytotoxicity assay
Cytotoxicity of small molecules in MT-2 cells and PBMC was measured by the XTT [(sodium 3′-(1-(phenylamino)-carbonyl)-3,4-tetrazolium-bis(4-methoxy-6-nitro) bezenesulfonic acid hydrate)] method as previously described.39 Briefly, for MT-2 cells, 100 μl of a small molecule at graded concentrations was added to an equal volume of cells (1 × 10⁵ cells/mL) in 96-well plates followed by incubation at 37 °C for 4 days, which ran parallel to the neutralization assay in MT-2 (except medium was added instead of virus). In the case of PBMC, 5 × 10⁵ cells/mL were used and the cytotoxicity was measured after 7 days. After addition of XTT (PolySciences, Inc.), the soluble intracellular formazan was quantitated colorimetrically at 450 nm 4 h later with a reference at 620 nm. The percent of cytotoxicity and the CC50 values were calculated as above.
4.7. Infectivity Assay
In these assays we wanted to measure the infectivity potential of the virions released by treating cells infected with HIV-1 by 6 and 55. Briefly, 5×10⁴/mL MT-2 cells were infected with HIV-1 IIIB (m.o.i. = 0.01) in the presence of 5μM, 2.5μM and 1.3μM of small molecules 6 and 4μM, 2μM and 1μM of 55. Control cells were untreated or treated with 1ug/mL of AMD3100 (CXCR4 receptor inhibitor). Following overnight incubation the medium was completely removed and replaced with fresh medium. On the fourth day post-infection the supernatants were collected and filtered with a 0.45μm PVDF membrane.
One aliquot of the supernatants from each sample was mixed 1:1 with a solution of 5% Triton X-100 for p24 quantification, and stored at 4°C, another aliquot was immediately frozen at −80°C and used to compare the infectivity of the viral particles released by 6 and 55 treated cells to the viral particles released by untreated cells. P24 was quantified by sandwich-ELISA then the viral samples were normalized for the p24 content and titered by infecting MT-2 cells to calculate the TCID50. Following overnight incubation ¾ of the medium containing the inoculum was replaced with fresh medium. On the fourth day post infection supernatants were collected for p24 quantification by sandwich-ELISA and the TCID50 was calculated by the Spearman-Karber statistical method.
Acknowledgments
This study was supported by NIH Grant RO1 AI081604 (AKD) and the intramural fund from the New York Blood Center (AKD). We thank Yelena Oksov (electron microscopy) for her technical help.
Footnotes
Publisher's Disclaimer: This is a PDF file of an unedited manuscript that has been accepted for publication. As a service to our customers we are providing this early version of the manuscript. The manuscript will undergo copyediting, typesetting, and review of the resulting proof before it is published in its final citable form. Please note that during the production process errors may be discovered which could affect the content, and all legal disclaimers that apply to the journal pertain.
References
- 1.Briggs JA, Wilk T, Welker R, Krausslich HG, Fuller SD. EMBO J. 2003;22:1707. doi: 10.1093/emboj/cdg143. [DOI] [PMC free article] [PubMed] [Google Scholar]
- 2.Briggs JA, Grunewald K, Glass B, Forster F, Krausslich HG, Fuller SD. Structure. 2006;14:15. doi: 10.1016/j.str.2005.09.010. [DOI] [PubMed] [Google Scholar]
- 3.Li S, Hill CP, Sundquist WI, Finch JT. Nature. 2000;407:409. doi: 10.1038/35030177. [DOI] [PubMed] [Google Scholar]
- 4.Ganser BK, Li S, Klishko VY, Finch JT, Sundquist WI. Science. 1999;283:80. doi: 10.1126/science.283.5398.80. [DOI] [PubMed] [Google Scholar]
- 5.Ganser-Pornillos BK, Cheng A, Yeager M. Cell. 2007;131:70. doi: 10.1016/j.cell.2007.08.018. [DOI] [PubMed] [Google Scholar]
- 6.Ako-Adjei D, Johnson MC, Vogt VM. J Virol. 2005;79:13463. doi: 10.1128/JVI.79.21.13463-13472.2005. [DOI] [PMC free article] [PubMed] [Google Scholar]
- 7.von Schwedler UK, Stray KM, Garrus JE, Sundquist WI. J Virol. 2003;77:5439. doi: 10.1128/JVI.77.9.5439-5450.2003. [DOI] [PMC free article] [PubMed] [Google Scholar]
- 8.Abdurahman S, Hoglund S, Goobar-Larsson L, Vahlne A. J Gen Virol. 2004;85:2903. doi: 10.1099/vir.0.80137-0. [DOI] [PubMed] [Google Scholar]
- 9.Chien AI, Liao WH, Yang DM, Wang CT. Virol. 2006;348:84. doi: 10.1016/j.virol.2005.12.009. [DOI] [PubMed] [Google Scholar]
- 10.Douglas CC, Thomas D, Lanman J, Prevelige PE., Jr Biochemistry. 2004;43:10435. doi: 10.1021/bi049359g. [DOI] [PubMed] [Google Scholar]
- 11.Forshey BM, von Schwedler UK, Sundquist WI, Aiken C. J Virol. 2002;76:5667. doi: 10.1128/JVI.76.11.5667-5677.2002. [DOI] [PMC free article] [PubMed] [Google Scholar]
- 12.Ganser-Pornillos BK, von Schwedler UK, Stray KM, Aiken C, Sundquist WI. J Virol. 2004;78:2545. doi: 10.1128/JVI.78.5.2545-2552.2004. [DOI] [PMC free article] [PubMed] [Google Scholar]
- 13.Joshi A, Nagashima K, Freed EO. J Virol. 2006;80:7939. doi: 10.1128/JVI.00355-06. [DOI] [PMC free article] [PubMed] [Google Scholar]
- 14.del Alamo M, Mateu MG. J Mol Biol. 2005;345:893. doi: 10.1016/j.jmb.2004.10.086. [DOI] [PubMed] [Google Scholar]
- 15.Scholz I, Arvidson B, Huseby D, Barklis E. J Virol. 2005;79:1470. doi: 10.1128/JVI.79.3.1470-1479.2005. [DOI] [PMC free article] [PubMed] [Google Scholar]
- 16.Chang YF, Wang SM, Huang KJ, Wang CT. J Mol Biol. 2007;370:585. doi: 10.1016/j.jmb.2007.05.020. [DOI] [PubMed] [Google Scholar]
- 17.Abdurahman S, Hoglund S, Hoglund A, Vahlne A. Retrovirology. 2007;4:19. doi: 10.1186/1742-4690-4-19. [DOI] [PMC free article] [PubMed] [Google Scholar]
- 18.Abdurahman S, Youssefi M, Hoglund S, Vahlne A. Retrovirology. 2007;4:69. doi: 10.1186/1742-4690-4-69. [DOI] [PMC free article] [PubMed] [Google Scholar]
- 19.Yamashita M, Emerman M. J Virol. 2004;78:5670. doi: 10.1128/JVI.78.11.5670-5678.2004. [DOI] [PMC free article] [PubMed] [Google Scholar]
- 20.Vogt VM. Nat Struct Mol Biol. 2005;12:638. doi: 10.1038/nsmb0805-638. [DOI] [PubMed] [Google Scholar]
- 21.Li F, Wild C. Curr Opin Investig Drugs. 2005;6:148. [PubMed] [Google Scholar]
- 22.Li J, Tang S, Hewlett I, Yang M. Infect Disor Drug Targets. 2007;7:238. doi: 10.2174/187152607782110013. [DOI] [PubMed] [Google Scholar]
- 23.Niedrig M, Gelderblom HR, Pauli G, Marz J, Bickhard H, Wolf H, Modrow S. J Gen Virol. 1994;75:1469. doi: 10.1099/0022-1317-75-6-1469. [DOI] [PubMed] [Google Scholar]
- 24.Hoglund S, Su J, Reneby SS, Vegvari A, Hjerten S, Sintorn IM, Foster H, Wu YP, Nystrom I, Vahlne A. Antimicrob Agents Chemother. 2002;46:3597. doi: 10.1128/AAC.46.11.3597-3605.2002. [DOI] [PMC free article] [PubMed] [Google Scholar]
- 25.Garzon MT, Lidon-Moya MC, Barrera FN, Prieto A, Gomez J, Mateu MG, Neira JL. Protein Sci. 2004;13:1512. doi: 10.1110/ps.03555304. [DOI] [PMC free article] [PubMed] [Google Scholar]
- 26.Tang C, Loeliger E, Kinde I, Kyere S, Mayo K, Barklis E, Sun Y, Huang M, Summers MF. J Mol Biol. 2003;327:1013. doi: 10.1016/s0022-2836(03)00289-4. [DOI] [PubMed] [Google Scholar]
- 27.Sakalian M, McMurtrey CP, Deeg FJ, Maloy CW, Li F, Wild CT, Salzwedel K. J Virol. 2006;80:5716. doi: 10.1128/JVI.02743-05. [DOI] [PMC free article] [PubMed] [Google Scholar]
- 28.Li F, Goila-Gaur R, Salzwedel K, Kilgore NR, Reddick M, Matallana C, Castillo A, Zoumplis D, Martin DE, Orenstein JM, Allaway GP, Freed EO, Wild CT. Proc Natl Acad Sci USA. 2003;100:13555. doi: 10.1073/pnas.2234683100. [DOI] [PMC free article] [PubMed] [Google Scholar]
- 29.Kelly BN, Kyere S, Kinde I, Tang C, Howard BR, Robinson H, Sundquist WI, Summers MF, Hill CP. J Mol Biol. 2007;373:355. doi: 10.1016/j.jmb.2007.07.070. [DOI] [PMC free article] [PubMed] [Google Scholar]
- 30.Martin DE, Blum R, Wilton J, Doto J, Galbraith H, Burgess GL, Smith PC, Ballow C. Antimicrob Agents Chemother. 2007;51:3063. doi: 10.1128/AAC.01391-06. [DOI] [PMC free article] [PubMed] [Google Scholar]
- 31.Stoddart CA, Joshi P, Sloan B, Bare JC, Smith PC, Allaway GP, Wild CT, Martin DE. PLoS ONE. 2007;2:e1251. doi: 10.1371/journal.pone.0001251. [DOI] [PMC free article] [PubMed] [Google Scholar]
- 32.Smith PF, Ogundele A, Forrest A, Wilton J, Salzwedel K, Doto J, Allaway GP, Martin DE. Antimicrob Agents Chemother. 2007;51:3574. doi: 10.1128/AAC.00152-07. [DOI] [PMC free article] [PubMed] [Google Scholar]
- 33.Adamson CS, Ablan SD, Boeras I, Goila-Gaur R, Soheilian F, Nagashima K, Li F, Salzwedel K, Sakalian M, Wild CT, Freed EO. J Virol. 2006;80:10957. doi: 10.1128/JVI.01369-06. [DOI] [PMC free article] [PubMed] [Google Scholar]
- 34.Zhou J, Yuan X, Dismuke D, Forshey BM, Lundquist C, Lee KH, Aiken C, Chen CH. J Virol. 2004;78:922. doi: 10.1128/JVI.78.2.922-929.2004. [DOI] [PMC free article] [PubMed] [Google Scholar]
- 35.Zhou J, Chen CH, Aiken C. J Virol. 2006;80:12095. doi: 10.1128/JVI.01626-06. [DOI] [PMC free article] [PubMed] [Google Scholar]
- 36.Sticht J, Humbert M, Findlow S, Bodem J, Muller B, Dietrich U, Werner J, Krausslich HG. Nat Struct Mol Biol. 2005;12:671. doi: 10.1038/nsmb964. [DOI] [PubMed] [Google Scholar]
- 37.Schafmeister CE, Po J, Verdine GL. J Am Chem Soc. 2000;122:5891. [Google Scholar]
- 38.Ternois F, Sticht J, Duquerroy S, Krausslich HG, Rey FA. Nat Struct Mol Biol. 2005;12:678. doi: 10.1038/nsmb967. [DOI] [PubMed] [Google Scholar]
- 39.Zhang H, Bhattacharya S, Tong X, Waheed AA, Hong A, Heck S, Curreli F, Goger M, Cowburn D, Freed EO, Debnath AK. J Mol Biol. 2008;378:565. doi: 10.1016/j.jmb.2008.02.066. [DOI] [PMC free article] [PubMed] [Google Scholar]
- 40.Bhattacharya S, Zhang H, Debnath AK, Cowburn D. J Biol Chem. 2008;283:16274. doi: 10.1074/jbc.C800048200. [DOI] [PMC free article] [PubMed] [Google Scholar]
- 41.Irwin JJ, Shoichet BK. J Chem Inf Model. 2005;45:177. doi: 10.1021/ci049714. [DOI] [PMC free article] [PubMed] [Google Scholar]
- 42.Gross I, Hohenberg H, Krausslich HG. Eur J Biochem. 1997;249:592. doi: 10.1111/j.1432-1033.1997.t01-1-00592.x. [DOI] [PubMed] [Google Scholar]
- 43.Yu D, Wild CT, Martin DE, Morris-Natschke SL, Chen CH, Allaway GP, Lee KH. Expert Opin Investig Drugs. 2005;14:681. doi: 10.1517/13543784.14.6.681. [DOI] [PubMed] [Google Scholar]
- 44.Qian K, Kuo RY, Chen CH, Huang L, Morris-Natschke SL, Lee KH. J Med Chem. 2010;53:3133. doi: 10.1021/jm901782m. [DOI] [PMC free article] [PubMed] [Google Scholar]
- 45.Lipinski CA. J Pharmacol Toxicol Methods. 2000;44:235. doi: 10.1016/s1056-8719(00)00107-6. [DOI] [PubMed] [Google Scholar]
- 46.Lipinski CA, Lombardo F, Dominy BW, Feeney PJ. Adv Drug Deliv Rev. 2001;46:3. doi: 10.1016/s0169-409x(00)00129-0. [DOI] [PubMed] [Google Scholar]
- 47.Podvinec M, Lim SP, Schmidt T, Scarsi M, Wen D, Sonntag LS, Sanschagrin P, Shenkin PS, Schwede T. J Med Chem. 2010;53:1483. doi: 10.1021/jm900776m. [DOI] [PubMed] [Google Scholar]
- 48.Kim YA, Sharon A, Chu CK, Rais RH, Al Safarjalani ON, Naguib FNM, el Kouni MH. Biochem Pharmacol. 2007;73:1558. doi: 10.1016/j.bcp.2007.01.026. [DOI] [PMC free article] [PubMed] [Google Scholar]
- 49.Siddiquee K, Zhang S, Guida WC, Blaskovich MA, Greedy B, Lawrence HR, Yip MLR, Jove R, McLaughlin MM, Lawrence NJ, Sebti SM, Turkson J. Proc Natl Acad Sci USA. 2007;104:7391. doi: 10.1073/pnas.0609757104. [DOI] [PMC free article] [PubMed] [Google Scholar]
- 50.Tripathy R, Ghose A, Singh J, Bacon ER, Angeles TS, Yang SX, Albom MS, Aimone LD, Herman JL, Mallamo JP. Bioorg Med Chem Lett. 2007;17:1793. doi: 10.1016/j.bmcl.2006.12.054. [DOI] [PubMed] [Google Scholar]
- 51.Lyne PD, Lamb ML, Saeh JC. J Med Chem. 2006;49:4805. doi: 10.1021/jm060522a. [DOI] [PubMed] [Google Scholar]
- 52.Bembenek SD, Keith JM, Letavic MA, Apodaca R, Barbier AJ, Dvorak L, Aluisio L, Miller KL, Lovenberg TW, Carruthers NI. Bioorg Med Chem. 2008;16:2968. doi: 10.1016/j.bmc.2007.12.048. [DOI] [PubMed] [Google Scholar]
- 53.Ravindranathan KP, Mandiyan V, Ekkati AR, Bae JH, Schlessinger J, Jorgensen WL. J Med Chem. 2010;53:1662. doi: 10.1021/jm901386e. [DOI] [PMC free article] [PubMed] [Google Scholar]
- 54.Srivastava A, Singh MK, Singh RM. Indian J Chem B. 2006;45:292. [Google Scholar]
- 55.Meth-Cohn O, Narine B, Tarnowski B. J Chem Soc Perk T. 1981;1:1520. [Google Scholar]
- 56.Pawarr RA, Bajare PB, Mundade SB. J Indian Chem Soc. 1990;67:685. [Google Scholar]