

Abstract
The study of speciation has advanced considerably in the last decades because of the increased application of molecular tools. In particular, the quantification of gene flow between recently diverged species could be addressed. Drosophila simulans and Drosophila mauritiana diverged, probably allopatrically, from a common ancestor approximately 250 000 years ago. However, these species share one mitochondrial DNA (mtDNA) haplotype indicative of a recent episode of introgression. To study the extent of gene flow between these species, we took advantage of a large sample of D. mauritiana and employed a range of different markers, i.e. nuclear and mitochondrial sequences, and microsatellites. This allowed us to detect two new mtDNA haplotypes (MAU3 and MAU4). These haplotypes diverged quite recently from haplotypes of the siII group present in cosmopolitan populations of D. simulans. The mean divergence time of the most diverged haplotype (MAU4) is approximately 127 000 years, which is more than 100 000 years before the assumed speciation time. Interestingly, we also found some evidence for gene flow at the nuclear level because an excess of putatively neutral loci shows significantly reduced differentiation between D. simulans and D. mauritiana. Our results suggest that these species are exchanging genes more frequently than previously thought.
Keywords: Drosophila mauritiana, Drosophila simulans, Hybridization, introgression, maIII, mtDNA, siII
Introduction
What defines a species? It is clear from the numerous definitions used that there is no universal concept with which all biologists would agree (Coyne & Orr 2004). This difficulty arises directly from the continuous nature of the process that can ultimately lead to speciation (Darwin 1859; Coyne & Orr 2004; Mallet 2006). More recently, however, it has become increasingly accepted that species can exchange genes and still maintain their species integrity. An interesting and still unanswered question, therefore, is how much gene flow can be tolerated without losing species identity?
Drosophila simulans and Drosophila mauritiana are an ideal model system to address this question. Their separation occurred probably 250 000 years ago (Kliman et al. 2000; McDermott & Kliman 2008). Since then, these species have accumulated several morphological and behavioural differences (e.g. Cowling & Burnet 1981; Robertson 1983; Cobb et al. 1988; Lachaise et al. 1988; Orgogozo & Stern 2009), as well as numerous hybrid incompatibilities (Coyne & Charlesworth 1986; True et al. 1996b; Ting et al. 2000; Tao et al. 2003a,b; Cattani & Presgraves 2009). Some of these differences might contribute to the maintenance of their reproductive isolation. However, laboratory crosses show that isolation is incomplete because hybrid females are fertile and can have fertile offspring when backcrossed to males of either parental species. Furthermore, introgression of mtDNA has been detected for these species, indicating that hybridization occurred in nature (Solignac & Monnerot 1986; Aubert & Solignac 1990; Ballard 2000a,b;). Multilocus polymorphism data have been used to investigate whether there has been recent gene flow from D. simulans into D. mauritiana (Hey & Kliman 1993; Kliman et al. 2000; Noor & Kliman 2003; McDermott & Kliman 2008). However, although little evidence was found supporting gene flow, the power of these studies may have been limited because either only a small number of loci or a small number of individuals were analysed.
In this study, we take advantage of a large sample of D. mauritiana and of different types of markers (i.e. nuclear and mitochondrial sequences, and microsatellites) to investigate the extent of hybridization between D. mauritiana and D. simulans.
Our results show that at least two, and possibly three, independent hybridization events that led to the introgression of mtDNA from one species into the other occurred in the recent history of these species. In addition, we found an excess of nuclear loci showing significantly low differentiation, which possibly indicates that they are located in regions of the nuclear genome particularly permeable to gene flow between species.
Materials and methods
Population samples and data sets
In this study, we analysed 125 Drosophila mauritiana isofemale lines representing fly collections over a 28- year period as well as multiple sampling localities from the same year (Table S1). Three of these collections have been maintained in the laboratory as isofemale lines (MAU, MS and RED). The MAU samples were acquired many years before the closure of the Bowling Green stock centre. Several lines exhibited visible markers resulting from spontaneous mutations in wild-type stocks. The exact origin and degree of relatedness of the marker stocks are not known.
To detect the introgression, we sequenced fragments of four mitochondrial genes (mt:CoI, mt:ND4, mt:ATPase6 and mt:ND5) and three nuclear loci (pcl, fog and mav) from the DNA of single individual females from each of the samples. We also characterized their genotypes at 25 microsatellite loci (eight individuals had to be removed from the data set because of incomplete genotypes).
pcl and fog are located on the X chromosome, at the telomere (cytological bands 1B2-1B2 of Drosophila melanogaster) and centromere (20D2-20E1 of D. melanogaster), respectively. The tips of X-chromosome exhibit low rates of recombination in Drosophila simulans and D. melanogaster, but normal recombination rates in D. mauritiana (True et al. 1996a). It should be noted, however, that these two genes lie downstream and upstream of the markers that delimit the recombination map. Although there is an overrepresentation of hybrid male sterility factors on the X chromosome (True et al. 1996b), none mapped to the tips of the chromosome. Nevertheless, after we completed our data collection, a locus involved in hybrid inviability (hlx) was mapped to the centromeric heterochromatin of the X chromosome (Cattani & Presgraves 2009). Hence, we do not know to what extent the pattern of variability of fog is affected by this. mav is located in the lowly recombining 4th chromosome (102C-102C of D. melanogaster). This locus was chosen because the whole 4th chromosome was shown to lack hybrid sterility factors in crosses between D. mauritiana and D. simulans (Coyne & Berry 1994).
Mau24, Mau17, RB11 and RED25 were sequenced for fragments of two additional mtDNA genes, mt:ND2 and mt:Cyt-b. Primer sequences, amplification product length and annealing temperature are listed in Table S2 for all loci.
Sequence data for the first four mtDNA fragments and the three nuclear loci were obtained from individuals belonging to seven D. simulans populations (Table S1).
For the microsatellite-based comparisons between D. mauritiana and D. simulans, we took advantage of a set of 15 D. simulans individuals previously genotyped in our laboratory. These individuals are samples from Asia (China), Europe (Portugal and Italy) and South America (Brazil). Two previously genotyped Zimbabwean populations of D. melanogaster (11 and 21 isofemale inbred lines from Sengwa and Victoria Falls respectively) were used for the analyses, where a comparison to an outgroup was required (Table S1). The raw data for the microsatellites are available in Dryad (doi: 10.5061/dryad.1731).
Screening of Wolbachia
To test our samples for the presence of Wolbachia, we used primers that are conserved in several Wolbachia sequences available in GenBank and which belong to strains that were isolated from various Drosophila species (Table S2).
DNA extraction, amplification and sequencing
DNA was isolated from individual females of each strain by a high-salt extraction method (Miller et al. 1988). Standard amplification conditions were 35 cycles of denaturation at 94 °C for 50 s, primer annealing temperature as indicated in Table S2 and primer extension at 72 °C for 50 s. PCR products were purified using 96-well plates (Millipore) according to the supplier's protocol. All PCR products were sequenced in both directions with primers used for the fragment amplifications, using ET Dye Terminator Sequencing Chemistry (GE Healthcare Life Sciences). Non-incorporated dyes were removed using Sephadex G-50 fine (Amersham Biosciences, Sweden), and the sequencing reaction products were separated on a MegaBACE 500 automated capillary sequencer. Sequences were manually checked and edited using Codoncode aligner 3.03.
For the fog gene, we obtained sequences heterozygous for an indel, which precluded analysis for the region covered by the indel in these individuals. The sequence upstream and downstream of the indel could be inferred from the complementary strand. All sequences obtained in this study were deposited in GenBank (Accession Numbers: HM630611-HM631626).
Sequence analysis
The sequences of the four mtDNA gene fragments (mt:CoI, mt:ND4, mt:ATPase6 and mt:ND5) were concatenated prior to analysis. Sequences were aligned with MacClade 4.08 (Maddison & Maddison 2000). Standard diversity estimates were calculated with DnaSP version 5.10 (Librado & Rozas 2009).
We detected several heterozygous individuals for the nuclear genes. Their sequences were treated as follows. First, we inferred the phase of the haplotypes using the PHASE v2.1.1 program (Stephens et al. 2001; Stephens & Donnelly 2003) implemented in DnaSP. Analogue to previous treatments of inbred lines for diversity surveys, we randomly discarded one of the alleles in heterozygous individuals from inbred isofemale lines. In contrast, for the first generation offspring of freshly collected females, we kept both alleles. The mtDNA of three individuals (MAU22, MAU38 and RB12) showed evidence of heteroplasmy (maI and maII alleles). In all fragments, the most abundant haplotype based on the chromatogram peaks was maI for all three individuals; therefore, we score them as such. Two individuals (RED30 and KIB4) were heteroplasmic at a single position of their sequences, probably resulting from a new mutation occurring only in those individuals. In these two cases, we randomly discarded one of the alleles.
We assessed the phylogenetic relationship between the haplotypes present in each of the four data sets (i.e. the three nuclear fragments and the concatenated mtDNA fragment) using the maximum-likelihood method implemented in PAUP* 4.10b (Swofford 1998). The following mtDNA sequences available at GenBank were added to the mtDNA concatenated data set: DmelOregR/AF200828, DmelZim53/AF200829, Dsech/AF200832, DsimHW00/AF200835, DsimHW09/AF200836, DsimTT01/AF200834, DmauG52/AF200830, DsimAU023/AY518674, DsimC167/AF200839, DsimKY007/AY518670, DsimKY045/AY518671, DsimKY201/Y518673, DsimMD106/AF200842, DsimMD199/AF200852 and DmauBG1/AF200831. The reference sequences of D. melanogaster and Drosophila sechellia were added to the nuclear genes data sets.
Prior to analyses, we estimated the model of evolution that best fitted each data set using ModelTest v3.7 (Posada & Crandall 1998). For each data set, 100 bootstrap replicates were performed to assess nodes' support values. The final trees were displayed in Treeview (Page 1996). We used D. melanogaster as outgroup for these analyses.
IM analysis
We used the software IM (Hey & Nielsen 2004), which considers a model of isolation with migration to estimate the number of migrants per generation between D. mauritiana and D. simulans (m), the time of split between the two species (t), their correspondent effective population sizes (Ne) and that of their common ancestor (NA). For this analysis, we assumed uninformative priors for the six model parameters under the HKY model for a data set consisting of the four sequenced loci, i.e. the mtDNA locus and the three nuclear loci. We ran the analysis multiple times under different heating schemes for the Metropolis coupled Markov chains until good mixing was achieved as determined by the parameters low autocorrelation over the course of the runs and by large values of the effective sample size estimate (above 10 000). The final analysis was repeated ten times for each data set to assess repeatability of the results using 100 Markov chains following a geometric heating scheme with 2 000 000 steps for the burn-in and 1 000 000 steps for the data collection. We considered a substitution rate of 1.54 × 10⁻⁸ per site/year/bp for the nuclear loci (Li 1997) and of 1.6 × 10⁻⁸ per site/year/bp for the mitochondrial DNA (Sharp & Li 1989). To account for the mutation rate uncertainty, we allowed the values to range between +/− one order of magnitude around the values mentioned earlier. We assumed ten generations per year.
Timing of the split between D. mauritiana and D. simulans
We estimated the time to the most recent common ancestor (TMRCA) of all D. mauritiana pcl alleles, using only derived silent polymorphisms (11 out of a total of 154 silent sites), as a proxy of the minimum time of divergence between D. mauritiana and D. simulans. The TMRCA of those sequences was estimated using the software Genetree (Bahlo & Griffiths 2000) assuming a constant population size and ten generations per year. For the TMRCA estimation, we used (i) the estimated value of theta (θ = 3Neμ) calculated with Genetree for the D. mauritiana data and (ii) an estimated θ based on a published silent sites substitution rate of 1.54 × 10⁻⁸ per site/year/bp (Li 1997) and assuming a population size in D. mauritiana of one million individuals. For each value of θ, we ran Genetree (Bahlo & Griffiths 2000) three separate times with different random seeds and for one million coalescent simulations.
Microsatellite analyses
Standard population genetics summary statistics (e.g. Heterozygosity, FST) were calculated using msa v.4.1 (Dieringer & Schlötterer 2003). As the data set included inbred isofemale lines, we accounted for the random loss of allelic variation because of inbreeding by calculating the mean of 200 data sets of randomly discarded alleles. The allelic richness was estimated accounting for the unevenness in sample size between the two species by rarefaction analysis of the D. mauritiana samples to match the sample size in D. simulans.
A group-based analysis of population structure was performed with BAPS 5.2 (Corander & Martinen 2006) using the total number of groups analysed as the prior vector of the number of clusters present in the data and repeating the analysis to confirm repeatability of the results. In an initial step, the three samples collected during 2007 were analysed separately to determine the current population structure in Mauritius. As these samples clustered together with a posterior probability of 0.94, they were pooled as a single group for the remaining analyses. We calculated a neighbour-joining (NJ) tree in Phylip 3.6b (Felsenstein 1989) based on the distance – proportion of shared alleles (Bowcock et al. 1994) – between samples pooled by collection year. A total of 100 bootstrap replicas were performed to assess node support. The final tree was displayed in Treeview (Page 1996).
We determined a null distribution of the statistic FST to identify outlier loci (outside the 95 percentile of the distribution) that could reflect genomic regions permeable or refractory to introgression. For this purpose, we simulated 10 000 loci under the assumptions of neutrality and demographic equilibrium using the program ms (Hudson 2002). We assumed a θ estimate of four (i.e. the average of the θ estimates for D. mauritiana and D. simulans inferred from the observed gene diversity assuming the stepwise mutation model and after correcting the X-linked markers'θ estimate by 4/3 to account for the X chromosome's smaller Ne), a diploid Ne of one million individuals, ten generations per year and a divergence time between D. mauritiana and D. simulans of 250 000 years ago (McDermott & Kliman 2008) (the ms command used was: ./ms 400 10000 -t 4 -I 2 200 200 -ej 1.25 1 2). To accommodate the uncertainty in the divergence time between the species, we also performed this analysis for the extremes of the 95% confidence intervals (95%CI) of the divergence time estimated by McDermott & Kliman (2008), i.e. lower bound of the 95%CI ∼50 000 and upper bound of the 95%CI ∼510 000 years ago. The output of the ms program was converted to microsatellite data following the stepwise mutation model with the script ms2ms.pl (Pidugu & Schlotterer 2006).
Results
Nuclear loci show complete monophyletic clustering of Drosophila simulans and Drosophila mauritiana individuals
Nuclear genes
We sequenced DNA fragments of three nuclear genes: pcl, fog and mav. The phylogeny of the three species of the D. simulans complex differs among the three nuclear gene fragments (Fig. S1). This result is well described and illustrates the difficulties in solving the species relationships when lineages split recently (Caccone et al. 1988, 1996; Singh 1989; Hey & Kliman 1993; Kliman & Hey 1993; Hilton et al. 1994; Harr & Schlötterer 2004). Nevertheless, for all loci, the D. simulans and D. mauritiana sequences show monophyletic clustering (Fig. S1). In fact, the only single polymorphic site shared between D. mauritiana and D. simulans occurred in the fog locus. Pairwise nucleotide diversity for mav and fog is approximately one order of magnitude higher in D. simulans. pcl is completely monomorphic in D. simulans, while D. mauritiana has almost ten times higher levels of polymorphism than in the other loci (Table 1).
Table 1.
Estimates of polymorphism and divergence for the three nuclear loci
| S | π | F | S* | Ks | |
|---|---|---|---|---|---|
| pcl (595 bp) | |||||
| Drosophila mauritiana | 24 | 0.0015 | 7 | 0 | 0.021 |
| Drosophila simulans | 0 | 0.0000 | |||
| fog (479 bp) | |||||
| D. mauritiana | 15 | 0.0003 | 4 | 1 | 0.015 |
| D. simulans | 11 | 0.0088 | |||
| mav (582 bp) | |||||
| D. mauritiana | 5 | 0.0005 | 6 | 0 | 0.025 |
| D. simulans | 4 | 0.0029 | |||
Sample size for D. mauritiana = 165 and for D. simulans = 31. Sequence length, after discarding alignment gaps, is shown in brackets after the gene name. S is number of segregating sites; π is silent nucleotide diversity with Jukes-Cantor correction; F is the number of fixed differences between D. mauritiana and D. simulans; S* is the number of shared polymorphisms between D. mauritiana and D. simulans; Ks is the average number of silent substitutions per site between D. mauritiana and D. simulans.
pcl is located in a region of reduced recombination rate in D. melanogaster and D. simulans, but nonreduced in D. mauritiana. Because this is a derived state in D. mauritiana, the increased variability of pcl in D. mauritiana relative to D. simulans probably results from mutations that occurred after their split. Therefore, we considered the time to TMRCA of the derived mutations as a lower boundary of the species isolation time. We obtained two estimates of the TMRCA depending on the θ used. While the TMRCA estimated based on the published silent substitution rate of 1.54 × 10⁻⁸ for D. melanogaster (θ = 0.712) was 299 080 years, the one estimated from our data (θ = 1.935) resulted in a minimum divergence time of 210 400 years. The three replicates of each analysis yielded consistent results.
Microsatellites
Drosophila microsatellites evolve slowly (Schug et al. 1997; Schlötterer et al. 1998; Bachtrog et al. 2000) but their mutation rates are still higher than those of single-copy genes, making them useful markers to study relationships among closely related species (Harr et al. 1998). Microsatellite polymorphism varied between a maximum of 16 alleles and a minimum of one with an average of 7.84 alleles per locus, and the average expected heterozygosity ranged from 0.301 to 0.396 (Table S3). The 4th chromosome marker was fixed for the same allele in both species, and overall, D. mauritiana presented a higher allelic richness than D. simulans (4.15 vs. 3.2 alleles per locus, respectively). The BAPS analysis yielded four clusters supported with a posterior probability of one, separating D. mauritiana from D. simulans. The collections MAU and MS formed separate clusters from the remaining D. mauritiana samples. Remarkably, the third D. mauritiana cluster included the 1979 (G) sample and the more recent samples collected since 2000 (RB, RED and CS) indicating the lack of temporal isolation between these collections. Four D. mauritiana individuals from the MS, MAU and RED collections were significantly admixed (Fig. 1a). No admixture between the two species was detected.
Fig. 1.
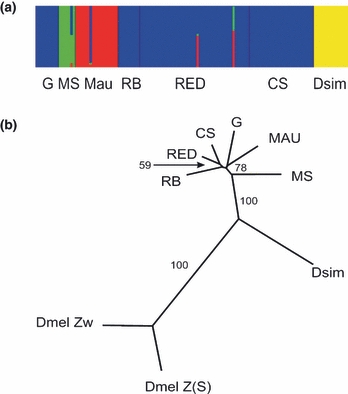
Multilocus microsatellite data show complete separation between Drosophila simulans and Drosophila mauritiana individuals. (a) Group-based Bayesian analysis of population structure. Collections are separated by black bars. Admixed individuals show more than one colour representing by the colour's proportion in the bar the proportion of ancestry from a particular cluster. (b) Neighbour-joining tree between the collections of D. mauritiana, D. simulans and Drosophila melanogaster. Only bootstrap support values above 75 are shown.
The pairwise FST comparison between collections and their correspondent p-value after Bonferroni correction are shown in Table S4. Within D. mauritiana, one-third of the pairwise comparisons are significant and in all cases these involve a comparison with MAU or MS reflecting the higher differentiation of the last two clusters compared to the remaining D. mauritiana samples as observed with the BAPS analysis. We cannot distinguish whether this differentiation results from particular natural history features of these samples or whether this is attributable to the kinship between the lines (e.g. MS lines share a higher proportion of alleles than the other populations). The fact that these are inbred lines excluded the possibility of using kinship tests, as it is not trivial to account for the random loss of alleles during the inbreeding process. As observed earlier, no significant temporal differentiation was observed between the G sample of 1979 and the most recent samples of 2007 despite of the approximately 280 generations separating them. All comparisons between species are significant and reflect high differentiation. In concordance with the lack of admixture between D. mauritiana and D. simulans found in the BAPS analysis, the NJ tree calculated based on the proportion of shared alleles separated both species with a bootstrap support of 100% (Fig. 1b). Within D. mauritiana, only the MS collection presented a bootstrap support higher than 75% separating it from the remaining sample sets. The lack of high bootstrap support values for the remaining branches within the D. mauritiana clade reflects the little differentiation between sample sets observed with the FST analysis.
Paraphyletic clustering of D. simulans and D. mauritiana mtDNA sequences and identification of a new mtDNA haplotypic class in D. mauritiana
We obtained approximately 2 kb of mtDNA sequence from eight collections of D. mauritiana sampled over a period of at least 28 years (Table S1 and S5). We also included 19 D. simulans individuals from populations located at the centre of the species diversity (Table S1 and S5), where all haplotypic classes can be found (Solignac 2004). Ten additional haplotypes were found in sequences from GenBank and they were also included in the analyses.
Figure 2 shows the phylogenetic relationships between the haplotypes found for the sequenced mtDNA region. The clear differentiation between D. simulans and D. mauritiana observed at nuclear loci is no longer apparent for the mtDNA. As previously reported, mtDNA sequences do not cluster according to their species identity (Solignac et al. 1986; Satta & Takahata 1990; Ballard 2000a), with individuals having mtDNA haplotypes that more closely related to those of the other species than to those of its own. Separation between the major haplotypic groups is supported by high bootstrap support values for the corresponding nodes. In total, ten different haplotypes were found in D. mauritiana. Most of these haplotypes (about 60%) fall into the siIII/maI haplogroup, which is the most abundant one in our data set (about 82%, Fig. 2). In the highly divergent maII haplogroup, which is endemic to Mauritius (Solignac 2004), we identified three different haplotypes. One of them, GenBank accession DmauG52, is absent from our collections. Almost 15% of the individuals in our collection harbour mtDNA of the maII type. The relative frequencies of maI and maII in our collections are similar to previous studies (Aubert & Solignac 1990).
Fig. 2.
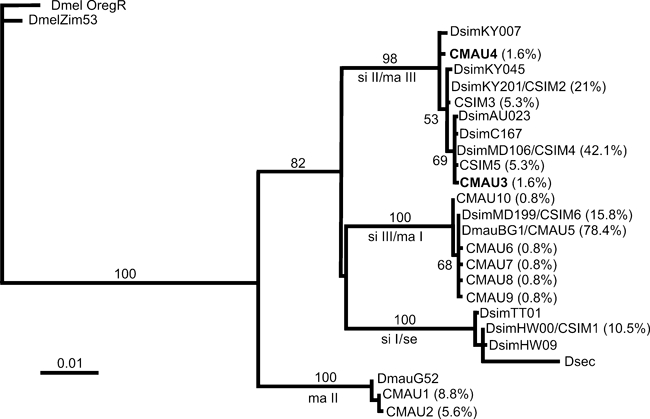
Maximum-likelihood phylogeny of mtDNA haplotypes of the Drosophila melanogaster subgroup, based on four mtDNA fragments. The new maIII Drosophila mauritiana haplotypes are shown in bold. Haplotypes obtained from GenBank (see Materials and Methods) carry a prefix indicating the species origin, whereas haplotypes identified in this study have the prefix CMAU or CSIM, depending on whether they were isolated from D. mauritiana or Drosophila simulans individuals, respectively. Numbers inside the brackets are the frequency of each haplotype in the correspondent species. Bootstrap values, above branches, are calculated based on 100 replicates and indicate the statistical support for the corresponding node. The haplotypic class of a given branch is indicated below the branches.
Interestingly, we detected two new mtDNA haplotypes (highlighted in Fig. 2) that do not fall into any of these two haplotypic groups. The new variants clustered with D. simulans sequences of the siII haplogroup. These haplotypes are present in only four of the 125 D. mauritiana individuals (Mau17, Mau24, RB11 and RED25) and so far only D. simulans individuals were known to carry this mtDNA type. In this work, we refer to this new D. mauritiana haplotype group as maIII.
The frequency of the three different haplotypic groups is shown in Fig. S2. Two collections, MAU and MS, stand out from the rest by showing a much higher proportion of maII, (44 and 86% respectively). After the removal of MAU and MS, there is no difference between collections in the frequency of the three haplotype classes (P > 0.3, contingency table χ2 statistical test). While the observed differences in frequencies of the different haplotypes can result from a higher relatedness of MAU and MS (see Materials and Methods), it is also possible that these collections are truly differentiated from the others because of, for example, unrecognized temporal structure in D. mauritiana.
Given the known high divergence between haplotypic groups, it is not surprising to find considerable mtDNA diversity within species (Table 2). As previously described for the D. simulans clade, variability drops significantly within haplotypic classes. Interestingly, maIII harboured the highest amount of polymorphism, being almost two times more polymorphic than the corresponding D. simulans siII haplotypes. This is particularly interesting, as siII is the only haplotype for which no reduced variability has been detected in Wolbachia-free D. simulans populations (Ballard 2004). It is also worth noting that maI shows higher diversity than siIII. While sampling variance could be responsible for this difference, a large D. simulans population survey in regions where siIII is common also found very little polymorphism in this class (Dean et al. 2003).
Table 2.
Estimates of variability for each haplotypic class
| n | S | h | Hd | π | |
|---|---|---|---|---|---|
| Drosophila mauritiana (2088 bp) | |||||
| maI | 103 | 6 | 6 | 0.10 | 0.00004 |
| maII | 18 | 1 | 2 | 0.50 | 0.00104 |
| maIII | 4 | 6 | 2 | 0.67 | 0.00699 |
| Total | 125 | 112 | 10 | 0.38 | 0.04793 |
| Drosophila simulans (2088 bp) | |||||
| siI | 2 | 0 | 1 | 0.00 | 0.00000 |
| siII | 14 | 5 | 4 | 0.63 | 0.00370 |
| siIII | 3 | 0 | 1 | 0.00 | 0.00000 |
| Total | 19 | 94 | 6 | 0.78 | 0.05934 |
Sequence length, after discarding alignment gaps, is shown in brackets after the species name. n is sample size; S is number of segregating sites; h is number of haplotypes; Hd is haplotype diversity; π is silent nucleotide diversity with Jukes-Cantor correction.
The high sequence similarity between maIII and siII may be the result of a hitherto unrecognized event of introgression because of the hybridization between D. mauritiana and D. simulans. Alternatively, their shared variation could result from ancestral polymorphism still segregating in the descendant lineages. These two alternative scenarios are discussed later.
IM analyses- isolation with or without migration?
Given the high amount of shared polymorphism between D. simulans and D. mauritiana in the mtDNA data and almost entirely fixed differences at the nuclear loci, we were interested to know whether the data could be explained by a simple isolation model.
Using the IM software, we obtained consistent estimates across independent replicas for the Ne of D. mauritiana and D. simulans, and the number of migrants into each of the species. Estimates of the effective population size of the ancestral population (NA) and t were not convergent across replicates or the posterior distribution was flat and uninformative reflecting the lack of information content about these parameters in our data set. Our data shows that D. mauritiana has an Ne almost twice as large as that of D. simulans, 1.129 375 and 552 027, respectively (the reported values are means across 10 replicates of the analysis). The migration rate estimate revealed extensive migration at the mtDNA level but none at the nuclear DNA level (Table 3, Fig. 3, and Supporting Table S6).
Table 3.
Parameter estimates obtained from IM
| 2 Nm | |||||
|---|---|---|---|---|---|
| Species | Ne | mtDNA | mav | fog | pcl |
| Drosophila mauritiana | 1 129 375 (633 052–1 645 952) | 1.07 (0.014–3.74) | 0.014 (0.01–0.322) | 0.014 (0.01–0.52) | 0.014 (0.01–0.462) |
| Drosophila simulans | 552 027 (227 908-1 088 869) | 1.08 (0.089–5.00) | 0.007 (0.01–0.294) | 0.026 (0.01–0.62) | 0.054 (0.01–0.68) |
Ne is the effective population and 2 Nm is the effective migration rate per generation calculated for each locus. In parenthesis are the minimum and maximum boundaries of the 90% highest posterior density for the estimated parameter. Migration rate estimates reflect migration rates into the corresponding species. The parameter estimates provided in this table are the estimates' average across 10 replicate analyses, and the HPD values are the most extreme ones found across these replicas.
Fig. 3.
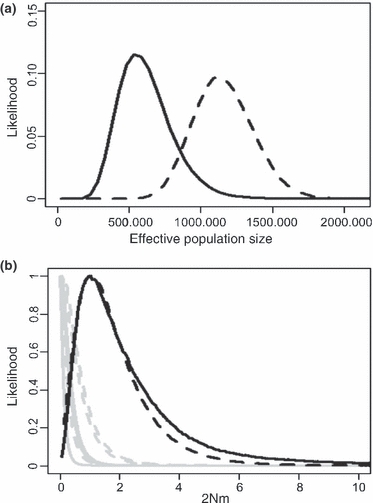
Marginal posterior distribution of the parameters estimated under the IM model. (a) Effective population size of Drosophila mauritiana (dashed line) and Drosophila simulans (solid line). (b) Effective number of migrants per generation into D. mauritiana (dashed lines) and into D. simulans (solid lines) for the mtDNA (black) and for the three nuclear loci (grey).
The introgression of siII into D. mauritiana occurred in the last 125 000 years
Because we found evidence of gene flow for the mtDNA between the two species, we estimated the time of the putative introgression based on the number of observed silent site changes between the closest D. simulans siII- D. mauritiana maIII sequence pair. Figure 2 illustrates that DsimKY007 is the closest sequence to MAU4, whereas several haplotypes are equally distant to MAU3. To increase the number of informative sites and decrease the error in our estimates, we sequenced two additional mtDNA fragments from the four D. mauritiana individuals bearing the new haplotypes (see Materials and Methods). In total, the six concatenated mitochondrial fragments contained 737 silent sites. We found three silent site substitutions between D. mauritiana MAU4 and its closest D. simulans relative DsimKY007. Assuming a silent substitution rate of 1.6 × 10⁻⁸ (Sharp & Li 1989) per site per year, the mean divergence time between these two haplotypes is 127 205 years and the maximum time of divergence compatible with observing no more than three mutations is 325 000 years (P < 0.05, Poisson distribution). There were no silent differences between MAU3 and several D. simulans sequences (i.e. DsimMD106). This implies a split no longer than 125 000 years ago (P < 0.05, Poisson distribution).
MtDNA introgression- one, two, three?
If we accept that MAU4 is not an ancestral allele segregating in D. mauritiana, then its sequence could be derived from MAU3 after this haplotype introgressed from D. simulans into D. mauritiana. However, as the distance between MAU3 and MAU4 is larger (five synonymous substitutions) than that between MAU4 and DsimKY007 (three synonymous substitutions, Fig. 2) the divergence between the two maIII haplotypes dates well longer than 325 000 years ago. Therefore, the occurrence of MAU3 and MAU4 in D. mauritiana probably resulted from independent introgression events, either simultaneously or at different time points. These results imply that in addition to the described introgression involving the siIII/maI haplotypes, one and possibly two additional events of mtDNA introgression must have occurred in the recent history of these species.
Does Wolbachia facilitate cytoplasmic introgression?
The movement of mtDNA across species boundaries might be driven by Wolbachia-induced CI or beneficial effects of Wolbachia on its host (Ballard 2000b; Hurst & Jiggins 2005; Bachtrog et al. 2006). We sought to determine whether maIII individuals are infected with the same Wolbachia strain that occurs in those D. simulans individuals with the siII mtDNA type. According to predictions based on a study by Ballard (2004), flies with maIII-MAU4 haplotype should have no infection because DsimKY007 belongs to a clade of siII haplotypes not infected with Wolbachia while maIII-MAU3 individuals could be uninfected or infected with wRi or wAu Wolbachia. However, our screen for Wolbachia showed that none of the four individuals with maIII mtDNA was infected (Table S7).
Analysis of individual microsatellites reveals an excess of significantly high and low differentiated loci
Unless introgression following hybridization involves preferentially the mtDNA, we would expect to see a signal of introgression also in the nuclear data. While the combination of several microsatellites is expected to give a robust signal of the species divergence, individual loci could potentially reveal localized events of gene flow between species.
Our analysis of the microsatellite data identified an excess of markers that presented a lower or a larger than expected FST when compared to that statistic's null distribution (Fig. 4). As the 4th chromosome microsatellite was fixed for the same allele in both species, it was not considered for this analysis. Considering that 5% of the markers could randomly show an extreme FST value, we expected no more than one locus showing such an extreme value. Contrary to our expectation, we found that five microsatellites showed an FST smaller than the lower 95% cut-off of our estimated FST null distribution (two loci on the 2nd chromosome and three on the 3rd chromosome). We also found six microsatellites with a larger than expected FST value (three loci on the X chromosome, two on the 2nd chromosome and one on the 3rd Chromosome). In neither case are these loci characterized by a reduced or a large heterozygosity. In both cases, the mean locus heterozygosity is 0.28 with a minimum of 0.08 for both sets of loci and a maximum of 0.48 for the low FST loci and 0.41 for the high FST loci. As the maximum value the FST can reach can be biased when extremely polymorphic markers like microsatellites are used, we repeated our analysis with the statistic GST' which is standardized to account for large heterozygosity values (Hedrick 2005). We confirmed our results with the FST analysis but instead of finding five loci with extremely low GST' values, we found ten such outlier markers. As the maximum GST' observed in our data set and in the simulations was one, there were no outliers with unexpectedly large GST' values. Repeating this analysis for the extremes of the 95% confidence interval of the divergence time between these species (McDermott & Kliman 2008) reduced the number of loci with a lower than expected FST from five to three for the lower 95%CI of tau (∼50 000 years), while for the upper 95%CI of tau (∼510 000 years) the same six loci with a higher than expected FST remained as outlier. The equivalent analysis for the GST' reduced by one locus the number of loci with a lower than expected GST'.
Fig. 4.
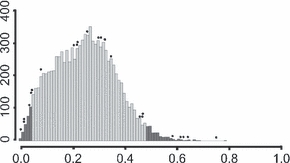
FST null distribution for 10 000 loci. The 95 percentile of the distribution is in light gray and the 5 percentile extreme values are highlighted in dark gray. The black dots represent the FST values for each of the microsatellites. The FST value for the marker on the 4th chromosome is not shown because the same allele is fixed in both species. Counts refer to the number of times that each FST value was observed in the simulations.
Discussion
mtDNA introgression
Gene flow between D. mauritiana and Drosophila simulans is currently supported mostly by the existence of a shared mtDNA haplogroup, maI-siIII (Solignac & Monnerot 1986; Ballard 2000b). Analyses of gene flow are extremely difficult, and its inference based on a single type of analysis is likely to be unreliable. Hence, we have used multiple pieces of evidence to support our conclusion that at least one, but possibly two additional independent mtDNA introgression events occurred. Based on pcl, we were able to infer that D. simulans and D. mauritiana must have diverged from a common ancestral pool at least 210 000 years ago. It is possible that under certain circumstances the time of coalescence of the D. mauritiana pcl alleles could be deeper than the time of species split. However, McDermott & Kliman (2008) have recently re-estimated the split between D. simulans and D. mauritiana to have occurred around 250 000 years ago, well within the range of values obtained by us. Given these estimates of the speciation time, the occurrence of the MAU3 haplotype in D. mauritiana is more likely to be explained by recent gene flow between the two species than by segregating ancestral polymorphism.
We cannot rule out that MAU4 is an old ancestral allele segregating at low frequency in D. mauritiana. However, given the overlap between the estimates and the possibility that we have not sampled all D. simulans siII haplotypes (Ky007 belongs to a clade within siII particularly variable, Ballard 2004), it seems reasonable to suggest that the presence of MAU4 in D. mauritiana is the consequence of another introgression event. As mentioned before, it is unlikely that both MAU3 and MAU4 result from the same introgression event, because the accumulation of differences between them implies a divergence larger than the isolation time between the species.
Another two alternative scenarios could explain the observed patterns. First, contamination with D. simulans could have occurred during laboratory maintenance of the stocks. However, one of the individuals harbouring the maIII haplotype (RB11) was the F1 of a wild-collected female, rendering this hypothesis very unlikely. Furthermore, we detected no evidence for introgression for these lines using microsatellites and nuclear DNA sequence data. Recurrent mutation may also account for the observation, but given the recent species divergence, we do not consider this a plausible explanation.
In the largest published collection of D. mauritiana (345 individuals Aubert & Solignac 1990) only maI and maII haplotypes were found. The chance of not sampling maIII, given the frequency observed in our collections (4/125 individuals), is extremely small (P < 0.001, binomial probability mass function). The fact that despite intensive sampling efforts these two new haplotypes have not been detected raises the possibility that the admixture events may be of very recent origin. Nevertheless, we also note that seasonal fluctuations or population structure may also contribute to the absence of mauIII in previous collections.
Direction of introgression
Our IM analysis supports the introgression of mtDNA from D. mauritiana into D. simulans. However, it has previously been proposed that introgression of mtDNA occurred from D. simulans, possibly from Madagascar or Réunion, to D. mauritiana (Solignac & Monnerot 1986; Aubert & Solignac 1990). This assumption is in part owing to the species distribution (D. mauritiana is an island endemic while D. simulans is cosmopolitan, although absent from Mauritius). In addition, experimental interspecific crosses are highly asymmetrical, e.g. insemination occurs more than 18 times more frequently when D. simulans is the female (Robertson 1983). Furthermore, introgression experiments found that the mtDNA of a single D. simulans female introduced into a vial of D. mauritiana at a frequency of 0.03 quickly became more abundant than the original D. mauritiana mtDNA and reached fixation in almost all populations tested. In contrast, the reciprocal experiment never led to the fixation of the D. mauritiana mtDNA (Aubert & Solignac 1990).
Wolbachia was also suggested to favour this direction of introgression because the D. mauritiana endemic maII is not infected (Ballard 2000b). MaI D. mauritiana individuals are infected with the same strain of Wolbachia (wMa) as siIII D. simulans flies (James & Ballard 2000). A Wolbachia-mediated sweep, because of either CI (although currently wMa does not seem to be able to induce strong CI, it is possible that at the time of introgression this was the case) or a fitness benefit bestowed to the host, could have facilitated mtDNA introgression from D. simulans to D. mauritiana, because hybrid flies with the ‘migrant cytoplasm’ would have an advantage over pure-species individuals. While this might be a reasonable hypothesis in the maI-siIII case, it is very unlikely that the two new introgression events detected in this study were driven by Wolbachia.
The alternative scenario, supported by our data, has also been considered before. Ballard (2000b) suggested that paternal leakage of mtDNA following a cross of a D. mauritiana male with D. simulans females could also explain the maI-siIII distribution. Field data on heteroplasmy (Dean et al. 2003) and experimental paternal leakage (Kondo et al. 1990) show that this might be a plausible explanation. In addition, as mentioned by Ballard (2000b), maI is the most abundant haplotype in D. mauritiana (88% in Solignac et al. 1983 and 82% in our data set, Fig. 2), but siIII is rare in D. simulans (only slightly higher than 33% in Madagascar and Reunion). Combined with the complete lack of variation in the siIII haplotype group (but not in maI), this observation indicates that maI could have originated in D. mauritiana rather than in D. simulans. With these alternative hypotheses in mind, we think that the possibility that D. simulans flies from Madagascar and/or Reunion might have acquired siIII mtDNA following introgressive hybridization with D. mauritiana migrants is realistic. However, the maIII-siII introgressions are very unlikely to have occurred from D. mauritiana to D. simulans because siII has a cosmopolitan distribution and harbours significant variation in some populations (Ballard 2004).
It is still unclear whether conclusions based on data obtained experimentally bear significance in a natural context. D. mauritiana and D. simulans exhibit several differences in their mating behaviour (Robertson 1983), e.g. D. mauritiana females will accept only D. simulans males if there are no conspecific males accessible. Attempts to map loci involved in these premating reproductive isolating mechanism have found a minimum of three to eight QTLs with moderate to large effects in the X, 2nd and 3rd chromosomes (Moehring & Mackay 2004). However, mating behaviour in the laboratory might be very different from that in the natural environment and somehow conditions might be relaxed. For example, in the laboratory, D. melanogaster will mate with D. mauritiana in only 3% of the cases and only when D. melanogaster is the female. Despite this, a D. melanogaster female fertilized by D. mauritiana was detected in a collection expedition to Mauritius (Lachaise et al. 1988).
Mitochondrial vs. nuclear introgression
Mitochondrial introgression has been inferred in a number of species and seems to occur more frequently than introgression of the nuclear. Despite intense speculation, the reasons for this difference were not really understood (Coyne & Orr 2004; Bachtrog et al. 2006) until recent work by Currat et al. (2008). They show that introgression is stronger for genes that experience smaller intraspecific gene flow because they would not ‘dilute’ introgressed genes from the invading population. While our data show a convincing signal of recurrent mtDNA introgression, the conclusions to be drawn from the nuclear data are more speculative. Despite the lack of admixture between individuals of the two species based on 25 microsatellite loci, a detailed locus by locus analysis revealed five loci with unexpectedly low differentiation values. As these markers showed no evidence for reduced levels of polymorphism, these loci might reflect genomic regions permeable to gene flow between the species, rather than regions subject to selection or reduced recombination rate. We also detected several loci with an unexpectedly high FST value. Fifty per cent of these loci were located on the X chromosome, but the interpretation of these extreme divergence values is not clear and may simply reflect an inadequate population model used in our simulations.
Conclusions
In this work, we have identified two new haplotypes in D. mauritiana that cluster with the siII haplotypic group of D. simulans. We have shown that the presence of these two haplotypes is more likely to result from introgression of mtDNA from D. simulans to Drosophila mauritiana than from extant ancestral polymorphism. This finding raises the number of detected mtDNA introgression events in the D. simulans clade to three, which means that at least three independent hybridization events must have occurred in the history of these species. We also provided evidence supporting the symmetrical mitochondrial gene flow between the species, which contradicts empirical data showing strong asymmetry of hybridization in experimental crosses. This might be suggestive of the behaviour of the flies in the laboratory being significantly different from their behaviour in nature.
If hybridization is such a frequent event, why are these species reciprocally monophyletic at the nuclear level? How many loci involved in reproductive isolation are necessary to keep two species apart? What genes are involved? Which regions can overcome the species barrier without any significant impact on the fitness of hybrids? What is the relative importance of selection and drift during this process? Only now, we are starting to have the adequate data to answer these questions. Some genes involved in hybrid male sterility or inviability have finally been identified (Wittbrodt et al. 1989; Ting et al. 1998; Barbash et al. 2003; Presgraves et al. 2003; Brideau et al. 2006; Masly et al. 2006; Tang & Presgraves 2009). One of the major findings is that natural selection plays a major role in shaping the evolution of these loci (Wu & Ting 2004; Tang & Presgraves 2009).
Massively parallel sequencing data have the potential to finally provide the amount of data necessary to answer these questions.
Acknowledgments
We are grateful to the numerous collectors of Drosophila samples used in this study and to Dr. M. Watada at the Ehime University of Japan for providing the collections G and MS. We also thank Alistair P. McGregor for his comments on this manuscript. The work has been supported by a grant (No. P19467-B11) of the Förderung der wissenschaftlichen Forschung (FWF) to CS.
Supporting information
Additional supporting information may be found in the online version of this article.
Fig. S1 Phylogenetic relationship between fog (A), pcl (B) and mav (C) haplotypes of the D. melanogaster subgroup.
Fig. S2 Frequency distribution of the different mitochondrial groups per collection.
Table S1 Collection details and samples sizes used for each analysis
Table S2 List of primers used for amplification and sequencing for mitochondrial and nuclear genes, and microsatellites
Table S3 Expected heterozygosity based on random discarded data sets
Table S4 FST between collections
Table S5 Sample identification labels and haplotypes
Table S6 Parameter estimates of the IM model
Table S7 Percentage of Wolbachia infected and uninfected individuals for a given fly collection
Please note: Wiley-Blackwell are not responsible for the content or functionality of any supporting information supplied by the authors. Any queries (other than missing material) should be directed to the corresponding author for the article.
References
- Aubert J, Solignac M. Experimental Evidence for Mitochondrial DNA Introgression between Drosophila Species. Evolution. 1990;44:1272–1282. doi: 10.1111/j.1558-5646.1990.tb05231.x. [DOI] [PubMed] [Google Scholar]
- Bachtrog D, Agis M, Imhof M, Schlötterer C. Microsatellite variability differs between dinucleotide repeat motifs-evidence from Drosophila melanogaster. Molecular Biology and Evolution. 2000;17:1277–1285. doi: 10.1093/oxfordjournals.molbev.a026411. [DOI] [PubMed] [Google Scholar]
- Bachtrog D, Thornton K, Clark A, Andolfatto P. Extensive introgression of mitochondrial DNA relative to nuclear genes in the Drosophila yakuba species group. Evolution. 2006;60:292–302. [PubMed] [Google Scholar]
- Bahlo M, Griffiths RC. Inference from gene trees in a subdivided population. Theoretical Population Biology. 2000;57:79–95. doi: 10.1006/tpbi.1999.1447. [DOI] [PubMed] [Google Scholar]
- Ballard JW. Comparative genomics of mitochondrial DNA in members of the Drosophila melanogaster subgroup. Journal of Molecular Evolution. 2000a;51:48–63. doi: 10.1007/s002390010066. [DOI] [PubMed] [Google Scholar]
- Ballard JW. When one is not enough: introgression of mitochondrial DNA in Drosophila. Molecular Biology and Evolution. 2000b;17:1126–1130. doi: 10.1093/oxfordjournals.molbev.a026394. [DOI] [PubMed] [Google Scholar]
- Ballard JW. Sequential evolution of a symbiont inferred from the host: Wolbachia and Drosophila simulans. Molecular Biology and Evolution. 2004;21:428–442. doi: 10.1093/molbev/msh028. [DOI] [PubMed] [Google Scholar]
- Barbash DA, Siino DF, Tarone AM, Roote J. A rapidly evolving MYB-related protein causes species isolation in Drosophila. Proceedings of the National Academy of Sciences of the United States of America. 2003;100:5302–5307. doi: 10.1073/pnas.0836927100. [DOI] [PMC free article] [PubMed] [Google Scholar]
- Bowcock A, Ruiz-Linares A, Tomfohrde J, et al. High resolution human evolutionary trees with polymorphic microsatellites. Nature. 1994;368:455–457. doi: 10.1038/368455a0. [DOI] [PubMed] [Google Scholar]
- Brideau NJ, Flores HA, Wang J, et al. Two Dobzhansky-Muller genes interact to cause hybrid lethality in Drosophila. Science. 2006;314:1292–1295. doi: 10.1126/science.1133953. [DOI] [PubMed] [Google Scholar]
- Caccone A, Amato GD, Powell JR. Rates and patterns of scnDNA and mtDNA divergence within the Drosophila melanogaster subgroup. Genetics. 1988;118:671–683. doi: 10.1093/genetics/118.4.671. [DOI] [PMC free article] [PubMed] [Google Scholar]
- Caccone A, Moriyama EN, Gleason JM, Nigro L, Powell JR. A molecular phylogeny for the Drosophila melanogaster subgroup and the problem of polymorphism data. Molecular Biology and Evolution. 1996;13:1224–1232. doi: 10.1093/oxfordjournals.molbev.a025688. [DOI] [PubMed] [Google Scholar]
- Cattani MV, Presgraves DC. Genetics and lineage-specific evolution of a lethal hybrid incompatibility between Drosophila mauritiana and its sibling species. Genetics. 2009;181:1545–1555. doi: 10.1534/genetics.108.098392. [DOI] [PMC free article] [PubMed] [Google Scholar]
- Cobb M, Burnet B, Connolly K. Sexual isolation and courtship behavior in Drosophila simulans, D. mauritiana, and their interspecific hybrids. Behavior Genetics. 1988;18:211–225. doi: 10.1007/BF01067843. [DOI] [PubMed] [Google Scholar]
- Corander J, Martinen P. Bayesian identification of admixture events using multilocus molecular markers. Molecular Ecology. 2006;10:2833–2843. doi: 10.1111/j.1365-294X.2006.02994.x. [DOI] [PubMed] [Google Scholar]
- Cowling DE, Burnet B. Courtship Songs and Genetic Control of Their Acoustic Characteristics in Sibling Species of the Drosophila melanogaster Subgroup. Animal Behaviour. 1981;29:924–935. [Google Scholar]
- Coyne JA, Berry A. Effects of the fourth chromosome on the sterility of hybrids between Drosophila simulans and its relatives. Journal of Heredity. 1994;85:224–227. doi: 10.1093/oxfordjournals.jhered.a111440. [DOI] [PubMed] [Google Scholar]
- Coyne JA, Charlesworth B. Location of an X-linked factor causing sterility in male hybrids of Drosophila simulans and D. mauritiana. Heredity. 1986;57(Pt 2):243–246. doi: 10.1038/hdy.1986.114. [DOI] [PubMed] [Google Scholar]
- Coyne JA, Orr HA. Speciation. Sunderland, MA: Sinauer Associates; 2004. [Google Scholar]
- Currat M, Ruedi M, Petit RJ, Excoffier L. The hidden side of invasions: massive introgression by local genes. Evolution. 2008;62:1908–1920. doi: 10.1111/j.1558-5646.2008.00413.x. [DOI] [PubMed] [Google Scholar]
- Darwin C. On the Origin of Species by Means of Natural Selection. London: J. Murray; 1859. [Google Scholar]
- Dean MD, Ballard KJ, Glass A, Ballard JW. Influence of two Wolbachia strains on population structure of East African Drosophila simulans. Genetics. 2003;165:1959–1969. doi: 10.1093/genetics/165.4.1959. [DOI] [PMC free article] [PubMed] [Google Scholar]
- Dieringer D, Schlötterer C. Microsatellite analyser (MSA): a platform independent analysis tool for large microsatellite data sets. Molecular Ecology Notes. 2003;3:167–169. [Google Scholar]
- Felsenstein J. PHYLIP – Phylogeny Inference Package (Version 3.2) Cladistics. 1989;5:164–166. [Google Scholar]
- Harr B, Schlötterer C. Patterns of microsatellite variability in the Drosophila melanogaster complex. Genetica. 2004;120:71–77. doi: 10.1023/b:gene.0000017631.00820.49. [DOI] [PubMed] [Google Scholar]
- Harr B, Weiss S, David JR, Brem G, Schlötterer C. A microsatellite-based multilocus phylogeny of the Drosophila melanogaster species complex. Current Biology. 1998;8:1183–1186. doi: 10.1016/s0960-9822(07)00490-3. [DOI] [PubMed] [Google Scholar]
- Hedrick PW. A standardized genetic differentiation measure. Evolution. 2005;59:1633–1638. [PubMed] [Google Scholar]
- Hey J, Kliman RM. Population genetics and phylogenetics of DNA sequence variation at multiple loci within the Drosophila melanogaster species complex. Molecular Biology and Evolution. 1993;10:804–822. doi: 10.1093/oxfordjournals.molbev.a040044. [DOI] [PubMed] [Google Scholar]
- Hey J, Nielsen R. Multilocus methods for estimating populations sizes, migration rates and divergence time, with applications to the divergence of Drosphila pseudoobscura and D. persimilis. Genetics. 2004;167:747–760. doi: 10.1534/genetics.103.024182. [DOI] [PMC free article] [PubMed] [Google Scholar]
- Hilton H, Kliman RM, Hey J. Using Hitchhiking Genes to Study Adaptation and Divergence During Speciation Within the Drosophila melanogaster Species Complex. Evolution. 1994;48:1900–1913. doi: 10.1111/j.1558-5646.1994.tb02222.x. [DOI] [PubMed] [Google Scholar]
- Hudson RR. Generating samples under a Wright-Fisher neutral model of genetic variation. Bioinformatics. 2002;18:337–338. doi: 10.1093/bioinformatics/18.2.337. [DOI] [PubMed] [Google Scholar]
- Hurst GD, Jiggins FM. Problems with mitochondrial DNA as a marker in population, phylogeographic and phylogenetic studies: the effects of inherited symbionts. Proceedings: Biological sciences/The Royal Society. 2005;272:1525–1534. doi: 10.1098/rspb.2005.3056. [DOI] [PMC free article] [PubMed] [Google Scholar]
- James AC, Ballard JW. Expression of cytoplasmic incompatibility in Drosophila simulans and its impact on infection frequencies and distribution of Wolbachia pipientis. Evolution. 2000;54:1661–1672. doi: 10.1111/j.0014-3820.2000.tb00710.x. [DOI] [PubMed] [Google Scholar]
- Kliman RM, Hey J. DNA sequence variation at the period locus within and among species of the Drosophila melanogaster complex. Genetics. 1993;133:375–387. doi: 10.1093/genetics/133.2.375. [DOI] [PMC free article] [PubMed] [Google Scholar]
- Kliman RM, Andolfatto P, Coyne JA, et al. The population genetics of the origin and divergence of the Drosophila simulans complex species. Genetics. 2000;156:1913–1931. doi: 10.1093/genetics/156.4.1913. [DOI] [PMC free article] [PubMed] [Google Scholar]
- Kondo R, Satta Y, Matsuura ET, et al. Incomplete maternal transmission of mitochondrial DNA in Drosophila. Genetics. 1990;126:657–663. doi: 10.1093/genetics/126.3.657. [DOI] [PMC free article] [PubMed] [Google Scholar]
- Lachaise D, Cariou ML, David JR, et al. Historical Biogeography of the Drosophila melanogaster Species Subgroup. Evolutionary Biology. 1988;22:159–225. [Google Scholar]
- Li WH. Molecular Evolution. Sunderland, MA: Sinauer; 1997. [Google Scholar]
- Librado P, Rozas J. DnaSP v5: a software for comprehensive analysis of DNA polymorphism data. Bioinformatics (Oxford, England) 2009;25:1451–1452. doi: 10.1093/bioinformatics/btp187. [DOI] [PubMed] [Google Scholar]
- Maddison WP, Maddison DR. MacClade 4: Analysis of Phylogeny and Character Evolution. Sunderland, MA: Sinauer; 2000. [DOI] [PubMed] [Google Scholar]
- Mallet J. Species concepts. In: Fox CW, Wolf JB, editors. Evolutionary Genetics-Concepts and Case Studies. New York: Oxford University Press; 2006. pp. 367–373. [Google Scholar]
- Masly JP, Jones CD, Noor MAF, Locke J, Orr HA. Gene transposition as a cause of hybrid sterility in Drosophila. Science. 2006;313:1448–1450. doi: 10.1126/science.1128721. [DOI] [PubMed] [Google Scholar]
- McDermott SR, Kliman RM. Estimation of isolation times of the island species in the Drosophila simulans complex from multilocus DNA sequence data. PLoS ONE. 2008;3:e2442. doi: 10.1371/journal.pone.0002442. [DOI] [PMC free article] [PubMed] [Google Scholar]
- Miller SA, Dykes DD, Polesky HF. A simple salting out procedure for extracting DNA from human nucleated cells. Nucleic Acids Research. 1988;16:1215. doi: 10.1093/nar/16.3.1215. [DOI] [PMC free article] [PubMed] [Google Scholar]
- Moehring AJ, Mackay TF. The quantitative genetic basis of male mating behavior in Drosophila melanogaster. Genetics. 2004;167:1249–1263. doi: 10.1534/genetics.103.024372. [DOI] [PMC free article] [PubMed] [Google Scholar]
- Noor MA, Kliman RM. Variability on the dot chromosome in the Drosophila simulans clade. Genetica. 2003;118:51–58. doi: 10.1023/a:1022983023900. [DOI] [PubMed] [Google Scholar]
- Orgogozo V, Stern DL. How different are recently diverged species?: more than 150 phenotypic differences have been reported for the D. melanogaster species subgroup. Fly. 2009;3:117. doi: 10.4161/fly.8836. [DOI] [PubMed] [Google Scholar]
- Page R. TREEVIEW: an application to display phylogenetic trees on personal computers. Computer Applications in the Biosciences. 1996;12:357–358. doi: 10.1093/bioinformatics/12.4.357. [DOI] [PubMed] [Google Scholar]
- Pidugu SR, Schlotterer C. ms2ms.pl: a PERL script for generating microsatellite data. Molecular Ecology Notes. 2006;6:580–581. [Google Scholar]
- Posada D, Crandall K. MODELTEST: testing the model of DNA substitution. Bioinformatics. 1998;14:817–818. doi: 10.1093/bioinformatics/14.9.817. [DOI] [PubMed] [Google Scholar]
- Presgraves DC, Balagopalan L, Abmayr SM, Orr HA. Adaptive evolution drives divergence of a hybrid inviability gene between two species of Drosophila. Nature. 2003;423:715–719. doi: 10.1038/nature01679. [DOI] [PubMed] [Google Scholar]
- Robertson HM. Mating behaviour and the evolution of D. mauritiana. Evolution. 1983;37:1283–1293. doi: 10.1111/j.1558-5646.1983.tb00244.x. [DOI] [PubMed] [Google Scholar]
- Satta Y, Takahata N. Evolution of Drosophila mitochondrial DNA and the history of the melanogaster subgroup. Proceedings of the National Academy of Sciences of the United States of America. 1990;87:9558–9562. doi: 10.1073/pnas.87.24.9558. [DOI] [PMC free article] [PubMed] [Google Scholar]
- Schlötterer C, Ritter R, Harr B, Brem G. High mutation rate of a long microsatellite allele in Drosophila melanogaster provides evidence for allele-specific mutation rates. Molecular Biology and Evolution. 1998;15:1269–1274. doi: 10.1093/oxfordjournals.molbev.a025855. [DOI] [PubMed] [Google Scholar]
- Schug MD, Mackay TF, Aquadro CF. Low mutation rates of microsatellite loci in Drosophila melanogaster. Nature Genetics. 1997;15:99–102. doi: 10.1038/ng0197-99. [DOI] [PubMed] [Google Scholar]
- Sharp PM, Li WH. On the rate of DNA sequence evolution in Drosophila. Journal of Molecular Evolution. 1989;28:398–402. doi: 10.1007/BF02603075. [DOI] [PubMed] [Google Scholar]
- Singh RS. Population genetics and evolution of species related to Drosophila melanogaster. Annual Review of Genetics. 1989;23:425–453. doi: 10.1146/annurev.ge.23.120189.002233. [DOI] [PubMed] [Google Scholar]
- Solignac M. Mitochondrial DNA in the Drosophila melanogaster complex. Genetica. 2004;120:41–50. doi: 10.1023/b:gene.0000017628.52056.97. [DOI] [PubMed] [Google Scholar]
- Solignac M, Monnerot M. Race Formation, Speciation, and Introgression within Drosophila simulans, Drosophila mauritiana, and Drosophila sechellia Inferred from Mitochondrial DNA Analysis. Evolution. 1986;40:531–539. doi: 10.1111/j.1558-5646.1986.tb00505.x. [DOI] [PubMed] [Google Scholar]
- Solignac M, Monnerot M, Mounolou JC. Mitochondrial DNA heteroplasmy in Drosophila mauritiana. Proceedings of the National Academy of Sciences of the United States of America. 1983;80:6942–6946. doi: 10.1073/pnas.80.22.6942. [DOI] [PMC free article] [PubMed] [Google Scholar]
- Solignac M, Monnerot M, Mounolou JC. Mitochondrial DNA evolution in the melanogaster species subgroup of Drosophila. Journal of Molecular Evolution. 1986;23:31–40. doi: 10.1007/BF02100996. [DOI] [PubMed] [Google Scholar]
- Stephens M, Donnelly P. A comparison of bayesian methods for haplotype reconstruction from population genotype data. American Journal of Human Genetics. 2003;73:1162–1169. doi: 10.1086/379378. [DOI] [PMC free article] [PubMed] [Google Scholar]
- Stephens M, Smith NJ, Donnelly P. A new statistical method for haplotype reconstruction from population data. American Journal of Human Genetics. 2001;68:978–989. doi: 10.1086/319501. [DOI] [PMC free article] [PubMed] [Google Scholar]
- Swofford DL. PAUP*. Phylogenetic analysis using parsimony (*and other methods), version 4. Sunderland, MA: Sinauer; 1998. [Google Scholar]
- Tang S, Presgraves DC. Evolution of the Drosophila nuclear pore complex results in multiple hybrid incompatibilities. Science. 2009;323:779–782. doi: 10.1126/science.1169123. [DOI] [PMC free article] [PubMed] [Google Scholar]
- Tao Y, Chen S, Hartl DL, Laurie CC. Genetic dissection of hybrid incompatibilities between Drosophila simulans and D. mauritiana I. Differential accumulation of hybrid male sterility effects on the X and autosomes. Genetics. 2003a;164:1383–1397. doi: 10.1093/genetics/164.4.1383. [DOI] [PMC free article] [PubMed] [Google Scholar]
- Tao Y, Zeng ZB, Li J, Hartl DL, Laurie CC. Genetic dissection of hybrid incompatibilities between Drosophila simulans and D. mauritiana II. Mapping hybrid male sterility loci on the third chromosome. Genetics. 2003b;164:1399–1418. doi: 10.1093/genetics/164.4.1399. [DOI] [PMC free article] [PubMed] [Google Scholar]
- Ting CT, Tsaur SC, Wu ML, Wu CI. A rapidly evolving homeobox at the site of a hybrid sterility gene. Science. 1998;282:1501–1504. doi: 10.1126/science.282.5393.1501. [DOI] [PubMed] [Google Scholar]
- Ting CT, Tsaur SC, Wu CI. The phylogeny of closely related species as revealed by the genealogy of a speciation gene, Odysseus. Proceedings of the National Academy of Sciences of the United States of America. 2000;97:5313–5316. doi: 10.1073/pnas.090541597. [DOI] [PMC free article] [PubMed] [Google Scholar]
- True JR, Mercer JM, Laurie CC. Differences in crossover frequency and distribution among three sibling species of Drosophila. Genetics. 1996a;142:507–523. doi: 10.1093/genetics/142.2.507. [DOI] [PMC free article] [PubMed] [Google Scholar]
- True JR, Weir BS, Laurie CC. A genome-wide survey of hybrid incompatibility factors by the introgression of marked segments of Drosophila mauritiana chromosomes into Drosophila simulans. Genetics. 1996b;142:819–837. doi: 10.1093/genetics/142.3.819. [DOI] [PMC free article] [PubMed] [Google Scholar]
- Wittbrodt J, Adam D, Malitschek B, et al. Novel putative receptor tyrosine kinase encoded by the melanoma-inducing Tu locus in Xiphophorus. Nature. 1989;341:415–421. doi: 10.1038/341415a0. [DOI] [PubMed] [Google Scholar]
- Wu CI, Ting CT. Genes and speciation. Nature Reviews: Genetics. 2004;5:114–122. doi: 10.1038/nrg1269. [DOI] [PubMed] [Google Scholar]
Associated Data
This section collects any data citations, data availability statements, or supplementary materials included in this article.