

Abstract
There is clear evidence of an interleaflet coupling in model lipid/cholesterol membranes exhibiting liquid-liquid phase separation. The strength of this coupling is quantified by the mismatch free energy, γ. We calculate it using a molecular mean-field model of a phase-separated lipid/cholesterol bilayer and obtain values that increase as the concentration of saturated lipids in the coexisting phases is increased. These values lie in the range 0.01–0.03 kBT/nm2. We clarify the relationship between the interleaflet coupling and the extent of interleaflet alignment of liquid domains by analyzing a statistical mechanical model of coupled fluctuating domain interfaces. The model is solved exactly using the correspondence between statistical mechanics and quantum mechanics, yielding an expression for the characteristic size of fluctuations out of domain registry. This length scale depends only weakly on the strength of the interleaflet coupling and inevitably is only of the order of nanometers, which explains the experimental result that fluctuations out of domain registry have not been observed by optical microscopy.
Introduction
The hypothesis that the plasma membrane is not homogeneous, but rather is characterized, inter alia, by agglomerations enriched in cholesterol and saturated lipids, like sphingomyelin, which float like rafts in a sea enriched in unsaturated lipids, has been an enormously stimulating one (1). The great interest is due to the supposition that because of the different physical properties of the raft and nonraft regions, most membrane proteins would preferably partition into one or the other (2). By this means, rafts could regulate biological processes by enhancing interactions between colocalized proteins and suppressing interactions between proteins that prefer different environments.
To shed light on this hypothesis, numerous studies have been performed on model membranes (3) most often consisting of only three components: cholesterol, a high-melting-point lipid, usually saturated, and a low-melting-point lipid, usually unsaturated. Such ternary mixtures exhibit at least three phases, two of which are of biological interest: a liquid-ordered (lo) phase that, like the posited raft, is rich in relatively well-ordered saturated lipids and cholesterol, and a liquid-disordered (ld) phase that, like the posited sea, is rich in the more disordered unsaturated lipids.
The connection between lo domains in model membranes and rafts in cell plasma membranes is complicated by the compositional asymmetry of the latter (4). Although liquid-liquid phase separation occurs in model membranes with compositions typical of the extracellular leaflet (5), model membranes with compositions similar to that of the cytoplasmic leaflet display only a single liquid phase (6). These observations imply that raft and nonraft regions differ primarily in their extracellular leaflet compositions. However, among the proteins that are believed to partition preferentially into rafts are several that are anchored by lipid chains to the cytoplasmic leaflet of the plasma membrane (7). The two leaflets must therefore be coupled by some means. A transmembrane protein that partitions preferentially into rafts could, for example, give rise to such a coupling. However, experiments on model membranes have revealed two related effects of interleaflet coupling in the absence of transmembrane proteins. First, experiments on compositionally asymmetric membranes (8–11) have shown that the presence or absence of liquid-liquid phase coexistence depends jointly on the compositions of the two leaflets. Second, in symmetric model membranes without proteins, phase domains in each leaflet are well aligned (5,12) so that there are no optically visible overhangs or mismatches, that is, regions where one leaflet has the composition of the lo phase while the apposing leaflet has that of the ld phase. We refer to this phenomenon of alignment as that of domain registry. These facts indicate a coupling between the compositional order parameters in each of the two leaflets, in the sense that the free energy of the bilayer depends upon products of these order parameters. This has important effects on the thermodynamics of asymmetric bilayers, which can exhibit three-phase coexistence, as has been observed experimentally (11). On the theoretical side, the thermodynamics of mixed bilayers with coupled leaflets has been explored phenomenologically (13–17).
The magnitude of the interleaflet coupling can be quantified as the free-energy cost of creating a unit area of mismatch. This is a region in which the two coexisting phases are replaced by an area in which one leaflet has the composition it would have in the lo phase and the other the composition it would have in the ld phase (Fig. 1). Following May (18), we refer to this quantity as the mismatch free energy and denote it by γ.
Figure 1.
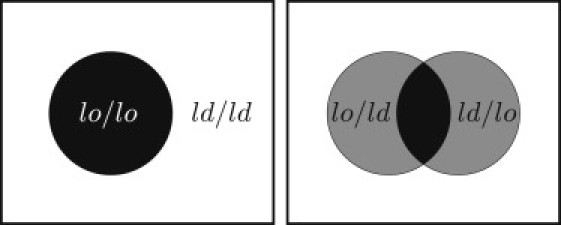
(Left) Phase separation in a symmetric lipid bilayer in which the domains in the two leaflets are aligned. (Right) If the domains are displaced out of alignment, mismatch regions of asymmetric composition (gray) are created at the expense of the areas of the symmetric coexisting phases.
In this article we give, in Section 2, an expression for the mismatch free energy in terms of the free energies of the symmetric coexisting phases as well as that of the asymmetric mismatched state. In Section 3, we calculate γ using a molecular mean-field theory that describes liquid-liquid phase separation in a ternary mixed membrane consisting of saturated lipids, unsaturated lipids, and cholesterol. We arrive at values of γ that are on the order of 0.01–0.03 kBT/nm2 at T = 17°C; these values increase as the concentration of saturated lipids increases. They are roughly an order of magnitude smaller than those obtained from heuristic estimates (12,18) or from the estimate extracted by Risselada and Marrink (19) from coarse-grained molecular dynamics simulations of liquid-liquid coexistence in a lipid/cholesterol bilayer; theirs seems to have been the first attempt to calculate γ in a systematic manner.
Intuitively, it is clear that the mismatch free energy γ tends to maintain the interleaflet alignment of domains in phase-separated bilayers. However, it is not immediately obvious how the value of γ is related to the extent of interleaflet registry. If one considers the rigid relative displacement of the two leaves of a region of one phase embedded in the other (Fig. 1), then the change in free energy is seen to be γA, where A is the area of the mismatch region (Fig. 1, gray region). This area of mismatch, arising as it does from the fluctuations of the interface shown in Fig. 2, clearly scales with the nominal length of the interface. Thus, the free energy of the mismatch also scales with the length of interface and therefore contributes to the interfacial line tension. The ratio of the area of overlap to the length of the interface defines a characteristic width of the overlap region, which we denote as ξ⊥, and which is also shown in Fig. 2. In Section 4, we present a statistical mechanical model of coupled interfaces in which the fluctuations of these interfaces are governed by their line tensions as well as the interleaflet coupling. The model is solved exactly using the mathematical correspondence between statistical mechanics in two dimensions and quantum mechanics in one, resulting in expressions for the characteristic separation, ξ⊥, between the interfaces, as well as the line tension of the lo/ld interface. We find that ξ⊥ depends only weakly on the strength of the interleaflet coupling and inevitably takes on a value on the order of nanometers. This explains why fluctuations out of interleaflet domain registry are never observed under optical microscopy, which can only access the micron length scale.
Figure 2.
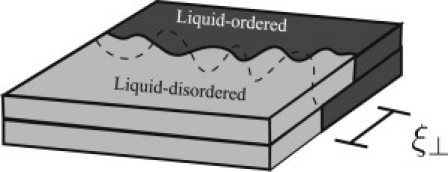
Interleaflet domain registry in a phase-separated symmetric lipid bilayer. The boundary between the lo and ld phase regions is shown as a solid line in the upper leaflet and as a dashed line in the lower leaflet. The characteristic width of the mismatch region is denoted as ξ⊥.
In the conclusion of the article, we discuss our results in relation to previous work on the nature and magnitude of the interleaflet coupling, focusing in particular on the estimate of γ given by Risselada and Marrink (19). We also suggest extensions of our work, not only to further elaborate on the structure of liquid domain boundaries in lipid bilayers, but also to assess the thermodynamic implications of compositional asymmetry in biological membranes.
The Mismatch Free Energy
The mismatch free energy γ is the free-energy penalty for creating an asymmetric mismatch region of unit area at the expense of areas of the coexisting symmetric phases. More precisely, it is the free-energy difference between the initial state and the final state (Fig. 3, upper and lower, respectively) normalized by the area of the asymmetric bilayer in the final state. The two states have the same number of molecules and average composition. Depending on whether the bilayer is taken to have a fixed area or to be tensionless, the appropriate thermodynamic potential is respectively either the Helmholtz or a modified Gibbs (M. Uline, M. Schick, and I. Szleifer, unpublished) free energy. Since these functions differ by a term proportional to the surface tension, they are numerically equal.
Figure 3.
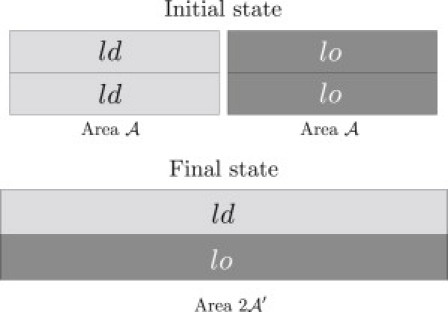
(Top) Initial configuration of the mismatch process. There are equal areas, A, of symmetric ld and lo bilayer. (Bottom) Final configuration of the mismatch process. The upper leaflet has the same composition as it has in the the ld phase, whereas the lower leaflet has the composition as it has in the lo phase. The total area is .
In the initial state (Fig. 3, upper), a bilayer of identical leaflets exhibits coexistence between equal areas, A, of the lo and ld phases. The area A is taken to be large enough to justify the neglect of contributions from the boundaries of these regions. The free energy of the initial state is
| (1) |
where fld and flo are the bulk free energies/unit area of the ld and lo phases, respectively.
We now interchange the upper leaflet to the right of the interface with the lower leaflet to the left of it to obtain a mismatch region of area (Fig. 3, lower). Finally, we let the system relax to a new area, The Helmholtz free energy is
| (2) |
where denotes the free energy/unit area of the asymmetric bilayer whose leaflets have the compositions of the original coexisting phases. We can now define the mismatch free energy/unit area, γ, as
| (3) |
| (4) |
When , this definition coincides with that given by May (18). In general, however, the lipids in the mismatch state (Fig. 3, lower) do not have exactly the same areal density as they did in the symmetric bilayers (Fig. 3, upper). Indeed, this change in area is a manifestation of the interleaflet coupling itself, which can be expected to influence the configurations of lipid molecules and therefore their preferred areal density. In performing the free-energy calculations described in the next section, we have found that the areal densities adopted by tensionless asymmetric bilayers are such that and A are equal to within one part per thousand. This small change in area is not negligible, however, since we also find that the first and second terms in Eq. 4 for γ cancel each other to within less than one part per thousand. Therefore, if one is to allow for the possibility of small changes in the areas of the leaflets during the mismatch process, it is quite important also to include the factor in calculating the interleaflet coupling from Eq. 4. One may also calculate γ under the assumption that the system is constrained so that .
Calculation of γ Based on Molecular Theory
As seen in Eq. 4, the mismatch free energy/unit area can be obtained from three free energies per unit area: those of the coexisting lo and ld phases, flo and fld, and that of a mismatch region, . We have calculated these quantities using a theoretical model (21) that treats the hydrocarbon tails of the lipids within Flory's rotational isomeric states description (22) while also taking into account the dense packing of the molecules in the interior of the bilayer, as well as the orientation-dependent interactions that drive phase separation. The structure and interactions of the hydrophobic tails are therefore treated at the microscopic level, whereas all interactions involving solvent or lipid headgroups are encapsulated in a phenomenological term that gives rise to an effective surface tension (23).
Within self-consistent field theory, the model yields the phase diagram shown in Fig. 4 for the system of cholesterol, dipalmitoylphosphatidylcholine, and dioleoylphosphatidylcholine at a temperature of T = 17°C. It exhibits both lo and ld phases, as well as a gel phase. The model is described in the Supporting Material; readers interested in more details can refer to the literature (2,21,24). We have calculated the necessary free energies/unit area for the four tie lines labeled A–D in Fig. 4. The first connects the lo and ld states that coexist with the gel phase, the last the lo and ld phases in the binary system of cholesterol and unsaturated lipid (25). From these free energies we obtain the corresponding values of the mismatch free energy, γ.
Figure 4.
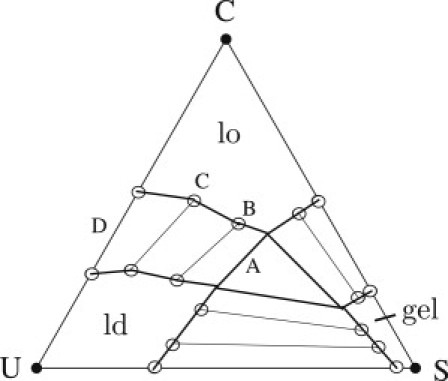
Phase diagram of the model bilayer consisting of identical leaves of cholesterol (C), dipalmitoylphophatidylcholine (S), and dioleoylphosphatidylcholine (U) at a temperature of T = 17°C. Four tie lines between lo and ld phases are labeled A–D.
The values of γ we obtain for these tie lines, along with the compositions of their coexisting phases, are given in Table 1. They are of the order of 0.01 , roughly an order of magnitude smaller than several previous estimates (12,18,19). The interleaflet coupling is small in the sense that the two terms of Eq. 4 largely cancel each other; each term is more than three orders of magnitude larger than their difference. It is noteworthy that the mismatch free energy decreases as the amount of saturated lipids is decreased. This may indicate that the saturated lipid chains, which adopt highly extended, ordered configurations, contribute most to the interdigitation at the bilayer midplane and thus also to the mismatch free energy.
Table 1.
Compositions and mismatch free energies of four tie lines (T = 17°C)
| Tie line |
ld |
lo |
γ (nm2) | ||||
|---|---|---|---|---|---|---|---|
| s | c | u | s | c | u | ||
| A | 0.352 | 0.2449 | 0.4029 | 0.4062 | 0.4084 | 0.1853 | 0.032 |
| B | 0.2353 | 0.2669 | 0.4976 | 0.3143 | 0.4411 | 0.2446 | 0.025 |
| C | 0.0982 | 0.2995 | 0.6022 | 0.1605 | 0.5109 | 0.3285 | 0.016 |
| D | 0.000 | 0.286 | 0.714 | 0.000 | 0.535 | 0.465 | 0.013 |
An advantage of the molecular mean field approach we have taken is that each of the free energies flo, fld, and used to calculate the mismatch free energy can easily be decomposed into its various energetic and entropic parts, revealing their contributions to γ. This breakdown is shown in Table 2 for tie line A in particular. The configurational entropy of the lipid chains makes a significant negative contribution to γ, meaning that on average, a lipid chain gains entropy in the mismatch process depicted in Fig. 3. The net negative contribution to γ made by the configurational entropies of the lipid chains is offset by positive contributions from gauche bond energies, orientational interactions, and the effective surface interaction used in the model to incorporate the effects of the lipid headgroups. Thus, no single contribution to the free energy is wholly responsible for the mismatch free energy γ. Any attempt at describing a simple mechanism for the interleaflet coupling is further complicated if we now consider the mismatch process to occur under slightly different conditions, namely, if we assume that the asymmetric bilayer shown at the bottom of Fig. 3 maintains the same area, , as the coexisting regions shown at the top of the figure. We then obtain a mismatch free energy that we denote since it describes a process occurring at fixed area. It is only very slightly larger than γ. It is surprising, however, that the contributions to of the various free energy components have signs opposite to the corresponding contributions to γ. The fact that a small change in the conditions under which the mismatch process takes place has such a drastic effect on these contributions, though leading to essentially the same total mismatch free energy, strongly suggests that interleaflet coupling is not driven by a single property, such as configurational entropy or gauche bond energy, but rather by the complex interplay between these properties. Furthermore, irrespective of whether the mismatch process takes place at constant area or constant tension, there is a high degree of cancellation between different terms contributing to the mismatch free energy, reflecting the compromise that occurs between the various energetic and entropic contributions as the bilayer seeks to minimize its free energy.
Table 2.
Contributions to γ of tie line A (T = 17°C)
| Free energy term | Contribution to γ | Contributions to |
|---|---|---|
| Gauche bond energy | 0.031 | −0.027 |
| Configurational entropy | −0.113 | 0.104 |
| Ideal gas terms | −0.008 | 0.000 |
| Orientational interactions | 0.072 | −0.045 |
| Surface energy | 0.050 | 0.000 |
| Total coupling | 0.032 | 0.033 |
Thus far, we have considered the free energy change during a mismatch process in which the final state is an asymmetric bilayer whose leaflets have exactly the same composition as the two coexisting phases in the initial state. Motivated by the fact that cholesterol is able to flip-flop between the leaflets of a bilayer on a relatively rapid timescale (19,26,27) we have also considered a situation where, in the final asymmetric state of the mismatch process, cholesterol molecules can move from one leaflet to another in such a way as to minimize the free energy. This leads to a lower value of and hence of the mismatch free energy γ. However, we have found that allowing cholesterol flip-flop lowers γ by <1% (data not shown). This is a reflection of the small magnitude of the interleaflet coupling. The chemical potential of cholesterol does not change very much as it is moved from a symmetric bilayer to an asymmetric one during the mismatch process. Consequently, the chemical potentials in the two leaflets of the asymmetric bilayer are very nearly equal, providing little thermodynamic incentive for cholesterol to move from one leaflet to the other.
Statistical Model of Coupled Fluctuating Interfaces
We now address the observation that in experiments on phase-separated model membranes, the boundary between lo and ld regions is always observed to be in alignment between the two leaflets. This observation implies that the characteristic size of mismatch fluctuations (Fig. 2, ξ⊥) is below the optical resolution of the experiments. These fluctuations are governed not only by the free-energy penalty of creating an overlap area of asymmetric composition (given by γ), but also by the line tension between the coexisting phases, since in the process of forming an overlap region, the phase boundaries within the two leaflets must be deformed. What is needed, therefore, is an analysis of the fluctuating phase boundaries in both leaflets, similar to that used to extract line tensions in flicker spectroscopy experiments (28,29) but taking into account the effect of the interleaflet coupling.
The interface between coexisting lo and ld regions extends through the thickness of the bilayer (see Fig. 2). If we take the average position of this interface to be the x axis, then we can characterize the location of the interface in the upper leaflet by y1(x) and the location of the interface in the lower leaflet by y2(x). The configuration of the interface is specified by the two functions y1(x) and y2(x) defined on a segment in the range 0 ≤ x ≤ L, which we assume to be single-valued, meaning that the boundaries do not double back upon themselves. A typical configuration is shown in Fig. 5.
Figure 5.
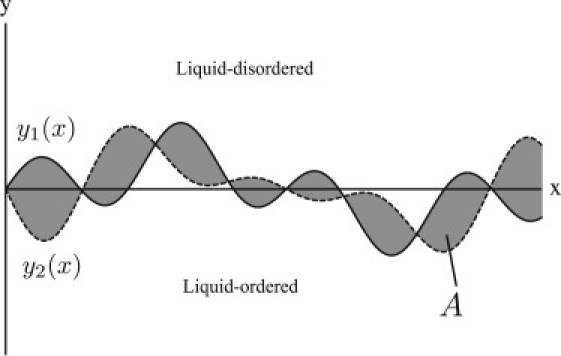
Typical configuration of a segment of the interface between the lo and ld phases (see also Fig. 2. The interface boundaries in the upper and lower leaflets are described by the functions and , respectively. The area of mismatch where the two leaflets have different compositions is shaded.
The statistical weights of the possible configurations of the interfaces are determined, via the Boltzmann distribution, by an effective Hamiltonian that includes two free energies: that associated with the linear interfaces themselves, and that associated with the mismatch area between the interfaces. The former is composed of two terms proportional to the arc lengths of y1(x) and y2(x), and can be written
| (5) |
where we have assumed that the fluctuations in the interface are sufficiently small to justify the approximation of the second line. The last term in Eq. 5 is the line tension of a perfectly linear interface without regions of mismatch. The parameter τ0 in this model, which we refer to as the bare line tension, is similar to a line tension between two coexisting phases, except that it represents the free-energy penalty/unit length of straight interface within one leaflet only. Its relationship with the experimentally measured line tension, τ, between the lo and ld phases will be clarified below. The second contribution to the energy of a configuration of the interfaces is that due to the area of mismatch enclosed between them (Fig. 5, shaded region):
| (6) |
The total energy of a particular configuration of the interfaces is then
| (7) |
| (8) |
The partition function of the system, Z, is given by the functional integral
| (9) |
from which we can calculate the free energy, . Note from Eq. 8 that the energy of any configuration of the interface is unchanged by the displacement of the interface by an arbitrary amount, y0 (i.e., and ). Hence, the areas of the two coexisting phases are not conserved, and the partition function Z of Eq. 9 is that of the grand canonical ensemble.
Before proceeding to the analysis of this model, it is important to keep in mind its scope. In treating the interfaces bounding the mismatch region as sharp lines, we have assumed that the characteristic size of this mismatch region is much larger than the widths of these interfaces, given by the compositional correlation length within a given leaflet. The necessity of this assumption provides a self-consistency criterion for the model.
We now analyze the statistical model defined above by taking advantage of the well-known connection between statistical mechanics in two dimensions and quantum mechanics in one (30,31). If the spatial coordinate x is relabeled as an imaginary time, and β is relabeled as , then the integrand in Eq. 9 becomes where
| (10) |
is seen to be the action, i.e., the integral over time of the difference between kinetic and potential energies, of two particles of mass τ0 and positions y1 and y2 that interact via an attractive linear potential The equivalent of the partition function of Eq. 9 is the quantum mechanical propagator of the two particles from time 0 to time L. Such propagators form the basis of Feynman's formulation of quantum mechanics (32), which is completely equivalent to the Schrödinger formulation and the Schrödinger equation. The nontrivial part of this equation in the center-of-mass frame of the two particles is
| (11) |
where and the reduced mass, μ, is given by
| (12) |
This equation can be solved exactly in terms of Bessel functions of order , or Airy functions, but the essentials are obtained simply. If the characteristic extent of the wavefunction is ℓ, then the energy will, up to unimportant constants, take the form
| (13) |
Minimization with respect to ℓ yields a characteristic length , which corresponds, in the statistical model, to a characteristic distance between the fluctuating interfaces of
| (14) |
Presumably, τ0 is of the order of piconewtons and γ is of the order of piconewtons/nanometer, so that this characteristic length is of the order of nanometers, which immediately explains why mismatch regions would not have been observed by optical microscopy. We note the weak dependence of ξ⊥ on γ, so that even if γ were to be 0.1 pN/nm, 0.01 pN/nm, or 0.001 pN/nm, this conclusion would be unchanged. The only circumstance in which this characteristic width would grow significantly and the domains become less well-correlated is if the system were to approach a critical point due to a change of temperature or composition. Both γ and τ0 would then vanish, causing the correlation length ξ⊥ to diverge. However, in the vicinity of a critical point, our assumption of small deviations from a linear interface would cease to hold.
In the ground state of the quantum system, the kinetic and potential energies are comparable, each being of the order . The exact ground-state energy (33) is well approximated by
| (15) |
As the ground-state energy corresponds to the free energy/unit length of the classical system, we immediately obtain the line tension occurring between the coexisting phases:
| (16) |
| (17) |
The first term in Eq. 17, is equal to plus the contribution from the fluctuations of the center-of-mass of the interface, whereas the second term is the contribution of the fluctuations relative to the center of mass. These relative fluctuations are precisely the ones that bring about the regions of mismatch. Thus, the free energy associated with the phase boundary, the line tension, includes the contribution due to these relative fluctuations, which are governed in part by the interleaflet coupling.
Other quantities of interest can be extracted. One is the parallel correlation length, ξ∥, which gives the distance over which the interfaces remain correlated in the x direction. This is essentially the characteristic distance between crossings of and ; that is, it is the length of a region of mismatch, as opposed to its width, ξ⊥. The length ξ∥ corresponds to the lifetime of the first excited state of the quantum system, the characteristic dimensions of which must be , with E0 given above. From the exact solution (33) and the correspondence with the classical system, one obtains
| (18) |
Note that the parallel and perpendicular correlation lengths, ξ∥ and ξ⊥, which give the characteristic length and width of a mismatch region, are different, but that
| (19) |
as would be expected for the mismatch fluctuation. If a critical point were approached, ξ⊥ and ξ∥ would both diverge inversely with the deviation from the critical temperature, whereas the free energy/unit area would vanish like the square of that difference.
Because the regions of mismatch have a characteristic width, ξ⊥, the average total area of mismatch, A, scales with the projected length L of the interface. This is confirmed by noting that from Eqs. 6, 9, 16, and 17, one obtains
| (20) |
| (21) |
| (22) |
In addition to the average mismatch area above, we derive in the Supporting Material the probability distribution function of overlap areas.
Discussion
We have considered the interleaflet coupling in lipid bilayers exhibiting liquid-liquid phase separation. A thermodynamic measure of the strength of this coupling is given by the mismatch free energy, γ (18), which we have calculated using a molecular mean-field description (21) of a phase-separated symmetric bilayer composed of a mixture of saturated and unsaturated lipids as well as cholesterol. Different coexistence tie lines yield different values of γ. Tie lines with larger concentrations of saturated lipids have larger values of γ; these values all lie in the range 0.01–0.03 kBT/nm2. This is about an order of magnitude smaller than previous estimates. Collins (12) gave a heuristic estimate of by assuming that the mismatch free energy and the line tension between coexisting phases are both due to the same effective surface tension acting over different surfaces. May (18) estimated the contribution to γ due to the configurational entropies of lipid chains. He did so by comparing the entropy/molecule of a lipid bilayer to that of a monolayer apposed to a hard wall using the molecular mean-field results of Szleifer et al. (34). However, on the basis of our calculations of the various free-energy contributions to γ, we have argued that the interleaflet coupling cannot be traced to a single factor such as configurational entropy, since the various components of the free energy are coupled in a rather complex manner. Moreover, under the assumption that the mismatch state is tensionless we have found that in our model, the configurational entropy makes a negative contribution to the coupling. This does not directly contradict the result of May (18), which was based on a different molecular mean-field theory (34) that did not include the attractive intermolecular interactions that give rise to liquid-liquid phase separation. In the model we have considered here, as in a real phase-separating bilayer, both entropic and energetic contributions are involved in determining the free energy of the mismatched state. Perhaps more important, our approach differs from that of May in that we have calculated the free-energy difference between two different states of an interdigitating bilayer, whereas May modeled the mismatched state as a lipid monolayer apposed to an impenetrable surface (18).
To our knowledge, the only previous attempt to determine the value of γ in a systematic way has been that of Risselada and Marrink (19) in their molecular dynamics study of liquid-liquid coexistence in a coarse-grained lipid/cholesterol membrane. They determined the probability distribution of mismatch areas and fit this to the form for large a to extract an estimate of . In our statistical model of fluctuating coupled interfaces, we have verified (see Supporting Material) that the probability distribution indeed takes this asymptotic form. However, one must consider how large the mismatch fluctuations must be to reach this regime. The criterion is the same as for the validity of our statistical model: the spatial extent of the mismatch regions must be significantly larger than the compositional correlation length that gives the intrinsic width of the interfaces. In the simulations of Risselada and Marrink (19), these two length scales are both of the order of a few nanometers. Therefore, the necessary separation of scales does not occur, and it is likely that much of what was counted as mismatch areas in their histograms was in fact due instead to the diffuse nature of the domain boundaries in each leaflet. As an illustration of this point, we have carried out lattice Monte Carlo simulations of two coupled mixtures (representing the two leaflets of a bilayer) undergoing phase separation (Fig. 6). From the simulations, we obtained the probability distribution, , of mismatch areas. Fig. 7 shows a plot of ; for mismatch areas between 200 and 300 lattice sites the plot appears linear, suggesting that the regime where has been reached. However, this is not the case. Also plotted in Fig. 7 is the ratio of the perimeter of the mismatch regions to their area or, equivalently, the fraction of lattice sites, among those belonging to mismatch regions, which lie on the borders of these regions. Even for the largest mismatch areas appearing in the simulations, this fraction does not become small; it is certainly never negligible. This indicates that caution should be used in extracting the mismatch free energy from simulations in this way, since sufficiently large mismatch regions may be exceedingly rare.
Figure 6.
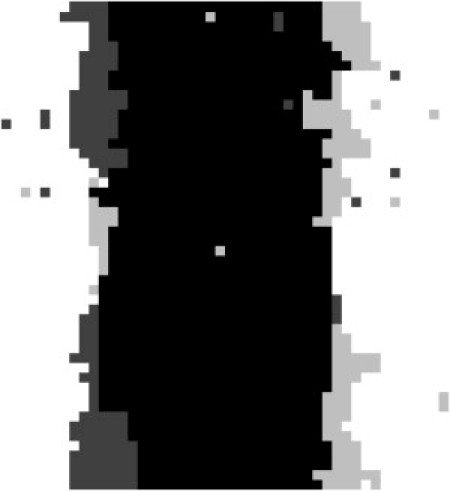
Typical configuration in lattice Monte Carlo simulation of two coupled mixtures, representing the two leaflets of a phase-separating bilayer. The states of the different lattice sites are color-coded: black, liquid-ordered in both leaflets; white, ld in both leaflets; dark gray, lo in the upper leaflet and ld in the lower leaflet; light gray, ld in the upper leaflet and lo in the lower leaflet. Details of the simulation are given in the Supporting Material.
Figure 7.
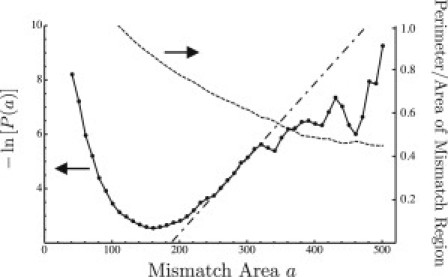
Solid line graphs , where is obtained from a histogram of the areas of mismatch regions (Fig. 6, light and dark gray) in lattice Monte Carlo simulations of two coupled mixtures undergoing phase separation. The dashed line is for each bin in the histograms of mismatch areas, the fraction of lattice sites, among those belonging to mismatch regions, which also lie on the boundaries of those regions. The dash-dotted line is a linear fit to based on mismatch areas that are insufficiently large, as shown by the fact that the perimeter/area ratio is still nonnegligible.
We intend to pursue a number of extensions and improvements of the work presented in this article. Our calculations of γ based on a molecular theory assumed that the bilayer is planar, when in fact a compositionally asymmetric planar bilayer can always lower its free energy by curving to some degree, however small. Taking into account the possibility of curvature will therefore lower the value of the mismatch free energy γ. In addition, it has been shown (13) that the composition dependence of a bilayer's spontaneous curvature provides a mechanism for interleaflet coupling independent of the mismatch free energy. It would be interesting to calculate the magnitude of this contribution by extending our free energy calculations to include the effects of curvature. More important, although this work has been primarily concerned with domain registry in symmetric model membranes, the extension of the microscopic model to allow curvature would allow us to answer questions related to membranes that are asymmetric to begin with, such as the cell plasma membrane. In particular, it is usually assumed that the formation of lipid rafts is driven by interactions in the outer leaf, where there are large numbers of both saturated and unsaturated lipids. One would like to know the extent of the contrast in composition between raft and nonraft regions in the inner leaflet, where the great majority of lipids are unsaturated and few are saturated. Such issues are of clear biological importance and will motivate further work.
Acknowledgments
We thank Steve Paik for discussions and for reminding us of the statistical mechanics/quantum mechanics correspondence.
This work was supported by grants from the National Science Foundation (DMR-0803956 to M.S. and CBET-0828046 to I.S.) and the National Institutes of Health (NIH GM087016 to I.S.).
Supporting Material
References
- 1.Lingwood D., Simons K. Lipid rafts as a membrane-organizing principle. Science. 2010;327:46–50. doi: 10.1126/science.1174621. [DOI] [PubMed] [Google Scholar]
- 2.Uline M.J., Longo G.S., Szleifer I. Calculating partition coefficients of chain anchors in liquid-ordered and liquid-disordered phases. Biophys. J. 2010;98:1883–1892. doi: 10.1016/j.bpj.2010.01.036. [DOI] [PMC free article] [PubMed] [Google Scholar]
- 3.Veatch S.L., Keller S.L. Seeing spots: complex phase behavior in simple membranes. Biochim. Biophys. Acta. 2005;1746:172–185. doi: 10.1016/j.bbamcr.2005.06.010. [DOI] [PubMed] [Google Scholar]
- 4.Devaux P.F., Morris R. Transmembrane asymmetry and lateral domains in biological membranes. Traffic. 2004;5:241–246. doi: 10.1111/j.1600-0854.2004.0170.x. [DOI] [PubMed] [Google Scholar]
- 5.Dietrich C., Bagatolli L.A., Gratton E. Lipid rafts reconstituted in model membranes. Biophys. J. 2001;80:1417–1428. doi: 10.1016/S0006-3495(01)76114-0. [DOI] [PMC free article] [PubMed] [Google Scholar]
- 6.Wang T.Y., Silvius J.R. Cholesterol does not induce segregation of liquid-ordered domains in bilayers modeling the inner leaflet of the plasma membrane. Biophys. J. 2001;81:2762–2773. doi: 10.1016/S0006-3495(01)75919-X. [DOI] [PMC free article] [PubMed] [Google Scholar]
- 7.Simons K., Toomre D. Lipid rafts and signal transduction. Nat. Rev. Mol. Cell Biol. 2000;1:31–39. doi: 10.1038/35036052. [DOI] [PubMed] [Google Scholar]
- 8.Kiessling V., Crane J.M., Tamm L.K. Transbilayer effects of raft-like lipid domains in asymmetric planar bilayers measured by single molecule tracking. Biophys. J. 2006;91:3313–3326. doi: 10.1529/biophysj.106.091421. [DOI] [PMC free article] [PubMed] [Google Scholar]
- 9.Garg S., Rühe J., Naumann C.A. Domain registration in raft-mimicking lipid mixtures studied using polymer-tethered lipid bilayers. Biophys. J. 2007;92:1263–1270. doi: 10.1529/biophysj.106.091082. [DOI] [PMC free article] [PubMed] [Google Scholar]
- 10.Wan C., Kiessling V., Tamm L.K. Coupling of cholesterol-rich lipid phases in asymmetric bilayers. Biochemistry. 2008;47:2190–2198. doi: 10.1021/bi7021552. [DOI] [PubMed] [Google Scholar]
- 11.Collins M., Keller S. Tuning lipid mixtures to induce or suppress domain formation across leaflets of unsupported asymmetric bilayers. Proc. Natl. Acad. Sci. USA. 2008;105:124–128. doi: 10.1073/pnas.0702970105. [DOI] [PMC free article] [PubMed] [Google Scholar]
- 12.Collins M.D. Interleaflet coupling mechanisms in bilayers of lipids and cholesterol. Biophys. J. 2008;94:L32–L34. doi: 10.1529/biophysj.107.124362. [DOI] [PMC free article] [PubMed] [Google Scholar]
- 13.Leibler S., Andelman D. Ordered and curved meso-structures in membranes and amphiphilic films. J. Phys. 1987;48:2013–2018. [Google Scholar]
- 14.Hansen P., Miao L., Ipsen J. Fluid lipid bilayers: intermonolayer coupling and its thermodynamic manifestations. Phys. Rev. E. 1998;58:2311–2324. [Google Scholar]
- 15.Allender D.W., Schick M. Phase separation in bilayer lipid membranes: effects on the inner leaf due to coupling to the outer leaf. Biophys. J. 2006;91:2928–2935. doi: 10.1529/biophysj.106.086868. [DOI] [PMC free article] [PubMed] [Google Scholar]
- 16.Wagner A.J., Loew S., May S. Influence of monolayer-monolayer coupling on the phase behavior of a fluid lipid bilayer. Biophys. J. 2007;93:4268–4277. doi: 10.1529/biophysj.107.115675. [DOI] [PMC free article] [PubMed] [Google Scholar]
- 17.Putzel G.G., Schick M. Phase behavior of a model bilayer membrane with coupled leaves. Biophys. J. 2008;94:869–877. doi: 10.1529/biophysj.107.116251. [DOI] [PMC free article] [PubMed] [Google Scholar]
- 18.May S. Trans-monolayer coupling of fluid domains in lipid bilayers. Soft Matter. 2009;5:3148–3156. [Google Scholar]
- 19.Risselada H.J., Marrink S.J. The molecular face of lipid rafts in model membranes. Proc. Natl. Acad. Sci. USA. 2008;105:17367–17372. doi: 10.1073/pnas.0807527105. [DOI] [PMC free article] [PubMed] [Google Scholar]
- 20.Reference deleted in proof.
- 21.Elliott R., Szleifer I., Schick M. Phase diagram of a ternary mixture of cholesterol and saturated and unsaturated lipids calculated from a microscopic model. Phys. Rev. Lett. 2006;96:098101. doi: 10.1103/PhysRevLett.96.098101. [DOI] [PubMed] [Google Scholar]
- 22.Flory P.J. Wiley-Interscience; New York: 1969. Statistical Mechanics of Chain Molecules. [Google Scholar]
- 23.Ben-Shaul A., Szleifer I., Gelbart W. Chain organization and thermodynamics in micelles and bilayers. I. Theory. J. Chem. Phys. 1986;83:3597–3611. [Google Scholar]
- 24.Elliott R., Katsov K., Szleifer I. Phase separation of saturated and mono-unsaturated lipids as determined from a microscopic model. J. Chem. Phys. 2005;122:44904. doi: 10.1063/1.1836753. [DOI] [PubMed] [Google Scholar]
- 25.de Almeida R.F., Fedorov A., Prieto M. Sphingomyelin/phosphatidylcholine/cholesterol phase diagram: boundaries and composition of lipid rafts. Biophys. J. 2003;85:2406–2416. doi: 10.1016/s0006-3495(03)74664-5. [DOI] [PMC free article] [PubMed] [Google Scholar]
- 26.Bruckner R.J., Mansy S.S., Szostak J.W. Flip-flop-induced relaxation of bending energy: implications for membrane remodeling. Biophys. J. 2009;97:3113–3122. doi: 10.1016/j.bpj.2009.09.025. [DOI] [PMC free article] [PubMed] [Google Scholar]
- 27.Hamilton J.A. Fast flip-flop of cholesterol and fatty acids in membranes: implications for membrane transport proteins. Curr. Opin. Lipidol. 2003;14:263–271. doi: 10.1097/00041433-200306000-00006. [DOI] [PubMed] [Google Scholar]
- 28.Esposito C., Tian A., Baumgart T. Flicker spectroscopy of thermal lipid bilayer domain boundary fluctuations. Biophys. J. 2007;93:3169–3181. doi: 10.1529/biophysj.107.111922. [DOI] [PMC free article] [PubMed] [Google Scholar]
- 29.Honerkamp-Smith A.R., Cicuta P., Keller S.L. Line tensions, correlation lengths, and critical exponents in lipid membranes near critical points. Biophys. J. 2008;95:236–246. doi: 10.1529/biophysj.107.128421. [DOI] [PMC free article] [PubMed] [Google Scholar]
- 30.Kogut J.B. An introduction to lattice gauge theory and spin systems. Rev. Mod. Phys. 1979;51:659–713. [Google Scholar]
- 31.den Nijs M. Academic Press; New York: 1988. Phase Transitions and Critical Phenomena. [Google Scholar]
- 32.Feynman R., Hibbs A. McGraw Hill; New York: 1965. Quantum Mechanics and Path Integrals. [Google Scholar]
- 33.Popovic Z., Satpathy S. Wedge-shaped potential and Airy-function electron localization in oxide superlattices. Phys. Rev. Lett. 2005;94:176805. doi: 10.1103/PhysRevLett.94.176805. [DOI] [PubMed] [Google Scholar]
- 34.Szleifer I., Ben-Shaul A., Gelbart W. Chain packing statistics and thermodynamics of amphiphile monolayers. J. Phys. Chem. 1990;94:5081–5089. [Google Scholar]
Associated Data
This section collects any data citations, data availability statements, or supplementary materials included in this article.