

Abstract
There has been considerable debate about the intrinsic PPII propensity of amino-acid residues in denatured polypeptides. Experimentally, the propensity scale is based on the behavior of guest amino-acid residues placed in the middle of polyproline hosts. We have used classical molecular dynamics simulations, with state-of-the-art force fields to carry out a comprehensive analysis of the conformational equilibria of the proline-based host oligopeptides with single guests. The tracked structural characteristics include the PPII content, the cis/trans isomerization of the prolyl bonds, the puckering of the pyrrolidine rings of the proline residues, and the secondary structural motifs. We find no evidence for an intrinsic PPII propensity in any of the guest amino acids other than proline. Instead, the PPII content as derived from experiments may be explained in terms of: 1), a local correlation between the dihedral angles of the guest amino acid and the proline residue immediately preceding it; and 2), a nonlocal correlation between the cis/trans states of the peptide bonds. In terms of the latter, we find that the presence of a guest (other than proline, tyrosine, or tryptophan) increases the trans content of most of the prolyl bonds, which results in an effective increase of the peptide PPII content. With respect to the local dihedral correlations, we find that these are well described in terms of the so-called odds-ratio statistic. Expressed in terms of free energy language, the PPII content based on the odds-ratio of the relevant residues correlate well with the experimentally measured PPII content.
Introduction
The left-handed polyproline II (PPII) helix plays an important role in cell processes such as transcription, signal transduction, and cell motility. Proline's ability to form left-handed helices is crucial for cellular structural integrity (in particular for plant cell wall proteins and collagen). PPII helices are also believed to play an important role in protein denatured states (1), even in molecules that do not contain a single proline, such as diverse Ala-based peptides.
Initially, the left-handed PPII conformation was proposed as an alternate to the random coil model for disordered peptides and unfolded proteins by Tiffany and Krimm in 1968 (2). This hypothesis arose from the experimentally observed similarities between the ultraviolet circular dichroism (CD) spectra of denatured proteins and that of PPII (3). This proposition was revived in the last 10 years, with a common consensus that indeed PPII conformations are a part of the denatured states, but with dissent with regard to the manifestation of these PPII states versus the others. Thus, for Ala-rich peptides, the two contrasting views are that Ala has a very high PPII propensity (between 80% and 100%) (4–11); or that the PPII conformation is just one of many similar, local conformational states (12–22).
Experimentally, there has been considerable emphasis on deriving an intrinsic PPII propensity scale for individual amino acids in a proline-rich host-guest environment (23–29). This scale is based on host-guest experiments, which is a powerful tool for probing the overall structural characteristics of peptides, such as their α-helix (30,31) and β-sheet (32,33) content. In the proline-based experiments, a guest residue, X is inserted in a short polyproline peptide. Because a proline guest (X = P) is expected to form a stable PPII helix in aqueous solution, deviations from this conformation induced by non-proline guests are expected to provide a measure of their PPII propensity.
With CD experiments, it was found that the presence of non-proline guests decreases the PPII helical content, although the range of PPII helical content is relatively narrow. The all-proline peptide was found, on average, to be 67% PPII helical, and other amino acids such as Gln, Ala, and Gly were deemed to have high PPII propensity in this context (24–26). The assumption here is that all the proline residues should be in their trans conformation, because in the cis conformation the carboxyl oxygen atoms tend to lie parallel to the backbone hidden from the water. Moreover, these studies were taken as further proof that Ala has a relatively high PPII propensity, based on the following rationale. While a proline can restrict its preceding residue through steric interactions (34), the Ala guest was deemed not to have much effect in the preceding proline. Thus, this unconstrained proline is expected to adopt all assessable conformations. In that case, the estimated PPII content should decrease considerably below that measured for PAP, unless Ala itself contributed to this content by means of an intrinsic PPII propensity.
Subsequently, Vila et al. (16) investigated this problem theoretically, obtaining PPII contents for the different host-guest peptides in qualitative agreement with the experimental numbers. Specifically, they noted a reduction in the PPII helical content with respect to the all-proline peptide. They concluded that there is no propagation of the PPII conformational preference into the guest for the host-guest peptides they analyzed (X = Ala, Gln, Gly, Val). Furthermore, the notion that a solvated proline-rich peptide take on its optimal trans conformation only, was deemed an oversimplification. Instead, the dynamical changes associated with the cis/trans isomerization of the proline residues (16) need to be accounted for, and the notion of an intrinsic PPII propensity would need revision.
Intrigued by these studies and the on-going debate concerning the intrinsic PPII propensity, we have reexamined this problem using new free energy methods in combination with classical molecular dynamics with state-of-the-art force fields to study the structural characteristics of proline-based oligopeptides with guest amino acids. Specifically, we have extended the list of guests to cover all 20 amino acids, and carried out a comprehensive population analysis of their structural characteristics inside the proline host. In terms of the latter, we examined the conformational preferences associated with the cis/trans isomerization of the prolyl bonds, the puckering of the pyrrolidine rings, and the secondary structural motifs associated with the dihedral angles of the Ramachandran plots of the different residues. Our host-guest simulations leverage-off of our previous investigations of the free energy and cis/trans isomerization studies of pure proline oligomers (35–37).
Our chief conclusions are the following. We find that the average PPII content of the host-guest oligopeptides is in qualitative agreement with their experimental values. We find that these peptides share similar structural features, and that a population analysis of secondary structure motifs (residue by residue) is in agreement with the results of Vila et al. (16) in the sense that the guest residues (other than Pro) do not favor the F region. We find that there is no need to invoke an intrinsic PPII propensity to explain the experimental results. Rather, these may be understood in terms of the following.
-
1.
As it is well known (34,38), proline peptides are conformationally restricted by their pyrrolidine rings, and by steric interactions with neighboring prolines. In fact, a proline restricts the dihedrals of a preceding residue to 50° < ψ < 180° (except for Gly), forcing the preceding residue to be in either a β- or F region, according to the value of ϕ. In the present host-guest setup, there is a statistical, Boltzmann-weighted distribution of conformations, with the highest percentage of the guest population found in the β-region.
-
2.
The cis/trans proline ratio depends on the sequence surrounding the proline residue (34). For this particular set of host-guest peptides, we find that every guest (Pro, Tyr, and Trp excepted) increases the trans content of the prolyl bonds. The guest amino acids therefore are not characterized by any PPII propensity, but instead collaborate with their own intrinsic trans propensity to destabilize the cis isomers of the proline hosts, which results in a de facto net PPII increase.
-
3.
There is a local correlation between the dihedral angles of the guest and the proline residue immediately preceding the guest. We find that the degree to which the guest influences this proline (and vice versa) is conveniently described in terms of an odds-ratio analysis.
This article is organized as follows. Methods provides information as to our simulation methodology and analysis. Specifically, we briefly discuss the simulation details, the odds-ratio analysis, and the quantification of the PPII content of a peptide. Next, we present our results with a focus on the structural characteristics of the host-guest conformers and the odds-ratio analysis for the proline-guest correlations. A discussion of our results and a comparison to experimental data is given in the Discussion, whereas the Conclusion is reserved for a short summary of this work.
Methods
In this section, we provide all relevant simulation details and review the odds-ratio (39) construction used to describe the correlation between residues. For a discussion of our sampling protocol, including the adaptively biased molecular dynamics (ABMD) method (40) and Hamiltonian-Temperature replica exchange molecular dynamics (HT-REMD) (41) methodology and the protocal for quantifying the PPII content of a peptide, please see the Supporting Material.
Simulation details
The simulations were carried out for the following peptides:
-
1.
Ace – (Pro)3 – X – (Pro)3 – Gly – Tyr –NH2 (denoted as PXP), with the guest X taken from the following list of amino acids: P(Pro), Q(Gln), D(Asp), A(Ala), R(Arg), E(Glu), K(Lys), G(Gly), L(Leu), F(Phe), S(Ser), M(Met), C(Cys), H(His), N(Asn), T(Thr), I(Ile), V(Val), W(Trp), and Y(Tyr).
-
2.
Ace – (Pro) 3 – X – (Pro)3 –NH2 peptides (denoted here as PXP′) with X = P, A, V. For histidine, which exists in different protonated states, we considered two versions of the PHP peptide: a charged one with an additional proton at the δ-position, and a neutral version without such a proton.
In each case, we shall refer to the first three proline residues as P1, P2, and P3, and to the last three as P4, P5, and P6, respectively. For PXP, the residues are then labeled as
We use this notation even when the guest is another proline, that is, for the heptamers PPP and PPP′. We note that the choice of PXP peptides is motivated by the experiments (24–26,29); from a theoretical point of view, the simulation of PXP′ peptides is more appealing, because these lack the –Gly–Tyr–NH2 tail.
Applicability of regular MD to this system is limited because of the slow cis/trans isomerization of the prolyl bonds. These transitions correspond to the changes of the ω-torsion angles (see Fig. S1 in the Supporting Material) between ω = 0° (cis) and ω = 180° (trans). The all cis configuration is associated with the right-handed polyproline (PPI) helix. We thus capture the different patterns of the cis/trans conformations with the collective coordinate
where the sum runs over all the prolyl bonds (35–37). Clearly, for a proline-rich peptide with n prolyl bonds, Ω takes on the values from −n (PPII) to n (PPI), and describes the net balance of the cis/trans states.
All the ABMD and HT-REMD simulations were carried using an implicit water model based on the generalized Born approximation (42,43). Initial configurations consisted of the unfolded peptides, which were generated using the LEAP program of the AMBER V.9 simulation package. The simulations used the ff99SB version of the force field of Hornak et al. (44), whose equilibrium structures are consistent with the experimental results (37,45) (see the Supporting Material for a discussion). The leap-frog algorithm with a 1-fs timestep was used along with the Langevin dynamics and a cutoff of 18 Å for the nonbonded interactions.
The simulations took place in two stages: we used ABMD to generate suitable biasing potentials, and then used these for the HT-REMD runs that generate 105 equilibrium samples at T = 300 K for each peptide. Please see the Supporting Material for the simulation details.
The odds ratio
To quantify the changes in the conformational preferences of the peptides implied by different guest amino acids, we made use of the so-called odds ratio (39) (OR) construction. The OR is a descriptive statistic that measures the strength of association, or nonindependence, between two binary values. The OR is defined for two binary random variables (denoted as X and Y) as
| (1) |
where pab = p(X = a, Y = b) is the probability of the (X = a, Y = b) event (with a and b taking on binary values of 0 and 1). For the purposes of this work, we can think of X and Y as being some characteristic properties describing the conformations of different residues. For example, the variables could be assigned values of 0(1) depending on whether the corresponding prolyl bond assumes a cis (trans) conformation.
The usefulness of the OR in quantifying the influence of one binary random variable upon another can be readily seen. If the two variables are statistically independent, then pab = pa pb, so that OR = 1. In the opposite extreme case of X = Y (complete dependence), both p10 and p01 are zero, and the OR is infinite. Similarly, for , p00 = p11 = 0, rendering the OR equal zero. To summarize, an OR of unity indicates that the values of X are equally likely for both values of Y (i.e., Y = 1,0); an OR greater than unity indicates that the X = 1 is more likely when Y = 1, while an OR less than unity indicates that X = 1 is more likely when Y = 0.
It is convenient to recast the log of the OR in terms of the language of free energies. If one expresses the probability of the (X = x, Y = y) events in terms of a free energy Gxy,
then the ratio of probabilities pxy/pxz translates into a free energy difference:
Clearly, the logarithm of the OR then maps onto the difference of those differences, i.e.,
| (2) |
For the case of statistically independent properties, ΔΔG = 0; otherwise, this quantity takes on either positive or negative values, whose magnitude depends on the mutual dependence between the two variables. While this development may be thought of as being purely notational, the use of an OR analysis couched in terms of free energy language provides for a useful and intuitive measure of the host-guest correlations.
Results
Having collected equilibrium samples of the host-guest peptides with the HT-REMD runs, we have analyzed their structural properties, with a focus on their PPII content. The results are summarized in Tables 1–4 and Figs. 1–3 as well as Table S1 and Table S2 and Fig. S2, Fig. S3, Fig. S4, Fig. S5, and Fig. S6 in the Supporting Material. For ease of presentation, we separate the discussion of the structural characteristics of the conformers, and the statistics of the proline-guest correlations.
Table 1.
F and PPII content of all residues as a percentage
| Peptide | P1,P2,P4,P5 | P3 | X | P6 | G | Y | Average |
|---|---|---|---|---|---|---|---|
| PPP | 99(74) | 100(70) | 99(51) | 46(41) | 6 | 32 | 76(55) [67] |
| PPP′ | 100(75) | 100(71) | 100(67) | 56(52) | — | — | 93(70) |
| PQP | 98(81) | 25(19) | 23 | 35(32) | 6 | 36 | 57(49) [66] |
| PDP | 100(71) | 28(19) | 10 | 47(45) | 5 | 33 | 58(44) [63] |
| PGP | 98(77) | 44(34) | 16 | 45(41) | 6 | 32 | 59(49) [58] |
| PAP | 98(81) | 17(13) | 21 | 40(36) | 5 | 35 | 57(48) [61] |
| PAP′ | 99(79) | 26(20) | 35 | 56(51) | — | — | 73(60) |
| PKP | 98(76) | 29(17) | 30 | 42(36) | 7 | 32 | 59(47) [59] |
| PSP | 99(82) | 19(15) | 22 | 43(39) | 5 | 35 | 58(50) [58] |
| PEP | 99(78) | 16(11) | 19 | 42(39) | 5 | 33 | 57(47) [61] |
| PHP∗ | 99(81) | 24(18) | 21 | 46(40) | 8 | 35 | 59(50) [55] |
| PFP | 99(74) | 25(14) | 26 | 41(38) | 6 | 34 | 59(46) [58] |
| PCP | 99(80) | 23(17) | 27 | 40(36) | 6 | 34 | 58(49) [55] |
| PNP | 99(78) | 22(17) | 13 | 43(41) | 5 | 37 | 57(47) [55] |
| PRP | 98(81) | 34(18) | 19 | 46(32) | 7 | 33 | 59(48) [61] |
| PMP | 98(76) | 27(18) | 30 | 36(33) | 6 | 33 | 58(47) [55] |
| PLP | 98(77) | 23(16) | 18 | 39(35) | 6 | 34 | 57(46) [58] |
| PHP† | 99(74) | 23(14) | 18 | 42(38) | 6 | 33 | 58(45) |
| PTP | 99(81) | 20(15) | 27 | 41(37) | 7 | 34 | 58(49) [53] |
| PWP | 99(72) | 34(14) | 38 | 38(35) | 6 | 34 | 60(46) |
| PIP | 98(79) | 18(12) | 22 | 39(34) | 6 | 35 | 57(47) [50] |
| PVP′ | 100(79) | 21(16) | 23 | 56(52) | — | — | 71(58) |
| PVP | 98(80) | 17(12) | 19 | 37(34) | 6 | 34 | 56(47) [49] |
| PYP | 98(72) | 28(14) | 30 | 40(37) | 6 | 32 | 59(45) |
Parenthesized and bracketed values correspond to computational and experimental (25) estimates of PPII content, respectively while the rest of numbers correspond to computational estimates of F content.
His is assumed to be protonated.
His is assumed to be neutral.
Table 2.
Trans-content of all the prolyl bonds as a percentage
| Peptide | Ace–P1 | P1–P2 | P2–P3 | X–P4 | P4–P5 | P5–P6 | Average |
|---|---|---|---|---|---|---|---|
| PPP | 76 | 80 | 70 (51)∗ | 64 | 80 | 79 | 71 |
| PPP′ | 76 | 80 | 71 (67)∗ | 61 | 85 | 86 | 75 |
| PQP | 79 | 91 | 62 | 78 | 84 | 81 | 79 |
| PDP | 76 | 85 | 74 | 29 | 96 | 93 | 75 |
| PGP | 78 | 88 | 71 | 75 | 75 | 79 | 78 |
| PAP | 76 | 90 | 58 | 79 | 84 | 80 | 78 |
| PAP′ | 76 | 90 | 67 | 71 | 82 | 87 | 79 |
| PKP | 77 | 89 | 64 | 69 | 77 | 77 | 76 |
| PSP | 76 | 92 | 60 | 83 | 83 | 85 | 80 |
| PEP | 75 | 85 | 64 | 76 | 83 | 86 | 78 |
| PHP† | 74 | 91 | 56 | 80 | 80 | 80 | 77 |
| PFP | 75 | 87 | 64 | 50 | 85 | 81 | 74 |
| PCP | 77 | 90 | 68 | 77 | 80 | 77 | 78 |
| PNP | 75 | 90 | 70 | 60 | 88 | 87 | 78 |
| PRP | 79 | 89 | 55 | 75 | 86 | 65 | 75 |
| PMP | 75 | 87 | 66 | 63 | 85 | 72 | 75 |
| PLP | 74 | 87 | 66 | 67 | 87 | 79 | 77 |
| PHP‡ | 75 | 88 | 62 | 46 | 89 | 84 | 74 |
| PTP | 78 | 90 | 75 | 79 | 81 | 78 | 80 |
| PWP | 75 | 85 | 60 | 44 | 89 | 79 | 72 |
| PIP | 75 | 88 | 73 | 80 | 82 | 79 | 79 |
| PVP′ | 73 | 87 | 71 | 77 | 82 | 84 | 79 |
| PVP | 74 | 90 | 69 | 80 | 82 | 77 | 78 |
| PYP | 74 | 87 | 61 | 45 | 86 | 82 | 72 |
The bracketed values belong to the P3-P bond.
His is assumed to be protonated.
His is assumed to be neutral.
Table 3.
Pro-X odds ratio and conditional probabilities
|
p(X ∈ F), given P3 |
Odds ratio |
ΔΔG |
PPII |
||||||||
|---|---|---|---|---|---|---|---|---|---|---|---|
| Peptide | F | α | Ft | Fc | αt | αc | F∗ | PPII† | F∗ | PPII† | Content‡ |
| PQP | 51 | 14 | 51 | 52 | 17 | 8 | 6.64 | 5.20 | 1.13 | 0.98 | 66 |
| PDP | 20 | 7 | 23 | 14 | 9 | 1 | 3.41 | 3.64 | 0.73 | 0.77 | 63 |
| PGP | 58 | 33 | 63 | 38 | 44 | 14 | 2.86 | 3.46 | 0.63 | 0.74 | 58 |
| PAP | 41 | 17 | 40 | 44 | 25 | 7 | 3.42 | 3.03 | 0.73 | 0.66 | 61 |
| PAP′ | 53 | 29 | 54 | 51 | 39 | 14 | 2.74 | 2.61 | 0.60 | 0.57 | — |
| PKP | 39 | 27 | 48 | 25 | 36 | 8 | 1.76 | 2.61 | 0.34 | 0.57 | 59 |
| PSP | 41 | 19 | 38 | 50 | 25 | 10 | 3.01 | 2.50 | 0.66 | 0.55 | 58 |
| PEP | 34 | 16 | 32 | 38 | 23 | 5 | 2.65 | 2.14 | 0.58 | 0.45 | 61 |
| PHP§ | 34 | 18 | 28 | 49 | 24 | 12 | 2.42 | 1.57 | 0.53 | 0.27 | 55 |
| PFP | 37 | 22 | 33 | 41 | 27 | 11 | 2.05 | 1.55 | 0.43 | 0.26 | 58 |
| PCP | 40 | 24 | 34 | 56 | 27 | 17 | 2.13 | 1.47 | 0.45 | 0.23 | 55 |
| PNP | 17 | 12 | 18 | 17 | 16 | 4 | 1.51 | 1.47 | 0.25 | 0.23 | 55 |
| PRP | 27 | 15 | 24 | 31 | 17 | 11 | 2.18 | 1.46 | 0.47 | 0.22 | 61 |
| PMP | 37 | 28 | 36 | 39 | 37 | 9 | 1.53 | 1.38 | 0.25 | 0.19 | 55 |
| PLP | 25 | 17 | 23 | 31 | 20 | 10 | 1.70 | 1.35 | 0.32 | 0.18 | 58 |
| PHP¶ | 24 | 16 | 21 | 29 | 22 | 5 | 1.73 | 1.29 | 0.33 | 0.15 | — |
| PTP | 36 | 25 | 32 | 49 | 31 | 8 | 1.69 | 1.29 | 0.31 | 0.15 | 53 |
| PWP | 44 | 35 | 42 | 45 | 44 | 14 | 1.45 | 1.22 | 0.22 | 0.12 | — |
| PIP | 31 | 20 | 22 | 50 | 22 | 13 | 1.78 | 1.01 | 0.34 | 0.01 | 50 |
| PVP′ | 28 | 22 | 23 | 43 | 27 | 10 | 1.40 | 1.00 | 0.20 | 0.00 | — |
| PVP | 23 | 19 | 16 | 41 | 24 | 6 | 1.29 | 0.75 | 0.15 | −0.17 | 49 |
| PYP | 27 | 32 | 18 | 35 | 44 | 9 | 0.78 | 0.45 | −0.14 | −0.47 | — |
The table presents conditional probability (as a percentage) for the guest residue to be in the F region given different states of the preceding P3 residue, along with the odds ratio and ΔΔG (in kcal/mol).
Calculations based on the Zimmerman regions of the Ramachandran plot, independently of the c/t states of prolines.
Calculations based on both the Zimmerman regions and the c/t pattern of prolines.
Reported by Rucker et al. (25) for T = 5°C based on CD experiments.
His is assumed to be protonated.
His is assumed to be neutral.
Table 4.
Grouping of amino acids according to their nature and the strength of the P3-X correlation
| OR∗ | Charged |
Polar | Hydrophobic | Small | |
|---|---|---|---|---|---|
| (−) | (+) | ||||
| OR > 2 | E D | K | Q S | — | A G |
| 1 < OR ≤ 2 | — | R H† | H‡ N T C | L F M W | — |
| 0 < OR ≤ 1 | — | — | — | V Y I | — |
OR has been computed based on the PPII population.
His is assumed to be protonated.
His is assumed to be neutral.
Figure 1.
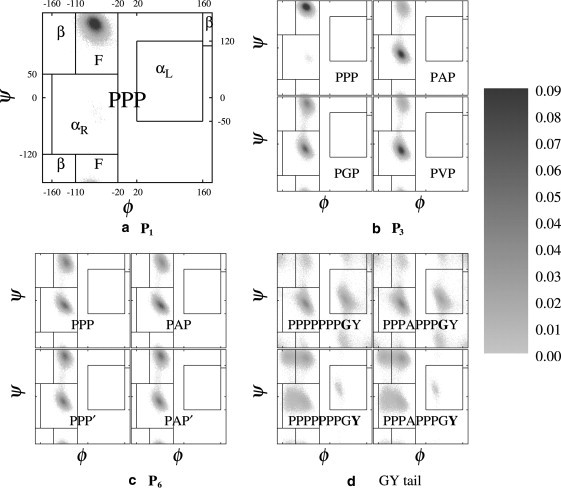
Typical examples of Ramachandran plots for different residues (a) P1 in PPP peptide, (b) P3 in PPP, PAP, PGP, and PVP, (c) P6 in PPP, PAP, PPP′, and PAP′, and (d) ending Gly and Tyr (boldface) in PPP and PAP. Note that the definitions of the areas F, β, αR, and αL are highlighted in panel a. Each pixel represents a 1° × 1° bin in the Ramachandran plot and its intensity represents the number of times visited in our sampling, scaled (as given on right) from 0% (white) to 0.09% (black) of the whole population (105).
Figure 2.
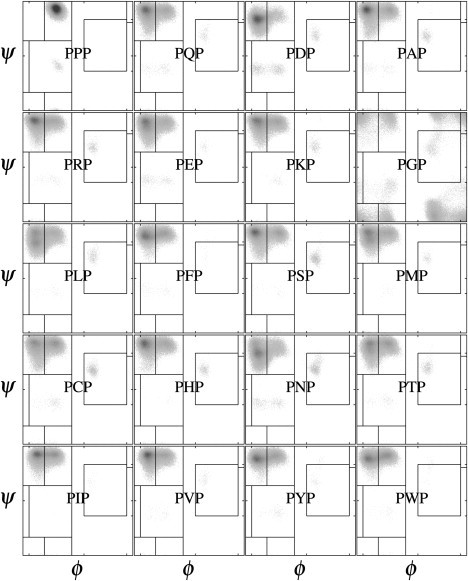
Ramachandran plots of all 20 guest residues in PXP peptides. See Fig. 1 for the definitions. Note that histidine in PHP is assumed to be protonated.
Figure 3.

Experimental values (25) of the PPII content plotted against ΔΔG, computed from the odds ratio of PPII for the P3 and X residues in PXP peptides (X ≠ P,Y,W). Labels identify the guest amino acids. Simulation data for PYP and PWP is not shown, because no experimental data is available for these peptides. Data for PPP is also excluded because of the substantive differences between the P-P correlation as compared to the P-X (X ≠ P) correlation. The correlation coefficient is R = 0.85. Note that the histidine in PHP peptide is assumed to be protonated.
Structural characteristics of host-guest conformers
Ramachandran plots for selected residues are shown in Figs. 1 and 2. On Fig.1 a, we have marked the relevant regions, i.e., the F, αR, αL, and β-regions. On these grayscale plots, each pixel represents a 1° × 1° bin, whose intensity is related to the dihedral population ranging from 0% (white) to 0.09% (black) out of a total population of 105 samples. Table 1 quantifies the F and PPII content of each residue for all the PXP and PXP′ peptides.
Because steric interactions constrain the structure of neighboring prolines, all the proline residues which are followed by another proline, i.e., P1, P2, P4, and P5 (and P3 in PPP and PPP′), are restricted to the F region of their Ramachandran plots. As a typical illustration of this, Fig. 1 a gives the results for residue P1 of PPP. Table 1 shows that ∼99 ± 1% of these residues fall into the F-region, and these numbers drop by 15–30% when the PPII content is considered (i.e., when the cis isomers are excluded). P6 is also not followed by another proline, and its corresponding dihedrals are distributed between the F and αR regions (Fig. 1 c). Table 1 gives the variation of the F (PPII) contents of P6, which ranges between 35 (32) and 47% (46), depending on the guest. For the PXP′ peptides, the F and PPII contents of the P6 residue are consistently 10–20% higher, indicating that the presence of Tyr and Gly in the tail decreases the F (PPII) contents. When P3 is followed by a guest X ≠ P, its F and PPII content decreases dramatically.
Fig. 1 b shows typical results for the P3 residue in PAP, PGP, and PVP, which now feature a significant αR content. Fig. 1 d shows Ramachandran plots for the terminal Gly and Tyr for the PPP and PAP peptides. Because Gly is quite flexible, it explores more regions of the Ramachandran plot, with now only 6 ± 1% in the F region. For Tyr, all four regions are available, and ∼31–37% of these residues fall in the F region. There appears to be little variation of these numbers with respect to the type of guest, presumably because of the relatively large distance of the peptide tail to its center. Finally, we turn to the Ramachandran plots for the guest residue itself, shown in Fig. 2 for PXP peptides. It is clear that only a very small population falls outside the F-β regions, which merge. The exception here is Gly, which is characterized by a large population falling outside of this region. Table 1 gives a quantitative measure of the F content of the guest residue, which is obtained via the fitting technique discussed in the Supporting Material. The F content of the guest in PAP′ and PWP is 35% and 38%, respectively, and then it is ≤30% for all the other single-guest residues with X ≠ P (in particular, it is only 21% for PAP).
To summarize, we have measured the F and PPII contents of each of the residues for all host-guest peptides. In terms of the average F (PPII) content of all PXP peptides, PPP has a maximum F (PPII) content of 76% (55%). For the rest of the PXP peptides, the average F (PPII) content varies between 56% and 60% (44% and 50%). Because of the absence of the non-proline tail, PXP′ peptides have an even higher F (PPII) content, with an average of 93% (70%) for PPP′.
The results of a sequence-based analysis of the peptides is presented in Table S1. The population of the structures based on the number of cis isomers for each peptide is given (first column). From this table, it is clear that the presence of a guest diminishes the number of cis bonds present within a peptide. This is further confirmed by Table 2, which gives the trans content (as a percentage) of all the prolyl bonds. This table shows that a general trend (with some exceptions) is that the least trans content is associated with the P2–P3 and X–P4 bonds, and the highest trans content with P1–P2 and P4–P5. For the particular case of PPP, the least trans content is associated with the proline guest, i.e., P3–P which is 51%. The presence of the guest (except when X is Pro, Tyr, or Trp) increases the trans content of the individual peptides, and this content is increased even more when a second guest is added. The increase of the total trans content for each peptide has a local and a nonlocal component.
The replacement of the Pro guest by any other amino acid immediately eliminates the residue with highest cis content in PPP. There is also a nonlocal effect, as the PPII contents for most prolyl bonds also increase. Note that Table 2 shows the average PPII content for prolyl bonds, i.e., not counting P3–X, when X ≠ Pro. Furthermore, we can look at the most populated patterns (data not shown). For instance, a structure with all trans prolyl bonds was found to have a population of 10% in PPP. This all trans population increases with guest amino acids (e.g., 21% in PQP, 17% in PAP, etc.). For structures with a single cis prolyl bond, a very common pattern is for the single cis bond to be located at either P3 or P4. Table S1 (second column) also gives the populations of the structures based on the number of residues in the F region (for this calculation, the terminal Gly-Tyr residues are ignored).
Clearly, the number of residues in F decreases with the introduction of the guests. In particular, structures with all seven residues in the F regions become quite rare. Peptides with guests typically have four or five residues in the F region. The last column in Table S1 shows the two most probable patterns and their populations as a percentage, considering the regions in the Ramachandran plot. The most probable patterns (for X ≠ P) from P1 to P5 are FFαβFF for all single-guest peptides; there are only differences in P6 except for Gly that the second most probable structure is FFFNFF, in which the guest is in none of the α, β, or F regions (denoted as N).
The data presented so far indicates that—except for the peptide tail—all the variations in the Ramachandran plot occur on P3–X. This is somewhat similar to the recent conclusions based on the evaluation of sequential nearest-neighbor effects on quantum-chemical calculations of 13Cα chemical shifts for the nucleic-acid binding protein in which shows the sizeable nearest-neighbor effects are seen only for residues preceding proline (47). Thus, we further examine the conformation of these particular two residues. The populations (in percentages) of the different conformations are given in Table S2. The most relevant conformations are obtained by combining F and α states (both cis and trans) for Pro with F and β states for X, i.e., all other possible patterns represent only 0–3% of the population, except for Gly. As illustrated in Fig. 2, Gly results are very scattered and therefore these other patterns account for 55% of the total. It is clear that not only is the F content of the guest low, but also that its β content is relatively high, in agreement with Table S1. For instance, the contents for these guests are 23% F and 77% β for PQP; 10% F and 87% β for PDP; 21% F and 77% β for PAP; and 20% F and 81% β for PVP.
Proline-guest correlation
Because P3 and the guest residue X show the most significant variation in terms of the F and PPII content, it is natural to explore the correlation between the two neighboring residues. Here, we conveniently express the correlation in terms of the OR construction reviewed in the Methods, although other approaches are also possible (48).
Given the wealth of the HT-REMD data, we have carried out a full population analysis, and calculated important conditional probabilities and OR numbers (for qualitative insight into the P3–X correlation, please see the Supporting Material). For instance, one can calculate the probability of X ∈ F (via the explained fitting technique), given that P3 ∈ F or P3 ∈ α. These are conditional probabilities, It is also possible to take into account the cis/trans isomerization of the P3 residue. Thus one can find the probability of X ∈ F conditioned on P3 being in four different conformations denoted as Ft (or PPII), Fc (or PPI), αt, and αc. All these conditional probabilities for all PXP peptides (X ≠ P) are presented in the second and third columns in Table 3.
One possible measure of the correlation is to take the ratio of these conditional probabilities. Considering the second column in Table 3, the results range from PQP at the top of the list with a 51:14 ratio and a 66% experimental value for PPII content, to PVP close to the bottom with a 23:19 ratio and 49% experimentally observed value. We note here that because of technical complications, there is no experimental data available for PYP or PWP peptides (25), although we have no trouble measuring their correlations with our HT-REMD simulations. Now consider the third column in Table 3. A comparison between the αt and αc data shows that the conditional probability for αc is less than half of αt, indicating that an αc proline reduces the probability of a guest PPII conformation considerably. Thus, populations of αcF vary between 0% and 5%, while populations of αtF vary between 5% and 20% (Table S2).
Considering that the relevant populations for P3X are as given in Table S2, we calculate the OR based on two properties chosen as follows:
We set the property to be 1 [0] (see The Odds Ratio, above), as (P3 ∈ F) [(P3 ∉ F)] for the first index and (X ∈ F) [(X ∉ F)] for the second index. Thus,
If we discard the conformations whose populations are negligible, we are simply left with
If we consider the cis/trans states and look for the PPII (Ft) content, then
Numbers for both OR and ΔΔG = log(OR) are given in Table 3, which list PXP and PXP′ results next to each other; the other entries are ranked according to ΔΔG (PPII) values. Although the values for PXP and PXP′ differ slightly, in terms of proline-guest correlation, the behavior of PXP′ peptides is similar to that of the PXP ones.
Discussion
Overall, our results are in qualitative agreement with the experiments. The far-UV CD spectrum of PPP has a maximum at 228 nm which signals the presence of a left-handed PPII helical conformation, and a minimum at 205 nm which may be considered characteristic of this conformation as well, but only in conjunction with the maximum because disordered peptides also possess a minimum in this region of the spectrum, making it a poor choice for determining the PPII helical content (25). It is therefore assumed that the percentage of PPII helical content is proportional to the maximum molar ellipticity at 228 nm. As such, this involves some simplifications as readily acknowledged by the authors (24). Thus, when making comparisons between the experimental and the simulation data such as shown in Fig. 3 (for instance), it is sensible to say that our ΔΔG correlates linearly with the maximum molar ellipticity (which is related to PPII content, but is not exactly proportional to it).
While we are encouraged by the qualitative agreement with the experimental results, our interpretation of these results is rather different. First, we consider how the experimental notion of an intrinsic PPII propensity in the case of Ala comes about (24). Because the CD spectra only reflect statistical ensemble averages, it is not possible to uniquely infer the properties of individual residues from these averages, unless some assumptions are made. In brief, it is assumed that:
-
1.
From the CD measurements for PPII content, it is estimated that a well-behaved PPII residue will contribute ∼11% to the overall PPII content. Thus, a lower bound of the PPII content will be 44%, attributed to the contributions of P1,2,4,5.
-
2.
Because the proline closest to the C-terminal (i.e., residue P6) is not restricted by a following proline, it is assumed that this residue is free to adopt any conformation available to proline. Thus, the expectation is that P6 does not contribute much to the overall PPII content.
-
3.
The C-terminal Tyr is not expected to contain any significant PPII content, while the case of the C-terminal Gly is unclear.
-
4.
Alanine is not expected to have much effect on its preceding proline. Thus, the P3 residue is expected to adopt all conformations generally accessible to proline, unless long-range interactions (which extend beyond the nearest neighbor residues) favor a PPII helical conformation. The latter is not considered as a possibility.
-
5.
Because the experimentally measured PPII content is 61% for PAP, of which 44% is accounted for by P1, P2, P4, and P5, and because all the other residues are not expected to make any significant contribution to the PPII content, “one is left to conclude that an isolated alanine has a high propensity to adopt this conformation” (24).
By contrast, simulations can produce extensive and accurate statistical data on each residue, and therefore serve to highlight the pitfalls of inferring individual system properties from a statistical ensemble average. Consider the F (PPII) content of PAP at 27°C, which was found to be 57% (48%), respectively.
How do our observations differ from those of the experiments?
-
1.
Indeed, residues P1, P2, P4, and P5 all make similar contributions. These are 11% (9%) per residue, and therefore account for 77% (63%) of the total F (PPII) content of the PAP peptide at 27°C.
-
2.
Residue P6 contributes 4.4% (4%); or 7.8% (8.3%) of the total peptide F (PPII) content.
-
3.
The C-terminal Tyr also has a considerable PPII content: 4% for the residue, which represents 8.3% of total peptide PPII content. However, the C-terminal Gly has a negligible PPII content: 0.5% for the residue, which represents 1% of total peptide PPII content.
-
4.
Residue P3 contributes 2% (1.4%), which represents 3.5% (2.9%) of the total peptide F (PPII) content.
-
5.
Finally, the Ala residue contributes only 2.3%, or 4.8% to the total peptide PPII content.
In other words, when each residue is considered individually, then the contribution of the Ala guest to the overall PPII content of the peptide is seen to be relatively modest, in agreement with the previous calculations of Vila et al. (16). Indeed, as already noted, for PAP only 21% of the guest Ala is to be found in the F region, while 77% is found in the β-region.
So, rather than invoking an intrinsic PPII propensity for the guest residues, we argue that the behavior of amino acids in a proline host environment may be explained in terms of the following two properties which so far have not been considered:
-
1.
A local correlation between the dihedral angles of residues P3 and X, which may be described in terms of an OR.
-
2.
A nonlocal correlation between the cis/trans conformers of the peptide bonds.
By using the word “correlation”, we clearly mean not an intrinsic property of the guest amino acid itself, but a property of the guest in the context that the guest finds itself (49).
Turning to the local correlations between residues P3 and X, we note that these are quantified by OR (or equivalently ΔΔG) results. As may be expected, the OR computed for the F and PPII contents track each other reasonably well. Based on the numerical values, one can classify the guests as having strong, intermediate, or weak correlations by means of (arbitrary) introduced cutoffs. Using the PPII-based OR, we define guests as being strongly correlated if their OR > 2. Guests with intermediate correlations are those with 1 < OR ≤ 2; and weakly correlated guests are those with 0 < OR ≤ 1.
Table 4 summarizes the resulting grouping of guest amino acids according to their nature. Typically, negatively charged amino acids, positively charged Lys, and the polar amino acids Gln and Ser make for highly correlated guests, while the rest of the polar amino acids and Arg are guests with intermediate correlations. Hydrophobic amino acids result in guests of intermediate or weak correlations, except for Gly and the small hydrophobic amino acid Ala, which show quite strong P3-X correlations. For those amino acids whose OR falls near the cutoffs, the character of the correlation should only be taken as indicative, because their classification is obviously sensitive to the chosen cutoffs, which may be altered, for instance, in the presence of explicit waters. Finally, we note that an OR less than unity indicates a de facto anticorrelation, as observed for instance in Tyr.
We have compared the experimental PPII content (25) against the corresponding ΔΔG values based on PPII for the PXP peptides (see the Supporting Material for a brief discussion of other measures of P3–X correlations). Specifically, Fig. 3 shows a linear correlation between the two data sets, with a correlation coefficient of R = 0.85. We note that this correlation—which is strictly based on the P3-X OR—does not include any nonlocal cis/trans isomerization effects. By contrast, the average PPII content from the HT-REMD simulations as reported in Table 1 does not reflect a strong correlation with either the experimental CD-based PPII contents or our computed P3-X correlations based on ΔΔG.
With respect to the trans content, given as a percentage in Table 2, the peptide with the least trans content belongs to PPP (71%) because its central guest proline can easily take on the cis conformation (36,50). Indeed the trans population of the P3–P bonds is only 51%. We find that the presence of the guest (except when X is Pro, Tyr, or Trp) increases the trans content in the prolyl bonds of the individual peptides, and this content is increased even more when a second guest is added. The increase in the total trans content for each peptide is due to both a local effect (switching the guest P by any other amino acid eliminates the residue with highest cis content in PPP), and a nonlocal effect, because the PPII contents of most of the prolyl bonds also increases. For instance, in PQP every single prolyl bond except that associated with P2–P3 increases its trans content with respect to PPP.
For a visual illustration of this effect, see Fig. S6. Thus, instead of contributing to an intrinsic PPII propensity, the guest amino acids bring in their own intrinsic trans propensity with the net effect of diminishing the number of cis bonds and thereby de facto increasing the PPII content of the peptide.
Finally, for a truly quantitative comparison between the experimental data (25) and our computed data, one needs to take into account that the experimental values of Rucker et al. (25) are for T = 5°C, while our calculated results are for T = 27°C. While the experimental values at this temperature are not known individually, the trends show that:
-
1.
The difference in PPII content between PPP and the other PXP peptides increases with increasing temperatures, so that at higher temperatures, one can expect a 5–10% difference between the PPII contents of PPP and the other host-guest peptides.
-
2.
The PPII content decreases for all PXP peptides with increasing temperature. Given these differences, we believe that there is reasonable agreement in the trends observed between the available experimental data and our computed PPII content.
Conclusions
In summary, we have investigated the structural characteristics of proline-based oligopeptides in a host-guest setting. Specifically, the equilibrium structures of PXP and PXP′ peptides, as obtained from HT-REMD simulations, were analyzed. The features probed include the cis/trans isomerization of the prolyl bonds, the puckering of the pyrrolidine rings of the proline residues, and the secondary structural motifs associated with the distribution of dihedral angles of the Ramachandran plots for each residue. The cis/trans isomerization of each peptide structure was explicitly tracked when calculating the PPII content. We do not find significant evidence of an intrinsic PPII propensity for the guest amino acids.
The experimentally observed changes in the height of the maximum molar ellipticity at 228 nm of the CD spectra, assumed proportional to the PPII content, may be explained in terms of the following observations:
-
1.
Steric interactions produced by the proline rings (34,38) cause a given proline to restrict the preceding residue to 50 < ψ < 180 (except for Gly), forcing the preceding residue to be in either a β- or F region, according to the value of ϕ.
-
2.
The net increase in prolyl trans content introduced by guests (other than Pro, Tyr, and Trp) in the host peptide precludes some of the PPP cis isomers and effectively results in a net (trans) PPII increase.
-
3.
There is a local correlation between the dihedral angles of the guest, and the proline residue immediately preceding the guest. It is natural to probe the P3–X correlations with an OR analysis.
The latter is specifically designed to describe the strength of association between two binary variables, and may be thought of as characteristic conformational property (such as the cis/trans states) of these peptides. In terms of the P3-X OR results, the guests may be roughly divided into three categories that depend on the nature of the amino acid. There is a good positive linear correlation between the ΔΔG numbers based on the P3-X OR analysis and the experimental CD spectroscopy results.
Acknowledgments
We thank the NC State HPC Center for extensive computational support.
This research was supported by the National Science Foundation (FRG-0804549 and 1021883).
Contributor Information
Celeste Sagui, Email: sagui@ncsu.edu.
Christopher Roland, Email: cmroland@ncsu.edu.
Supporting Material
References
- 1.Adzhubei A.A., Sternberg M.J.E. Left-handed polyproline II helices commonly occur in globular proteins. J. Mol. Biol. 1993;229:472–493. doi: 10.1006/jmbi.1993.1047. [DOI] [PubMed] [Google Scholar]
- 2.Tiffany M.L., Krimm S. New chain conformations of poly(glutamic acid) and polylysine. Biopolymers. 1968;6:1379–1382. doi: 10.1002/bip.1968.360060911. [DOI] [PubMed] [Google Scholar]
- 3.Tiffany M.L., Krimm S. Extended conformations of polypeptides and proteins in urea and guanidine hydrochloride. Biopolymers. 1973;12:575–587. [Google Scholar]
- 4.Shi Z., Olson C.A., Kallenbach N.R. Polyproline II structure in a sequence of seven alanine residues. Proc. Natl. Acad. Sci. USA. 2002;99:9190–9195. doi: 10.1073/pnas.112193999. [DOI] [PMC free article] [PubMed] [Google Scholar]
- 5.Shi Z., Woody R.W., Kallenbach N.R. Is polyproline II a major backbone conformation in unfolded proteins? Adv. Protein Chem. 2002;62:163–240. doi: 10.1016/s0065-3233(02)62008-x. [DOI] [PubMed] [Google Scholar]
- 6.Mohana-Borges R., Goto N.K., Wright P.E. Structural characterization of unfolded states of apomyoglobin using residual dipolar couplings. J. Mol. Biol. 2002;340:1131–1142. doi: 10.1016/j.jmb.2004.05.022. [DOI] [PubMed] [Google Scholar]
- 7.Keiderling T.A., Xu Q. Unfolded peptides and proteins studied with infrared absorption and vibrational CD spectra. Adv. Protein Chem. 2002;62:91–162. doi: 10.1016/s0065-3233(02)62007-8. [DOI] [PubMed] [Google Scholar]
- 8.Barron L.D., Blanch E.W., Hecht L. Unfolded proteins studied by Raman optical activity. Adv. Protein Chem. 2002;62:51–90. doi: 10.1016/s0065-3233(02)62005-4. [DOI] [PubMed] [Google Scholar]
- 9.Mezei M., Fleming P.J., Rose G.D. Polyproline II helix is the preferred conformation for unfolded polyalanine in water. Proteins. 2004;55:502–507. doi: 10.1002/prot.20050. [DOI] [PubMed] [Google Scholar]
- 10.Graf J., Nguyen P.H., Schwalbe H. Structure and dynamics of the homologous series of alanine peptides: a joint molecular dynamics/NMR study. J. Am. Chem. Soc. 2007;129:1179–1189. doi: 10.1021/ja0660406. [DOI] [PubMed] [Google Scholar]
- 11.Schweitzer-Stenner R. Distribution of conformations sampled by the central amino acid residue in tripeptides inferred from amide I band profiles and NMR scalar coupling constants. J. Phys. Chem. B. 2009;113:2922–2932. doi: 10.1021/jp8087644. [DOI] [PubMed] [Google Scholar]
- 12.Duan Y., Wu C., Kollman P. A point-charge force field for molecular mechanics simulations of proteins based on condensed-phase quantum mechanical calculations. J. Comput. Chem. 2003;24:1999–2012. doi: 10.1002/jcc.10349. [DOI] [PubMed] [Google Scholar]
- 13.Ferreon J.C., Hilser V.J. Ligand-induced changes in dynamics in the RT loop of the C-terminal SH3 domain of Sem-5 indicate cooperative conformational coupling. Protein Sci. 2003;12:982–996. doi: 10.1110/ps.0238003. [DOI] [PMC free article] [PubMed] [Google Scholar]
- 14.Kohn J.E., Millett I.S., Plaxco K.W. Random-coil behavior and the dimensions of chemically unfolded proteins. Proc. Natl. Acad. Sci. USA. 2004;101:12491–12496. doi: 10.1073/pnas.0403643101. [DOI] [PMC free article] [PubMed] [Google Scholar]
- 15.McColl I.H., Blanch E.W., Barron L.D. Vibrational Raman optical activity characterization of poly(l-proline) II helix in alanine oligopeptides. J. Am. Chem. Soc. 2004;126:5076–5077. doi: 10.1021/ja049271q. [DOI] [PubMed] [Google Scholar]
- 16.Vila J.A., Baldoni H.A., Scheraga H.A. Polyproline II helix conformation in a proline-rich environment: a theoretical study. Biophys. J. 2004;86:731–742. doi: 10.1016/S0006-3495(04)74151-X. [DOI] [PMC free article] [PubMed] [Google Scholar]
- 17.Vila J.A., Baldoni H.A., Scheraga H.A. Fast and accurate computation of the 13C chemical shifts for an alanine-rich peptide. Proteins. 2004;57:87–98. doi: 10.1002/prot.20177. [DOI] [PubMed] [Google Scholar]
- 18.Zagrovic B., Lipfert J., Pande V.S. Unusual compactness of a polyproline type II structure. Proc. Natl. Acad. Sci. USA. 2005;102:11698–11703. doi: 10.1073/pnas.0409693102. [DOI] [PMC free article] [PubMed] [Google Scholar]
- 19.Makowska J., Rodziewicz-Motowidło S., Scheraga H.A. Polyproline II conformation is one of many local conformational states and is not an overall conformation of unfolded peptides and proteins. Proc. Natl. Acad. Sci. USA. 2006;103:1744–1749. doi: 10.1073/pnas.0510549103. [DOI] [PMC free article] [PubMed] [Google Scholar]
- 20.Makowska J., Rodziewicz-Motowidło S., Scheraga H.A. Further evidence for the absence of polyproline II stretch in the XAO peptide. Biophys. J. 2007;92:2904–2917. doi: 10.1529/biophysj.106.097550. [DOI] [PMC free article] [PubMed] [Google Scholar]
- 21.Best R.B., Buchete N., Hummer G. Are current molecular dynamics force fields too helical? Biophys. J. Biophys. Lett. 2008;95:L07–L09. doi: 10.1529/biophysj.108.132696. [DOI] [PMC free article] [PubMed] [Google Scholar]
- 22.Mukhopadhyay P., Zuber G., Beratan D.N. Characterizing aqueous solution conformations of a peptide backbone using Raman optical activity computations. Biophys. J. 2008;95:5574–5586. doi: 10.1529/biophysj.108.137596. [DOI] [PMC free article] [PubMed] [Google Scholar]
- 23.Petrella E.C., Machesky L.M., Pollard T.D. Structural requirements and thermodynamics of the interaction of proline peptides with profilin. Biochemistry. 1996;35:16535–16543. doi: 10.1021/bi961498d. [DOI] [PubMed] [Google Scholar]
- 24.Kelly M.A., Chellgren B.W., Creamer T.P. Host-guest study of left-handed polyproline II helix formation. Biochemistry. 2001;40:14376–14383. doi: 10.1021/bi011043a. [DOI] [PubMed] [Google Scholar]
- 25.Rucker A.L., Pager C.T., Creamer T.P. Host-guest scale of left-handed polyproline II helix formation. Proteins. 2003;53:68–75. doi: 10.1002/prot.10477. [DOI] [PubMed] [Google Scholar]
- 26.Chellgren B.W., Creamer T.P. Short sequences of non-proline residues can adopt the polyproline II helical conformation. Biochemistry. 2004;43:5864–5869. doi: 10.1021/bi049922v. [DOI] [PubMed] [Google Scholar]
- 27.Chellgren B.W., Creamer T.P. Effects of H2O and D2O on polyproline II helical structure. J. Am. Chem. Soc. 2004;126:14734–14735. doi: 10.1021/ja045425q. [DOI] [PubMed] [Google Scholar]
- 28.Whittington S.J., Chellgren B.W., Creamer T.P. Urea promotes polyproline II helix formation: implications for protein denatured states. Biochemistry. 2005;44:6269–6275. doi: 10.1021/bi050124u. [DOI] [PubMed] [Google Scholar]
- 29.Chellgren B.W., Miller A.F., Creamer T.P. Evidence for polyproline II helical structure in short polyglutamine tracts. J. Mol. Biol. 2006;361:362–371. doi: 10.1016/j.jmb.2006.06.044. [DOI] [PubMed] [Google Scholar]
- 30.Chakrabartty A., Kortemme T., Baldwin R.L. Helix propensities of the amino acids measured in alanine-based peptides without helix-stabilizing side-chain interactions. Protein Sci. 1994;3:843–852. doi: 10.1002/pro.5560030514. [DOI] [PMC free article] [PubMed] [Google Scholar]
- 31.Lyu P.C., Liff M.I., Kallenbach N.R. Side chain contributions to the stability of α-helical structure in peptides. Science. 1990;250:669–673. doi: 10.1126/science.2237416. [DOI] [PubMed] [Google Scholar]
- 32.Smith C.K., Withka J.M., Regan L. A thermodynamic scale for the β-sheet forming tendencies of the amino acids. Biochemistry. 1994;33:5510–5517. doi: 10.1021/bi00184a020. [DOI] [PubMed] [Google Scholar]
- 33.Minor D.L., Jr., Kim P.S. Context is a major determinant of β-sheet propensity. Nature. 1994;371:264–267. doi: 10.1038/371264a0. [DOI] [PubMed] [Google Scholar]
- 34.MacArthur M.W., Thornton J.M. Influence of proline residues on protein conformation. J. Mol. Biol. 1991;218:397–412. doi: 10.1016/0022-2836(91)90721-h. [DOI] [PubMed] [Google Scholar]
- 35.Moradi M., Babin V., Sagui C. Conformations and free energy landscapes of polyproline peptides. Proc. Natl. Acad. Sci. USA. 2009;106:20746–20751. doi: 10.1073/pnas.0906500106. [DOI] [PMC free article] [PubMed] [Google Scholar]
- 36.Moradi M., Babin V., Sagui C. A classical molecular dynamics investigation of the free energy and structure of short polyproline conformers. J. Chem. Phys. 2010;133:125104. doi: 10.1063/1.3481087. [DOI] [PubMed] [Google Scholar]
- 37.Moradi M., Lee J.-G., Sagui C. Free energy and structure of polyproline peptides: an ab initio and classical molecular dynamics investigation. Int. J. Quantum Chem. 2010;110:2865–2879. doi: 10.1063/1.3481087. [DOI] [PubMed] [Google Scholar]
- 38.Creamer T.P. Left-handed polyproline II helix formation is (very) locally driven. Proteins. 1998;33:218–226. [PubMed] [Google Scholar]
- 39.Edwards A.W.F. The measure of association in a 2 × 2 table. J. R. Stat. Soc. [Ser A] 1963;126:109–114. [Google Scholar]
- 40.Babin V., Roland C., Sagui C. Adaptively biased molecular dynamics for free energy calculations. J. Chem. Phys. 2008;128:134101. doi: 10.1063/1.2844595. [DOI] [PubMed] [Google Scholar]
- 41.Geyer C.J. Computing Science and Statistics: The 23rd Symposium on the Interface. Interface Foundation; Fairfax, VA: 1991. Markov chain Monte Carlo maximum likelihood; pp. 156–163. [Google Scholar]
- 42.Onufriev A., Bashford D., Case D.A. Modification of the generalized Born model suitable for macromolecules. J. Phys. Chem. B. 2000;104:3712–3720. [Google Scholar]
- 43.Onufriev A., Bashford D., Case D.A. Exploring protein native states and large-scale conformational changes with a modified generalized Born model. Proteins. 2004;55:383–394. doi: 10.1002/prot.20033. [DOI] [PubMed] [Google Scholar]
- 44.Hornak V., Abel R., Simmerling C. Comparison of multiple AMBER force fields and development of improved protein backbone parameters. Proteins. 2006;65:712–725. doi: 10.1002/prot.21123. [DOI] [PMC free article] [PubMed] [Google Scholar]
- 45.Doshi U., Hamelberg D. Reoptimization of the AMBER force field parameters for peptide bond (ω) torsions using accelerated molecular dynamics. J. Phys. Chem. B. 2009;113:16590–16595. doi: 10.1021/jp907388m. [DOI] [PubMed] [Google Scholar]
- 46.Zimmerman S.S., Pottle M.S., Scheraga H.A. Conformational analysis of the 20 naturally occurring amino acid residues using ECEPP. Macromolecules. 1977;10:1–9. doi: 10.1021/ma60055a001. [DOI] [PubMed] [Google Scholar]
- 47.Vila J.A., Serrano P., Scheraga H.A. Sequential nearest-neighbor effects on computed 13Cα chemical shifts. J. Biomol. NMR. 2010;48:23–30. doi: 10.1007/s10858-010-9435-7. [DOI] [PMC free article] [PubMed] [Google Scholar]
- 48.Cossio P., Marinelli F., Pietrucci F. Optimizing the performance of bias-exchange metadynamics: folding a 48-residue LysM domain using a coarse-grained model. J. Phys. Chem. B. 2010;114:3259–3265. doi: 10.1021/jp907464b. [DOI] [PubMed] [Google Scholar]
- 49.Beck D.A.C., Alonso D.O.V., Daggett V. The intrinsic conformational propensities of the 20 naturally occurring amino acids and reflection of these propensities in proteins. Proc. Natl. Acad. Sci. USA. 2008;105:12259–12264. doi: 10.1073/pnas.0706527105. [DOI] [PMC free article] [PubMed] [Google Scholar]
- 50.Tanaka S., Scheraga H.A. Calculation of conformational properties of oligomers of L-proline. Macromolecules. 1974;7:698–705. doi: 10.1021/ma60041a029. [DOI] [PubMed] [Google Scholar]
Associated Data
This section collects any data citations, data availability statements, or supplementary materials included in this article.