

Abstract
Here we report on a method to track individual molecules on nanometer length and microsecond timescales using an optical microscope. Our method is based on double-labeling of a molecule with two spectrally distinct fluorophores and illuminating it with laser pulses of different wavelengths that partially overlap temporally. We demonstrate our method by using it to resolve the motion of short DNA oligomers in solution down to a timescale of 100 μs.
A persistent challenge in biophysics is measuring the motion of single biomolecules on short length scales and timescales (1). Recent advances in superresolution techniques (2–5) have pushed the resolution limit of optical microscopes down to the nanometer range. However, these techniques are severely limited in their temporal resolution because they either require scanning the sample (as in stimulated emission depletion microscopy) or acquiring stochastically occurring signals (as in stochastic reconstruction microscopy) (STORM) and photoactivation localization microscopy (2). Hence, they cannot access the fast dynamic interaction of mobile biomolecules with nanometer-sized structures. For example, the interaction of a lipid molecule diffusing in a cell membrane (diffusion coefficient D ≈ 1 μm2/s) with a membrane substructure that has a characteristic length L of ∼50 nm occurs on a timescale t ≈ L2/4D ≈ 1 ms. Consequently, observing the interaction of molecules with nanometer-sized structures requires techniques with submillisecond temporal resolution.
Here we present what is, to our knowledge, a new camera-based, thus highly parallel, single-molecule tracking (SMT) method that fulfills this requirement. The two major factors which determine the temporal resolution of camera-based SMT (6) are the acquisition speed of the charge-coupled device (CCD) camera and the illumination time necessary to detect the optical probe. During the illumination time, the probe must emit enough photons to be detected above the read-out noise of the camera. At the same time, the read-out noise generally increases with the read-out speed of the camera. Consequently, SMT on microsecond timescales could so far only be realized with colloidal gold probes (7) or highly elaborate optical detection schemes (8–10). Although colloidal probes are bright and optically stable, they are not optimal for biological applications because of their large size and unspecific binding issues. Existing fast detection schemes for single molecules can only track one molecule at a time (8–10) or have a small field of view (10).
In contrast, our method uses small fluorophores in combination with a simple detection scheme—a slow-scan, low readout-noise CCD camera system—to achieve microsecond single-molecule tracking (μsSMT). μsSMT is comparable to STORM in that it uses two fluorescent probes on a single molecule. In contrast to STORM, these probes are placed so far apart that no energy transfer can take place between them and thus the two are excited separately.
The emitted signal of the two fluorophores is collected onto separate regions of a CCD chip with the help of a dichroic wedge (see Fig. S1 in the Supporting Material). In this way, the two fluorophores are separately excited and their fluorescent signals recorded independently of each other. Therefore, we can resolve the position of a single molecule with a nanometer resolution at two different points in time.
To demonstrate our method, we used short DNA-oligonucleotides in solution that were labeled with two fluorophores, Cy3B and ATTO647N. These probes were then separately illuminated by two lasers at wavelengths of 514 nm and 639 nm, respectively, during a certain illumination time till. The pulses of the two lasers were temporally offset by a small time lag Δt (see Fig. 1 a). In principle, we can make Δt arbitrarily small. The actual temporal resolution achievable in practice is primarily determined by the molecule's diffusion coefficient, the accuracy with which we can determine the molecular positions, and the total number of single-molecule positions measured.
Figure 1.
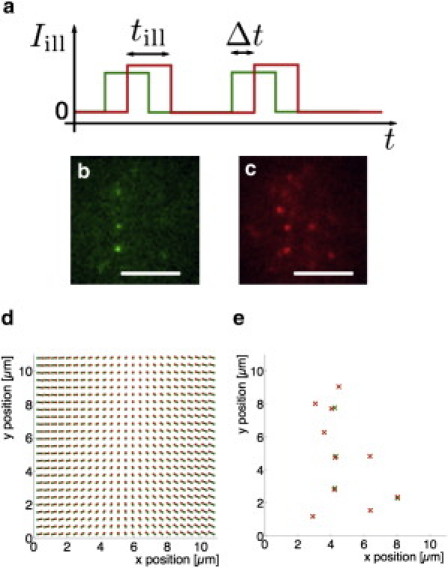
Illumination scheme and position determination. (a) Laser pulses of duration till are temporally offset by a time lag Δt. (b) Raw image from the Cy3B channel. (c) Raw image from the ATTO647N channel. Δt = 0 ms. Scale bar is 5 μm. (d) Correction for chromatic aberration. The scheme shows positions in the Cy3B (green dots) and ATTO647N (red dots) channel which correspond to the same physical positions. (e) Identified single-molecule signals from the images shown in panels b and c, corrected for chromatic aberration.
Because the illumination time was finite, we did not measure the actual positions of the molecule. Instead, our method measured the positions
averaged over the illumination time till. Due to this temporal averaging, the mean squared-displacement (MSD) calculated from measured positions was different from the actual MSD of the molecule (11). For ergodic and stationary processes there is, however, a simple relation between the observed (averaged) and the actual MSD of the molecule
| (1) |
Because the microscope projects the three-dimensional movement of the molecules in solution onto a two-dimensional plane,
For regular diffusion, Eq. 1 was evaluated analytically (see the Supporting Material for the derivation of the general relation and the analytical evaluation).
| (2) |
Below we will show that the measured indeed behaved as predicted by Eq. 2.
The calculation of a molecule's MSD requires the determination of its position. In our experiments, we chose a low density of molecules such that molecules were resolved individually and their position determined with nm positional accuracy (6). Fig. 1 illustrates the process of position determination. Fig. 1, b and c, shows typical raw signals from several molecules dual-labeled with Cy3B (Fig. 1 b) and ATTO647N (Fig. 1 c). The positions of the fluorophores were determined by fitting two-dimensional Gaussians approximating the point-spread function of the microscope. The positional accuracy achieved was between 40 and 50 nm (see the Supporting Material). Because the signals from the two fluorophores labeling the single molecule had to be correlated, eliminating chromatic aberration was important. We established the correspondence between the two signals by using fluorescent beads which were observable in both channels. Fig. 1 d shows the corrective shifts which were applied to the signals in the green (or red) channel, respectively. Fig. 1 e shows the single-molecule positions determined from Fig. 1, b and c, and corrected for chromatic aberration. Note that due to the finite labeling efficiency and bleaching, some molecules carried no or only one of the labels.
To determine the MSD of the molecules, we correlated the positions that were measured in the two detection channels by particle image cross-correlation spectroscopy (PICCS, see the Supporting Material), an extension of particle image correlation spectroscopy (PICS) (12). Because PICCS relies on highly accurate detection of single-molecule positions, our method is not diffraction-limited and unaffected by autofluorescence and noise, both of which are common problems faced in the conventional imaging methods. Fig. 2 shows a comparison of MSDs obtained experimentally under different solvent and illumination conditions. Equation 2 fits the experimental data in all cases. The inset table in Fig. 2 compares the diffusion coefficients determined from the fit. As to be expected, the diffusion coefficient decreased with increasing amount of dextran T500 corresponding to an increased viscosity.
Figure 2.
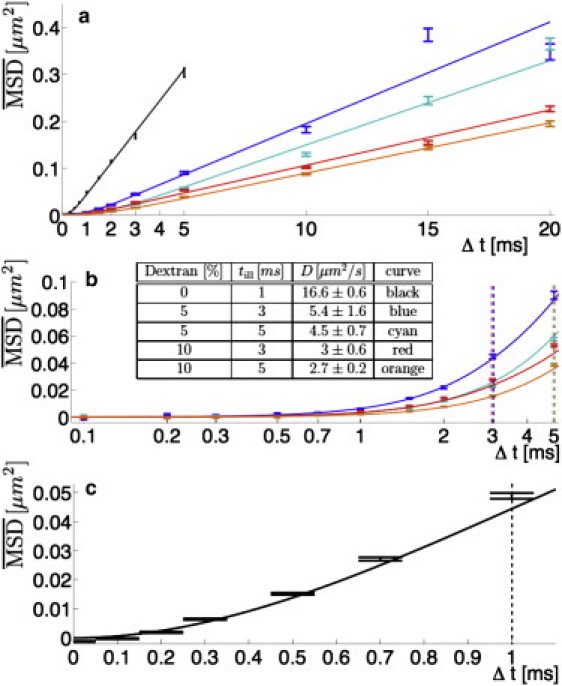
Experimentally obtained MSDs of DNA with different solvent and illumination conditions. In phosphate-buffered saline (PBS), till = 1 ms (black), in 5% dextran T500/PBS; till = 3 ms (blue), in 5% dextran T500/PBS; till = 5 ms (cyan), in 10% dextran T500/PBS; till = 3 ms (red), in 10% dextran T500/PBS; and till = 5 ms (orange). Equation 2 was fit to the data for each experimental condition (solid lines). (Vertical dashed lines) Illumination time for the respective experiment. (Error bars) Standard deviations of Monte Carlo simulations performed with the measured parameters (see the Supporting Material). (a) Comparison of all conditions, linear timescale. Above till, all MSDs are linear. (b) Comparison of the measurements in dextran T500 at short time lags Δt, logarithmic timescale. Below till, the MSDs show the predicted asymptotic behavior. (Inset) Measured diffusion coefficients for all conditions. The reported errors are the errors of the fit to Eq. 2. (c) MSD on short time lags for the measurement in PBS. The MSD has data points for Δt < till = 1 ms, which are significantly different from 0 μm2.
Compared to the situation without the dextran, the diffusion coefficient decreased by a factor of 3.4 ± 0.9 in the solution with 5% dextran T500 and by a factor of 5.8 ± 1.0 in the solution with 10% dextran T500 (see inset table in Fig. 2 b). We confirmed our results by independent fluorescence correlation spectroscopy measurements (see the Supporting Material) of the same DNA construct in the same solvents in which we found factors of 3.20 ± 0.04 and 6.05 ± 0.06 between the corresponding diffusion times, respectively. Interestingly, the diffusion coefficient did not scale with the bulk kinematic viscosity which increased by a factor of 6.2 ± 0.1 in the solution with 5% dextran T500 and by a factor of 20.9 ± 0.2 in the solution with 10% dextran T500, as determined by bulk viscosity measurements. This deviation probably reflects the fact that solvent and solute molecules were comparable in size for which the Stokes-Einstein relation is invalid.
For nonoverlapping laser pulses (Δt > till), the observed MSD was shifted down by (4/3) Dtill (see Fig. 2 a), in agreement with earlier results (11). For overlapping laser pulses (Δt ≤ till), the MSD was clearly nonlinear and approached 0 for Δt → 0. The temporal dependence followed the prediction given by Eq. 2 (see Fig. 2 b). Most importantly, as shown in Fig. 2 c, we were able to measure MSD curves down to Δt = 100 μs, significantly faster than reported so far, which proved that we extended single-molecule tracking experiments to the microsecond regime.
Our method may be further improved by eliminating the need for double labeling. Given that the fluorescent probe is bright enough, the emitted light could be split between two cameras that can be individually exposed. If the exposure of the two cameras is offset by a lag time Δt, the same kind of analysis as described here can be performed with only a single fluorescent label.
Finally, μsSMT can be easily adapted for measurements in cells. For example, a membrane receptor could be labeled with two genetically encoded tags, one at a cytosolic domain, and one extracellular. The separation of the two labels by the cell membrane would prevent energy transfer between the fluorophores. Because only low laser intensities are required, the method is suitable for live cell recordings. Consequently, our method will likely aid in providing what we believe will be new insights into the dynamic behavior of molecules in cells on very short length- and timescales.
Acknowledgments
The authors thank Ruth Buning for help with the fluorescence correlation spectroscopy measurements, John van Noort for the DNA construct, Martin van Hecke for help with the bulk viscosity measurements, and Hyun Youk for critical reading of the manuscript.
This work is part of the research program of the Stichting voor Fundamenteel Onderzoek der Materie (FOM), which is financially supported by the Nederlandse Organisatie voor Wetenschappelijk Onderzoek (NWO) within the program on Material Properties of Biological Assemblies (under grant No. FOM-L1707M).
Supporting Material
References and Footnotes
- 1.Semrau S., Schmidt T. Membrane heterogeneity—from lipid domains to curvature effects. Soft Matter. 2009;5:3174–3186. [Google Scholar]
- 2.Hell S.W. Microscopy and its focal switch. Nat. Methods. 2009;6:24–32. doi: 10.1038/nmeth.1291. [DOI] [PubMed] [Google Scholar]
- 3.Rust M.J., Bates M., Zhuang X. Sub-diffraction-limit imaging by stochastic optical reconstruction microscopy (STORM) Nat. Methods. 2006;3:793–795. doi: 10.1038/nmeth929. [DOI] [PMC free article] [PubMed] [Google Scholar]
- 4.Betzig E., Patterson G.H., Hess H.F. Imaging intracellular fluorescent proteins at nanometer resolution. Science. 2006;313:1642–1645. doi: 10.1126/science.1127344. [DOI] [PubMed] [Google Scholar]
- 5.Hess S.T., Girirajan T.P.K., Mason M.D. Ultra-high resolution imaging by fluorescence photoactivation localization microscopy. Biophys. J. 2006;91:4258–4272. doi: 10.1529/biophysj.106.091116. [DOI] [PMC free article] [PubMed] [Google Scholar]
- 6.Schmidt T., Schütz G.J., Schindler H. Imaging of single molecule diffusion. Proc. Natl. Acad. Sci. USA. 1996;93:2926–2929. doi: 10.1073/pnas.93.7.2926. [DOI] [PMC free article] [PubMed] [Google Scholar]
- 7.Tomishige M., Sako Y., Kusumi A. Regulation mechanism of the lateral diffusion of band 3 in erythrocyte membranes by the membrane skeleton. J. Cell Biol. 1998;142:989–1000. doi: 10.1083/jcb.142.4.989. [DOI] [PMC free article] [PubMed] [Google Scholar]
- 8.McHale K., Berglund A.J., Mabuchi H. Quantum dot photon statistics measured by three-dimensional particle tracking. Nano Lett. 2007;7:3535–3539. doi: 10.1021/nl0723376. [DOI] [PubMed] [Google Scholar]
- 9.Cang H., Xu C.S., Yang H. Progress in single-molecule tracking spectroscopy. Chem. Phys. Lett. 2008;457:285–291. [Google Scholar]
- 10.Sahl S.J., Leutenegger M., Eggeling C. Fast molecular tracking maps nanoscale dynamics of plasma membrane lipids. Proc. Natl. Acad. Sci. USA. 2010;107:6829–6834. doi: 10.1073/pnas.0912894107. [DOI] [PMC free article] [PubMed] [Google Scholar]
- 11.Goulian M., Simon S.M. Tracking single proteins within cells. Biophys. J. 2000;79:2188–2198. doi: 10.1016/S0006-3495(00)76467-8. [DOI] [PMC free article] [PubMed] [Google Scholar]
- 12.Semrau S., Schmidt T. Particle image correlation spectroscopy (PICS): retrieving nanometer-scale correlations from high-density single-molecule position data. Biophys. J. 2007;92:613–621. doi: 10.1529/biophysj.106.092577. [DOI] [PMC free article] [PubMed] [Google Scholar]
Associated Data
This section collects any data citations, data availability statements, or supplementary materials included in this article.