

Abstract
The apolipoprotein E family consists of three major protein isoforms: apolipoprotein E4 (ApoE4), ApoE3 and ApoE2. The isoforms, which contain 299 residues, differ only by single amino acid changes but of the three only ApoE4 is a risk factor for Alzheimer’s Disease. At μM concentrations lipid-free ApoE exists predominantly as tetramers. In more dilute solutions, lower molecular weight species predominate. Using Fluorescence Correlation Spectroscopy (FCS), intermolecular Fluorescence Resonance Energy Transfer (FRET) and sedimentation methods we find that the association-dissociation reaction of ApoE can be modeled with a monomer-dimer-tetramer process. Equilibrium constants have been determined from the sedimentation data while the individual rate constants for association and dissociation are determined by measuring the kinetics of dissociation of ApoE and are in agreement with the equilibrium constants. Dissociation kinetics as measured by intermolecular FRET show two phases reflecting the dissociation of tetramer to dimer and of dimer to monomer with dissociation from tetramer to dimer being more rapid than the dimer to monomer dissociation. The rate constants differ for the different ApoE isoforms showing that the association-dissociation process is isoforms specific. Strikingly, the association rate constants are almost two orders of magnitude slower than expected for a diffusion controlled process. Dissociation kinetics were also monitored by tryptophan fluorescence in presence of acrylamide and the data found to be consistent with the monomer-dimer-tetramer model. The approach combining multiple methods establishes the reaction scheme of ApoE self-association.
Keywords: Protein-protein interaction, monomer-dimer-tetramer, rate constants, intermolecular FRET, sedimentation velocity, sedimentation equilibrium
The apolipoprotein E family consists of three major isoforms: ApoE4, ApoE3 and ApoE2 with the only differences being arginine to cysteine mutations at positions 112 and 158. ApoE4 has arginines at both these positions while ApoE2 has cysteines in both these positions and ApoE3 has a cysteine at 112 and an arginine at 158. ApoE4, however, is known to be the major risk for Alzheimer’s Disease while ApoE2 appears to be protective (1-4). The complete structure of wild-type ApoE is unknown but the ApoE monomer consists of two domains, an N-terminal domain (residue 1-191) and a C-terminal domain (residue 221-299) (5, 6) with the arginine to cysteine changes occurring in the N-terminal domain. The two domains are linked by a 40 amino acid protease sensitive hinge region. Lipid-free protein at μM or higher concentrations exists primarily as a tetramer although small amounts of higher molecular weight forms may be present (6-11) while at lower concentrations, the protein dissociates to a monomeric form. The molecular weight distribution of these forms is not clear and no structure of any oligomeric form is known. Unlike the N-terminal domain, the isolated C-terminal domain of ApoE oligomerizes and hence this domain is thought to mediate ApoE oligomerization (7, 11, 12). Zhang et al. introduced 4-5 mutations in the C-terminal domain of ApoE3 that prevented aggregation of both the C-terminal domain (13) and the full length ApoE (14). The C-terminal region, however, is believed to contain the major lipid binding site (7) and the mutations which prevent self-association also result in more rapid lipoprotein particle formation from DMPC vesicles (14). These observations suggest that there may well be a correlation between lipid binding and the association-dissociation process. The role of the N-terminal region in self-association and lipid binding is unknown.
There have been efforts to characterize the self association behavior of ApoE molecules, primarily using sedimentations methods (10, 11, 15, 16). With the recent advances in the data analysis of the sedimentation experiments it has been possible to determine the equilibrium constants of the self association process of ApoE assuming a monomer-dimer-tetramer-octamer model (10, 16). However, the determination of the individual association and the dissociation rate constants is not possible from sedimentation data and requires kinetic experiments. While there are many examples of measurements of association and dissociation rate constants for monomer-dimer or monomer-oligomer systems (17-24) there appear to be no direct measurements of these rate constants for more complicated systems involving three species. Rate constants, however, are important and have been informative in many cases involving protein-protein interactions (18, 23-25).
Here we use fluorescence correlation spectroscopy (FCS) and sedimentation methods to characterize the overall self-association states of ApoE. The kinetics of dissociation are measured by changes in intermolecular FRET and show two phases reflecting tetramer to dimer and dimer to monomer processes. The simplest model that fits the data is that of a monomer to dimer to tetramer association. Individual rate constants for the association and dissociation reactions are determined from these data. The association rate constants are slower than that would be expected from simple diffusion controlled reactions. This appears to be the first explicit determination of rate constants for a complex reaction system involving monomer, dimer and tetramer.
MATERIALS AND METHODS
Expression and purification of ApoE
Apolipoprotein E was prepared and purified as described elsewhere (26). Site-directed mutations were performed by using the site-directed mutagenesis kit from Qiagen. The sequences of mutant proteins were verified by DNA sequencing.
Fluorescence labeling of ApoE’s
The cysteine residue(s) of WT-ApoE2 and WT-ApoE3 were replaced with serine. The alanine at position 102 in each isoform was mutated to cysteine for fluorescent labeling. Thus all the ApoE isoforms contained a single cysteine residue at position 102. ApoE containing this cysteine were labeled by either Alexa488 maleimide or Alexa546 maleimide (Invitrogen). The protein at 2 mg/mL was dissolved in 50 mM HEPES buffer, pH 7.4, 6 M urea and 200 μM tris (2-carboxyethyl)phoshine (TCEP). The solution was degassed under vacuum for 20 minutes. The maleimide dye, 200 μM, was added and the solution kept dark at RT under vacuum for 2 h. The reaction was then kept at 4 °C overnight. Excess dye was removed by passing the sample over a Superdex200 column in 4 M GdnCl (guanidine HCl), 20 mM HEPES buffer, pH 7.4, and 0.1% β-mercaptoethanol (βMe). The labeled ApoE was then refolded by dialysis against 20 mM HEPES buffer, pH 7.4 and 150 mM NaCl at 4 °C overnight. The absorbance of this sample at 280 nm and 490 nm (for Alexa488) or 555 (for Alexa546) was used to determine the extent of labeling. For all the samples the labeling was greater than 90%.
Fluorescence correlation spectroscopy
FCS measurements were performed on a Confocor 2 microscope equipped with FCS capability (Zeiss Inc., Germany). The FCS autocorrelation data were fit to equation (1a) to obtain the diffusion time, τD (27-29).
| (1a) |
where ω is the experimentally measured axial ratio of the FCS observation volume, N is number of molecules and τD is the diffusion time in the FCS observation volume, A is amplitude and τA is the time of any relaxation process taking place. The diffusion coefficient of ApoE (DApoE) was calculated from the experimentally obtained diffusion times, τD, using equation (1b).
| (1b) |
The diffusion coefficient of Alexa488 dye (30) in water is DAlexa488 = 4.3×10⁻⁶cm2s−1
The kinetic determination of oligomer dissociation was performed by FCS using 100 fold dilution of a 20 μM Alexa488 labeled (at position 102) ApoE4 solution. Data obtained at each time point were averaged for 3 minutes. The diffusion coefficient of monomeric ApoE was determined by FCS using 200 nM of the Alexa488 labeled monomeric form of ApoE4(14). Prior to FCS measurement the protein was passed through a Superdex200 column in 20 mM HEPES buffer, pH 7.4 and 150 mM NaCl and the monomeric fraction used. To measure the concentration dependence of diffusion coefficient, 100 nM Alexa488 labeled ApoE4 was mixed with varying concentrations of wild type ApoE4 ranging from 100 nM to 10 μM. The samples were incubated overnight in glass coverslip bottom 8 well chambered cells (Nunc) at RT. FCS measurements are performed next day to determine the concentration dependence of diffusion coefficient. The molecular weights of ApoE (MApoE) were calculated using equation 1c,
| (1c) |
Sedimentation equilibrium experiments and data analysis
A Beckman Optima model XL-A analytical ultracentrifuge was used for all sedimentation experiments. Samples (100 μL) and reference (120 μL) solutions were loaded into a conventional double-sector filled epon centerpiece (pathlength 1.2 cm). Data were collected at 280 nm with five averages, at time intervals of 240 min and radial intervals of 0.001 cm, until sedimentation equilibrium was attained. Experiments were conducted at 20 °C with a rotor velocity of 10,000 rpm. Molar extinction coefficients at 280 nm (44,500 M−1 cm−1) and partial specific volumes (v) of ApoE3 and ApoE4 (0.732 mL/g) was assumed. The sample concentrations used were 4 and 8 μM in 100 mM NH4HCO3. The data were analyzed to a continuous mass distribution using SEDFIT (31, 32).
Sedimentation velocity experiments and analysis
Sedimentation velocity experiments were conducted at 20 °C at a rotor speed of 40,000 rpm. Data were collected in continuous mode, at a single wavelength, using a time interval of 300 s, and a step size of 0.002 cm without averaging. The experiments were performed with 2, 4 and 8 μM ApoE in 100 mM NH4HCO3 buffer. Multiple scans at different time points were fitted to a monomer-dimer-tetramer- rapid self-association model using the program SEDFIT (31, 32). In SEDFIT the equilibrium constants K12 and K14 are obtained in the absorbance unit which were converted to concentration by Equation 2a.
| (2a) |
where εmonomer is the extinction coefficient of the protein at 280 nm (44,500 M−1 cm−1). The equlibrium constant from the dimer to the tetramer, K24molar is calculated using Equation 2b.
| (2b) |
Passivation of cuvette surface
To avoid adsorption of ApoE to the surface of a cuvette the inner surface was passivated according to Selvin and Ha(33). Briefly the quartz cuvette was thoroughly cleaned and then functionalized with (3-aminopropyl)triethoxysilane (Sigma). The surface passivation reaction was carried out with methoxy-poly(ethylene glycol)-succinimidyl valerate (mPEG-SVA, Laysan Bio Inc.) in bicarbonate buffer at pH 8.3.
FRET experiments
ApoEs labeled with either Alexa488 or Alexa546 were mixed at a ratio of 1:3 in 4 M GdnCl. This sample was then dialyzed at 4 °C in 20 mM HEPES buffer, pH 7.4 and 150 mM NaCl, flash frozen in liquid nitrogen in small aliquots (100 μL) and then stored at −80 °C prior to use. Before the FRET experiment, a 400 μL stock solution (conc. ≈15 μM) was incubated overnight at RT in an 8 well chamber glass coverslip bottom cell. The FRET kinetic experiments were performed using an Alphascan fluorometer (Photon Technology International, Inc.) equipped with a programmable shutter with the excitation and emission monochromators set at 490 nm and 520 nm respectively. Different amounts of ApoE stock solution (from 1.5 μL to 100 μL) were added into 3 mL buffer and mixed within 2-3 seconds. The fluorescence was then monitored for 1 h. To minimize photo-bleaching the shutter in the excitation light path was closed between measurements. All experiments performed at 24 °C.
The monomer-dimer-tetramer association model and data fitting
The kinetic data from the FRET experiments were globally fit to a monomer-dimer-tetramer association model (shown in Scheme 1) using Kinetic Explorer Software Version 2.2.563 (Kintek Corporation) (34). The experimental observable i.e., the donor dye fluorescence F(t) is expressed as, F(t) = c(m1+e2m2+e4m4), where c is a normalization constant, e2 and e4 are the average relative (compared to the monomers) brightness of the dimers and the tetramers respectively. Experiments were simulated in two steps: first equilibration of the stock solution (monomeric concentration ≈15 μM) and then dilution of this solution (for most experiments dilutions are 1000, 500, 250, 125, 62.5 fold). The initial distribution of the monomers, dimers and tetramers in the stock solution was calculated using the same set of rate constants which describes the kinetics of monomer and dimer formation due to dilution. The kinetic data from all the dilutions were fit globally to obtain the four rate constants and two brightness values. Kintek Explorer FitSpace program was used to determine how well constrained the rate constants were(35).
Scheme 1.

Self-association model of ApoE consisting of monomer-dimer-tetramer.
m1, m2 and m4 represent monomer, dimer and tetramer respectively. K12 and K24 are equilibrium constants for the monomer to dimer and dimer to tetramer association processes.
Tryptophan fluorescence quenching kinetics experiments
For these experiments WT-ApoE4, ApoE3 or ApoE2 was used. 400 μL stock solution (conc. ≈25 μM) was incubated overnight at RT in an 8 well chamber glass coverslip bottom cell. The excitation and emission monochromators in the fluorometer were set to 290 nm and 340 nm, respectively. Different amounts of ApoE (from 3 μL to 12 μL) were added to 3 mL HEPES buffer and mixed within 2-3 seconds in buffer containing 100 mM acrylamide. The fluorescence data were then recorded for 1 h.
RESULTS
Dissociation of ApoE using FCS
At μM protein concentrations, ApoE exists primarily as a tetramer (9, 10). Figure 1 shows how the diffusion coefficient changes with time after 20 μM Alexa488 labeled ApoE4 solution is diluted 100 fold to a final concentration of 200 nM. The data can be fit by a single exponential with an observed half time of ≈1200 s and the increase in the diffusion coefficient after dilution implies a decrease in the average molecular weight and is direct indication of the dissociation of the ApoE oligomers. The data show that the dissociation is slow but do not allow a determination of any reaction model.
Figure 1.
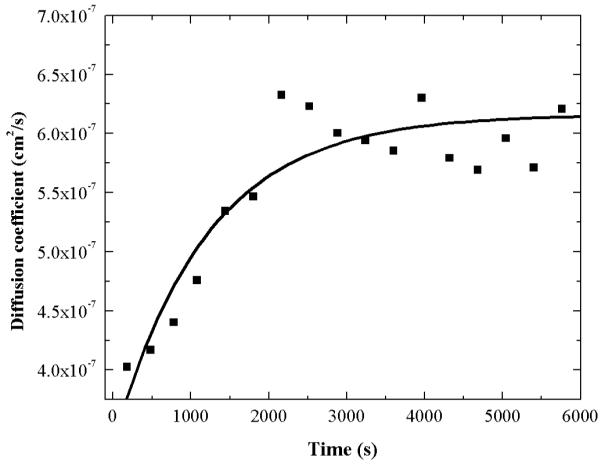
Dissociation of ApoE4 measured by FCS.
The time dependence of dissociation of ApoE4 after dilution followed by FCS. Alexa488 labeled ApoE4 (20 μM) was diluted 100 fold into 20 mM HEPES buffer, pH 7.4, 150 mM NaCl and 0.1% βMe. The solid line is a single exponential fit of the data. The diffusion coefficients of apoE were calculated from diffusion times using Equation 1b.
Sedimentation velocity
Sedimentation velocity experiments were performed at 2, 4 and 8 μM WT-ApoE4. As will be discussed in the following section, our kinetic data cannot be fit by simple monomer-dimer or dimer-tetramer systems. Therefore to interpret the sedimentation velocity data we assumed the next simplest model -a monomer-dimer-tetramer association model which is shown in Scheme 1. Figure 2a shows the data (open circles) and the fits (solid lines) using SEDFIT (31, 32) using a monomer-dimer-tetramer model. Figure 2b shows the residuals of the fit. The concentration of ApoE4 for this experiment was 4 μM. The fits converged to sedimentation coefficients of 2.82, 3.93 and 7.18 Svedberg units for monomer, dimer and tetramers respectively. The equilibrium constants K12 and K24 are summarized in Table 1.
Figure 2.

Sedimentation velocity experiments using WT-ApoE4.
A) Data from sedimentation velocity experiments using 4 μM WT-ApoE4. The solid lines are fit to a monomer-dimer-tetramer model as discussed in the text. B) residuals of the fit.
Table 1.
Summary of rate and equilibrium constants
| Sample | Experiment | k+1 (M−1s−1) |
k−1 (s−1) |
k+2 (M−1s−1) |
k−2 (s−1) |
K12−1 (M) |
K24−1 (M) |
|---|---|---|---|---|---|---|---|
| WT-ApoE4 | Sedimentation velocity |
(a)140×10−9 | (a)89×10−9 | ||||
| ApoE4 (A102C) |
Kinetics | 8.5×10³ | 6.7×10⁻⁴ | 2.0×10⁵ | 4.0×10⁻³ | (b)79×10−9 | (b)22×10−9 |
| ApoE3 (C112S, A102C) |
Kinetics | 4.7×10³ | 5.6×10⁻⁴ | 0.8×10⁵ | 5.0×10⁻³ | (b)119×10−9 | (b)62×10−9 |
| ApoE2 (C112S, C158S, A102C) |
Kinetics | 6.0×10³ | 6.6×10⁻⁴ | 0.8×10⁵ | 3.6×10⁻³ | (b)110×10−9 | (b)45×10−9 |
Kinetics of dissociation of ApoE using FRET
Using changes in intermolecular FRET, we determined the kinetics of the dissociation process. When Alexa488 and Alexa546 labeled ApoE’s are mixed the fluorescence of Alexa488 is quenched in a concentration dependent manner (Figure S1, Supplementary material), an indication of intermolecular FRET due to self-association of ApoE molecules. Following dilution fluorescence of the donor increased with time due to re-equilibration of the oligomeric forms. Experiments as a function of the final concentration of the protein allow a unique fit of both the dissociation and association rate constants. Figure 3A shows the data (symbols) for the time course of the donor fluorescence from ApoE4 after dilution from higher to lower concentrations. The starting concentration of ApoE4 was 15 μM and the final concentrations were 15, 30, 60, 120, 240 and 480 nM as shown in Figure 3A. As discussed in Materials and Methods, the ratio of ApoEs labeled with either Alexa488 or Alexa546 was 1:3. For visual comparison, the data in Figure 3A were normalized to the fluorescence at time zero. Attempts to fit the kinetic data with a monomer-dimer or dimer-tetramer model were unsuccessful. Therefore the next simplest model of a monomer to dimer to tetramer association was used to fit the data. The solid black lines in Figure 3A are global fits of all the data using a monomer-dimer-tetramer model. The rate constants obtained are shown in Table 1. The equilibrium constants calculated from the association and the dissociation rate constants are consistent with those obtained from the sedimentation velocity experiments. Figures 3B and 3C show similar kinetic experiments performed with ApoE3 (C112S, A102C) and ApoE2 (C112S, C158S, A102C). Here, in order to have the fluorescent probes at the same position in all the isoforms, the cysteine residue(s) of these proteins were substituted by serine(s) for these experiments and alanine 102 was mutated to cysteine. The concentrations used for these samples are similar to those of ApoE4 and are shown on the figures. All the data have been fit to the same model. Fits to the data appear quite reasonable over the concentration range from 5 to 240 nM for all the ApoE isoforms. There is a slight deviation from the fits at 480 nM which may be due to the presence of small amounts of higher molecular weight forms at this concentration. As discussed later, a striking feature is that the equilibration process is very slow taking more than 1 h after dilution to be completed.
Figure 3.

Kinetics of dissociation of Alexa488 and Alexa546 labeled ApoE isoforms using intermolecular FRET.
Fluorescently labeled ApoE (15 μM) was diluted into 20 mM HEPES buffer, pH 7.4, 150 mM NaCl and 0.1% βMe to various final concentrations as indicated in the figures. The symbols represent data from ApoE4 (A), serine mutant of ApoE3 (C112S) (B) and ApoE2 (C112S, C158S) (C) and the solid lines are fit to a monomer-dimer-tetramer model using Kintek Explorer (35). The rate constants obtained are listed in Table 1. The ratio of Alexa488-ApoE and Alexa546-ApoE is 1:3. The fluorescence was monitored at 520 nm with excitation at 490 nm.
Figure 4 shows the plots of the rate constants obtained for the ApoE3-serine mutant using the FitSpace program of Johnson et al. (35). As discussed by Johnson (35) such plots provide a good way to examine the errors involved in the determination of these parameters and to examine the quality of fitting (i.e., same χ2) by inter-adjustment of the parameters. In these 2-D plots the red regions correspond to the best fit (i.e. minimum χ2 of data fitting) values of the rate constants and the yellow boundaries indicate standard errors (corresponding to 1.3×χ2min) in the parameters. It can be seen from the figure that the values of the dissociation rates, k−1 and k−2 are tightly constrained within ±10−4 s−1 and ±10−3 s−1 respectively. The values of the association rate constants, k+1 and k+2 vary within (4.7±1.7) ×103 M−1s−1 and (0.80±0.26) ×105 M−1s−1. Although k+1 and k+2 contain larger errors it is clear from the FitSpace plots that all the four rate constants are constrained within bounds. In general if more rate constants are used than necessary to describe the data then the FitSpace plots would show that at least some of the rate constants would be out of bounds. That this does not happen for our model indicates that this model is optimal for describing the kinetic data. It may be noted that confidence level in the determination of the rate constants is improved by including more experimental data, hence at least five to seven dilution experiments were performed for each ApoE isoform.
Figure 4.

FitSpace plot of the rate constants.
A FitSpace plot of the fit of the data shown in Figure 3B of the serine mutant of ApoE3(C112S). The FitSpace plot is computed around the best fit parameter values using Kintek Explorer (35). The axes represent the values of the particular rate constants, k+ or k− expressed in M−1s−1 or s−1 units respectively. In these 2-D plots the values of χ2 are presented in colors. The column at the right shows color code scale of the χ2 with respect to the χ2minimum. The yellow contours represent the confidence intervals of the rate constants. The presence of finite contours in all the plots indicates that the monomer-dimer-tetramer model adequately describes the kinetic data and that the values of the rate constants are unique.
Kinetics of dissociation of ApoE using acrylamide quenching
The ApoE monomer contains 7 tryptophan residues, 4 in the N-terminal domain and 3 in the C-terminal domain. Our previous 19F-NMR experiments suggested that the tryptophan residues in C-terminal domain and one tryptophan in the N-terminal domain are solvent exposed in the monomeric protein (26). In the presence of acrylamide the tryptophan fluorescence is quenched in a way such that the extent of quenching is dependent on ApoE concentration suggesting that some of these residues may be at least partially buried in the dimer and the tetramer (Figure S2, Supplementary material). This observation allowed us to monitor the association and dissociation of ApoE by tryptophan quenching using the wild-type ApoE rather than fluorescently labeled protein. Figure 5 shows the time course of the tryptophan fluorescence after dilution of WT-ApoE3 into 20 mM HEPES buffer, pH 7.4 and 150 mM NaCl containing 100 mM acrylamide. The concentration of the acrylamide used was chosen from a Stern-Volmer plot to ensure that the nature of the quenching is dynamic and not static (data not shown). The initial concentration of ApoE3 was 27 μM and final concentrations were 27, 54 and 108 nM as shown in the figure. The lines are simulated curves using monomer-dimer-tetramer model and the same rate constants obtained from the fitting of the FRET data of the ApoE3-serine mutant (Table 1). Similar experiments have been performed using ApoE2-wt and ApoE4-wt (data not shown) and the data agree well with the rate constants in Table 1 for the ApoE2 serine mutant and the ApoE4 respectively. We infer from these results that the cysteine to serine mutations in both ApoE3 and ApoE2 do not significantly affect their association and dissociation rate constants. Fluorescence labeling of ApoE at position 102 also appears not to significantly interfere with the properties of ApoE.
Figure 5.
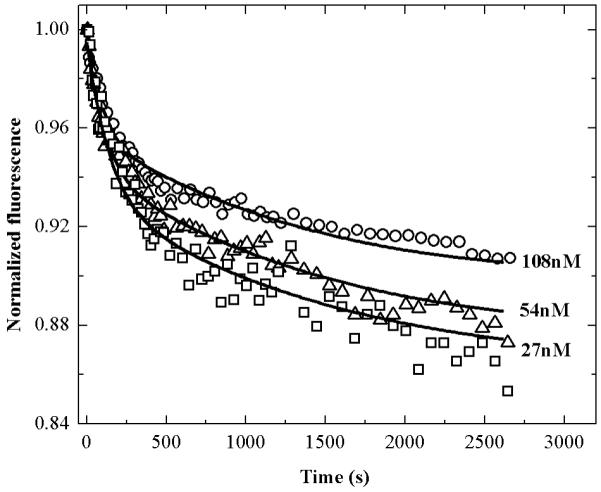
Kinetics of dissociation of WT-ApoE3 using acrylamide quenching of tryptophan fluorescence.
WT-ApoE3 (27 μM) was diluted into 20 mM HEPES buffer, pH 7.4, 150 mM NaCl and 0.1% βMe in the presence of 100 mM acrylamide to final concentrations of 27, 54, and 108 nM. The squares, triangles and circles represent experimental data at different concentrations and the solid lines are simulated using rate constants listed in Table 1 obtained for serine mutant of ApoE3. The fluorescence is monitored at 340 nm with excitation at 290 nm.
Measurement of diffusion coefficients of ApoE as a function of concentration
Figure 6 shows a plot of the molecular weight of ApoE4 molecules with concentrations ranging from 200 nM to 10 μM. Molecular weights are calculated using equation 1c, from the measured diffusion coefficients using the molecular weight of the monomer as 34,200 and a diffusion coefficient of 7.6×10⁻⁷ cm2s−1, the latter value being determined by FCS using a monomeric form of ApoE4 (14). The solid black line is obtained using the association and the dissociation rate constants obtained for ApoE4 from the kinetic experiments as summarized in Table 1. It is apparent from this figure that there is good agreement between the data obtained from the two different methods.
Figure 6.
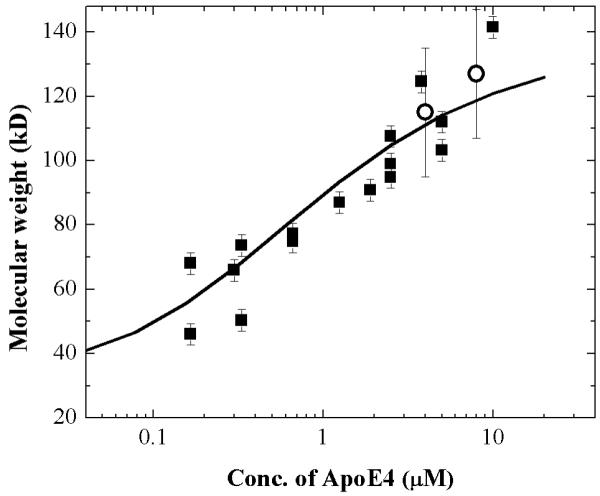
Mean molecular weight of ApoE4 as a function of concentration.
The black squares represent mean molecular weights obtained from FCS measurements of WT-ApoE4. Alexa488 labeled ApoE4 (100 nM) is present in all the samples. The molecular weights are calculated from the diffusion coefficients using Equation 1c. The diffusion coefficient of monomeric ApoE4 used in the calculation was 7.6×10⁻⁷ cm2s−1 as determined by FCS. The open circles represent molecular weights obtained from sedimentation equilibrium experiments (see Figure 7). The solid curve was calculated using Kintek Explorer (34) from the rate constants listed in Table 1 for ApoE4 obtained from kinetic experiments.
Sedimentation equilibrium
Figure 7a shows the sedimentation equilibrium data (symbols) obtained at 4 and 8 μM WT-ApoE4. The data were fit to a continuous mass distribution using SEDFIT (31, 32). Figure 7b shows the residuals of the fits. The mass distribution obtained is wide ranging from 90 kD to 150 kD (Figure 7c). The mean molecular mass for 4 μM and 8 μM ApoE4 is 115 kDa and 128 kDa, respectively (Figure 7c). These mean molecular mass values, plotted as open circles in Figure 6, are consistent with the values obtained from the other two methods and also are consistent with the reported values (9, 10).
Figure 7.

Sedimentation equilibrium experiments with WT-ApoE4.
The concentrations of WT-ApoE4 used were 4 μM (o) and 8 μM (□). A) sedimentation data and fit with continuous mass distribution using SEDFIT (31, 32). B) residuals of the fit, C) mass distribution obtained from the fit. The mean molecular weights for 4 and 8 μM ApoE4 are 114 and 129 kD respectively.
DISCUSSION
The rationale for the monomer-dimer-tetramer model
As mentioned earlier we were unable to fit the kinetic data with a simple monomer-dimer or dimer-tetramer association scheme. The monomer-dimer-tetramer model was successful in fitting both the sedimentation and the kinetic data. The validity and the power of this model are illustrated by the fact that the same set of rate constants can fit the data over a large concentration range (viz., from 5 nM to 480 nM, see Figures 3A, 3B and 3C). Furthermore several independent methods are consistent with a monomer-dimer-tetramer model and with the rate constants derived from the dissociation kinetics. The kinetic data reveal two distinct phases with the faster rate corresponding to dissociation from the tetramer to dimer and the slower rate to the subsequent dissociation of dimers to monomers. Our results do not rule out the possibility of the presence of the forms larger than tetramers as have been observed by several authors (9, 10, 36) but the population of these higher forms must be small under the experimental conditions used here.
It is interesting to note that while there are kinetic data in the literature for determining rate constants for monomer-dimer or monomer-tetramer system (18, 23-25, 37-41) there do not appear to be kinetic data for a monomer-dimer-tetramer system. The data presented here solves that problem by employing complementary techniques.
Differences between the isoforms
Table 1 shows that the association and the dissociation rate constants for ApoE4, ApoE3 and ApoE2 are different. The differences between the isoforms are visualized more clearly by comparing the absolute populations of monomer, dimer and tetramer at the same total ApoE concentrations. Figure 8 shows the plots of monomer (Figure 8a), dimer (Figure 8b) and tetramer (Figure 8c) populations for ApoE4, ApoE3 and ApoE2. These populations are estimated using Kintek Explorer software using the rate constants obtained from the FRET kinetics measurements as summarized in Table 1. As expected from the rate constants there are differences between the ApoE isoforms. Although these differences are not large the differences are more apparent for the monomers and the dimers rather than the tetramers. At any specific concentration, ApoE3 has the largest amount of the monomeric and dimeric species followed by ApoE4 and ApoE2. Figure 8d shows the plot of the percentage of monomer, dimer and tetramer population as a function of ApoE4 concentrations ranging from 10 nM to 20 μM. The plot shows that the monomers predominate at ApoE concentrations less than 100 nM while tetramers predominant above 2.5 μM. The dimer population reaches maximum at ≈100 nM and is never the predominant species. The real differences between the ApoE isoforms may lie in their monomer and dimer populations. This is particularly relevant at 200 nM or lower concentrations. It may be noted that the concentration of ApoE in the cerebrospinal fluid (CSF) is ≈150 nM (42). Because ApoE in CSF exists as lipoprotein complexes it is not possible to say if the comparison is relevant.
Figure 8.

Monomer, dimer and tetramer populations of ApoE isoforms as a function of total concentration.
A-C) simulation of monomer, dimer and tetramer populations as a function of the total ApoE concentration for apoE4 (□), ApoE3 (○) and ApoE2 (✰) respectively. D, percent populations of monomers (■), dimers (●) and tetramers (▲) for ApoE4. The simulations have been performed using Kintek explorer (35) and the rate constants obtained from kinetics experiments for ApoE4, serine mutants of ApoE3 and ApoE2 as listed in Table 1.
Consistency of the rate constants from different measurements
Our data from FCS, sedimentation velocity and kinetic measurements are all consistent with the monomer-dimer-tetramer association model. However, as mentioned earlier, the values of the parameters obtained from the different measurements may differ owing to the fact that mutants of ApoE and also labeling with fluorophores have been used. The equilibrium constants K12 and K24 for ApoE4 listed in Table 1 from sedimentation velocity and kinetic experiments are quite close although not exactly the same. Kinetic data from tryptophan quenching experiments agree well with rate constants obtained from the FRET measurements. In addition, it is apparent from Figure 6 that the molecular weight as a function of concentration obtained from FCS, sedimentation equilibrium and the kinetic experiments agree quite well. Figure 8d demonstrates that the average molecular weight approaches that of a tetramer for ApoE concentrations above 2 μM. This is in agreement with our data (Figure 6) as well as published sedimentation equilibrium data (9, 10).
Comparison of the kinetics experiments with the sedimentation velocity
Sedimentation velocity has been widely used to determine equilibrium constants for two species systems (e.g., monomer-dimer or monomer-tetramer) (21, 43, 44). Recent improvements in data fitting, especially the programs SEDFIT and SEDPHAT (31, 32), allow fitting of more complicated models such as monomer-dimer-tetramer or monomer-tetramer-octamer (45-48). Correct applications of these models require experiments to be performed over a wide range of concentrations over which each of the species is significantly populated. In order to establish the self association model of ApoE, sedimentation experiments need to be performed within protein concentrations of ≈ 50 nM to 2 μM. However, sedimentation experiments with ApoE concentrations below 1 μM (or 0.03 mg/ml) are difficult due to low absorbance and adsorption of the sample to the cell walls. On the other hand, kinetic experiments using FRET, are possible over this range of protein concentrations. In addition kinetic data yield both the association and the dissociation rate constants from which equilibrium constants can be calculated.
The association-dissociation rate constants
The data given in Table 1 show that the association rate constants are considerably smaller than those expected for diffusion control. Extensive studies using experiments and computations indicate that diffusion controlled protein-protein association rate constants are on the order of 0.5-5×10⁶ M−1s−1 (37-41). The association rate constants we obtain for ApoE dimer formation and tetramer formation (see Table 1) both are, in general, 10-100 fold slower. This indicates a free energy barrier for formation of both the dimers and the tetramers and may reflect a conformational change necessary for ApoE molecules to self-associate and/or only the presence of a rare form of the monomer or dimer which self-associates. We have no way to distinguish between these two possibilities although our previous data indicates considerable apoE heterogeneity (26).
The molecular shape of ApoE
From a diffusion coefficient and a known molecular weight it is possible to determine the frictional coefficient of the protein. For monomeric ApoE, the diffusion coefficient, measured by FCS, is 7.6×10⁻⁷ cm2s−1 which is 1.35 times smaller than that expected for a spherical protein of mass 34.2 kD indicating that the ApoE monomer is not globular but rather has an extended shape with a frictional coefficient of 1.35. This value corresponds to an axial ratio of about 7 (49), close to the value reported by Perugini et al. (45). If the frictional coefficient of the tetramer is the same as Perugini et al. state, then the tetramer would appear to be stacked dimers which in turn would suggest more than one monomer-monomer interface.
Self association behavior and lipid binding of ApoE
It should be noted that dimeric and monomeric forms retain structuare and that dissociation to these forms from the tetramer may very well open new ligand binding sites. For example, both ApoE self-association and lipid binding have been suggested to be mediated through the C-terminal domain and if these two processes are linked then the association-dissociation of the different isoforms may be relevant. In addition, it is known that the lipid binding kinetics are slow and we show here that the association-dissociation process is slow as well. As mentioned earlier, the mutations which inhibit self-association in ApoE3 also result in more rapid lipoprotein particle formation from DMPC vesicles (14). The possibility that these processes are linked makes a compelling argument for understanding the association and dissociation processes of the ApoE isoforms. While which ApoE molecular weight form(s) binds to lipids is unknown, it is known that ApoE4 is the major risk factor for Alzheimer’s disease (1-4). The question is whether the physiological differences between the different ApoE isoforms may be related to their ability to undergo the association-dissociation reaction.
Conclusions
In summary, using both kinetic and sedimentation data we have determined the association and dissociation rate constants of the ApoE self-association reactions. It is shown that the different isoforms of apoE differ with respect to their association-dissociation properties. The association rate constants are much slower than diffusion controlled reactions indicating presence of barrier in the formation of the oligomeric forms. To our knowledge it is the first time attempt to determine the rate constants in a system involving monomer, dimer and tetramer and ApoE can act as a model system to characterize such processes.
BRIEF.
This paper determines the rate constants for the self-association of the ApoE proteins using a monomer-dimer-tetramer model.
Supplementary Material
ACKNOWLEDGMENT
The authors thank Berevan Baban for excellent technical assistance and Dr. Roberto Galletto for his help with the sedimentation measurements.
This research was supported in part by NIH Grant DK13332
LIST OF ABBREVIATIONS
- ApoE
Apolipoprotein-E
- WT
wild type
- serine mutant of ApoE3
apolipoprotein-E3 (C112S)
- serine mutant of ApoE2
apolipoprotein-E2 (C112S, C158S)
- monomeric form of ApoE4
apolipoprotein E4 (F257A,W264R,V269A,L279Q,V287E)
- GdnCl
guanidine hydrochloride
- FCS
fluorescence correlation spectroscopy
- FRET
fluorescence resonance energy transfer
- βMe
β-mercaptoethanol
Footnotes
SUPPLEMENTAL INFORMATION
Concentration dependent intermolecular FRET in samples of ApoE2(C112S, C158S, A102C) labeled with either Alexa488 or Alexa546 are shown in Figure S1. Concentration dependent quenching of tryptophan fluorescence of WT-ApoE4 in presence of 100 mM acrylamide is shown in Figure S2. The supplementary materials may be accessed free of charge online at http://pubs.acs.org>.
REFERENCES
- 1.Corder EH, Saunders AM, Strittmatter WJ, Schmechel DE, Gaskell PC, Small GW, Roses AD, Haines JL, Pericak-Vance MA. Gene dose of apolipoprotein E type 4 allele and the risk of Alzheimer’s disease in late onset families. Science. 1993;261:921–923. doi: 10.1126/science.8346443. [DOI] [PubMed] [Google Scholar]
- 2.Drzezga A, Grimmer T, Henriksen G, Muhlau M, Perneczky R, Miederer I, Praus C, Sorg C, Wohlschlager A, Riemenschneider M, Wester HJ, Foerstl H, Schwaiger M, Kurz A. Effect of APOE genotype on amyloid plaque load and gray matter volume in Alzheimer disease. Neurology. 2009;72:1487–1494. doi: 10.1212/WNL.0b013e3181a2e8d0. [DOI] [PubMed] [Google Scholar]
- 3.Farrer LA, Cupples LA, Haines JL, Hyman B, Kukull WA, Mayeux R, Myers RH, Pericak-Vance MA, Risch N, van Duijn CM. Effects of age, sex, and ethnicity on the association between apolipoprotein E genotype and Alzheimer disease. A meta-analysis. APOE and Alzheimer Disease Meta Analysis Consortium. Jama. 1997;278:1349–1356. [PubMed] [Google Scholar]
- 4.Alberts MJ, Graffagnino C, McClenny C, DeLong D, Strittmatter W, Saunders AM, Roses AD. ApoE genotype and survival from intracerebral haemorrhage. Lancet. 1995;346:575. doi: 10.1016/s0140-6736(95)91411-0. [DOI] [PubMed] [Google Scholar]
- 5.Wilson C, Wardell MR, Weisgraber KH, Mahley RW, Agard DA. Three-dimensional structure of the LDL receptor-binding domain of human apolipoprotein E. Science. 1991;252:1817–1822. doi: 10.1126/science.2063194. [DOI] [PubMed] [Google Scholar]
- 6.Hatters DM, Peters-Libeu CA, Weisgraber KH. Apolipoprotein E structure: insights into function. Trends Biochem Sci. 2006;31:445–454. doi: 10.1016/j.tibs.2006.06.008. [DOI] [PubMed] [Google Scholar]
- 7.Westerlund JA, Weisgraber KH. Discrete carboxyl-terminal segments of apolipoprotein E mediate lipoprotein association and protein oligomerization. J Biol Chem. 1993;268:15745–15750. [PubMed] [Google Scholar]
- 8.Dergunov AD, Hoy A, Smirnova EA, Visvikis S, Siest G. Charge-based heterogeneity of human plasma lipoproteins at hypertriglyceridemia: capillary isotachophoresis study. Int J Biochem Cell Biol. 2003;35:530–543. doi: 10.1016/s1357-2725(02)00359-x. [DOI] [PubMed] [Google Scholar]
- 9.Chou CY, Lin YL, Huang YC, Sheu SY, Lin TH, Tsay HJ, Chang GG, Shiao MS. Structural variation in human apolipoprotein E3 and E4: secondary structure, tertiary structure, and size distribution. Biophys J. 2005;88:455–466. doi: 10.1529/biophysj.104.046813. [DOI] [PMC free article] [PubMed] [Google Scholar]
- 10.Perugini MA, Schuck P, Howlett GJ. Self-association of human apolipoprotein E3 and E4 in the presence and absence of phospholipid. J Biol Chem. 2000;275:36758–36765. doi: 10.1074/jbc.M005565200. [DOI] [PubMed] [Google Scholar]
- 11.Aggerbeck LP, Wetterau JR, Weisgraber KH, Wu CS, Lindgren FT. Human apolipoprotein E3 in aqueous solution. II. Properties of the amino- and carboxyl-terminal domains. J Biol Chem. 1988;263:6249–6258. [PubMed] [Google Scholar]
- 12.Patel AB, Khumsupan P, Narayanaswami V. Pyrene fluorescence analysis offers new insights into the conformation of the lipoprotein-binding domain of human apolipoprotein E. Biochemistry. 2010;49:1766–1775. doi: 10.1021/bi901902e. [DOI] [PubMed] [Google Scholar]
- 13.Fan D, Li Q, Korando L, Jerome WG, Wang J. A monomeric human apolipoprotein E carboxyl-terminal domain. Biochemistry. 2004;43:5055–5064. doi: 10.1021/bi035958w. [DOI] [PubMed] [Google Scholar]
- 14.Zhang Y, Vasudevan S, Sojitrawala R, Zhao W, Cui C, Xu C, Fan D, Newhouse Y, Balestra R, Jerome WG, Weisgraber K, Li Q, Wang J. A monomeric, biologically active, full-length human apolipoprotein E. Biochemistry. 2007;46:10722–10732. doi: 10.1021/bi700672v. [DOI] [PubMed] [Google Scholar]
- 15.Yokoyama S, Kawai Y, Tajima S, Yamamoto A. Behavior of human apolipoprotein E in aqueous solutions and at interfaces. J Biol Chem. 1985;260:16375–16382. [PubMed] [Google Scholar]
- 16.Barbier A, Clement-Collin V, Dergunov AD, Visvikis A, Siest G, Aggerbeck LP. The structure of human apolipoprotein E2, E3 and E4 in solution 1. Tertiary and quaternary structure. Biophys Chem. 2006;119:158–169. doi: 10.1016/j.bpc.2005.07.010. [DOI] [PubMed] [Google Scholar]
- 17.Munoz F, Valles MA, Donoso J, Echevarria G, Garcia Blanco F. Kinetic and thermodynamic study of the tetramerization equilibrium of phosphorylase b. J Biochem. 1983;94:1649–1659. [PubMed] [Google Scholar]
- 18.Kitano H, Maeda Y, Okubo T. Kinetic study of the effects of solvation on the dimerization process of alpha-chymotrypsin. Biophys Chem. 1989;33:47–54. doi: 10.1016/0301-4622(89)80006-7. [DOI] [PubMed] [Google Scholar]
- 19.Lu HS, Chang WC, Mendiaz EA, Mann MB, Langley KE, Hsu YR. Spontaneous dissociation-association of monomers of the human-stem-cell-factor dimer. Biochem J. 1995;305(Pt 2):563–568. doi: 10.1042/bj3050563. [DOI] [PMC free article] [PubMed] [Google Scholar]
- 20.Moore JM, Patapoff TW, Cromwell ME. Kinetics and thermodynamics of dimer formation and dissociation for a recombinant humanized monoclonal antibody to vascular endothelial growth factor. Biochemistry. 1999;38:13960–13967. doi: 10.1021/bi9905516. [DOI] [PubMed] [Google Scholar]
- 21.Veronese PK, Stafford RP, Lucius AL. The Escherichia coli ClpA molecular chaperone self-assembles into tetramers. Biochemistry. 2009;48:9221–9233. doi: 10.1021/bi900935q. [DOI] [PubMed] [Google Scholar]
- 22.Venezia CF, Meany BJ, Braz VA, Barkley MD. Kinetics of association and dissociation of HIV-1 reverse transcriptase subunits. Biochemistry. 2009;48:9084–9093. doi: 10.1021/bi9010495. [DOI] [PMC free article] [PubMed] [Google Scholar]
- 23.Hoggett JG, Kellett GL. Kinetics of the monomer-dimer reaction of yeast hexokinase PI. Biochem J. 1992;287(Pt 2):567–572. doi: 10.1042/bj2870567. [DOI] [PMC free article] [PubMed] [Google Scholar]
- 24.Darke PL, Jordan SP, Hall DL, Zugay JA, Shafer JA, Kuo LC. Dissociation and association of the HIV-1 protease dimer subunits: equilibria and rates. Biochemistry. 1994;33:98–105. doi: 10.1021/bi00167a013. [DOI] [PubMed] [Google Scholar]
- 25.Chen MJ, Mayo KH. Human platelet factor 4 subunit association/dissociation thermodynamics and kinetics. Biochemistry. 1991;30:6402–6411. doi: 10.1021/bi00240a009. [DOI] [PubMed] [Google Scholar]
- 26.Garai K, Mustafi SM, Baban B, Frieden C. Structural differences between apolipoprotein E3 and E4 as measured by (19)F NMR. Protein Sci. 2010;19:66–74. doi: 10.1002/pro.283. [DOI] [PMC free article] [PubMed] [Google Scholar]
- 27.Magde D, Elson EL, Webb WW. Fluorescence correlation spectroscopy. II. An experimental realization. Biopolymers. 1974;13:29–61. doi: 10.1002/bip.1974.360130103. [DOI] [PubMed] [Google Scholar]
- 28.Maiti S, Haupts U, Webb WW. Fluorescence correlation spectroscopy: diagnostics for sparse molecules. Proc Natl Acad Sci U S A. 1997;94:11753–11757. doi: 10.1073/pnas.94.22.11753. [DOI] [PMC free article] [PubMed] [Google Scholar]
- 29.Garai K, Muralidhar M, Maiti S. Fiber-optic fluorescence correlation spectrometer. Appl Opt. 2006;45:7538–7542. doi: 10.1364/ao.45.007538. [DOI] [PubMed] [Google Scholar]
- 30.Nitsche JM, Chang HC, Weber PA, Nicholson BJ. A transient diffusion model yields unitary gap junctional permeabilities from images of cell-to-cell fluorescent dye transfer between Xenopus oocytes. Biophys J. 2004;86:2058–2077. doi: 10.1016/S0006-3495(04)74267-8. [DOI] [PMC free article] [PubMed] [Google Scholar]
- 31.Schuck P, Perugini MA, Gonzales NR, Howlett GJ, Schubert D. Size-distribution analysis of proteins by analytical ultracentrifugation: strategies and application to model systems. Biophys J. 2002;82:1096–1111. doi: 10.1016/S0006-3495(02)75469-6. [DOI] [PMC free article] [PubMed] [Google Scholar]
- 32.Schuck P. Size-distribution analysis of macromolecules by sedimentation velocity ultracentrifugation and lamm equation modeling. Biophys J. 2000;78:1606–1619. doi: 10.1016/S0006-3495(00)76713-0. [DOI] [PMC free article] [PubMed] [Google Scholar]
- 33.Selvin PR, Ha T. Single-molecule techniques: a laboratory manual. Cold Spring Harbor Laboratory Press; Cold Spring Harbor, N.Y.: 2008. [Google Scholar]
- 34.Johnson KA, Simpson ZB, Blom T. Global kinetic explorer: a new computer program for dynamic simulation and fitting of kinetic data. Anal Biochem. 2009;387:20–29. doi: 10.1016/j.ab.2008.12.024. [DOI] [PubMed] [Google Scholar]
- 35.Johnson KA, Simpson ZB, Blom T. FitSpace explorer: an algorithm to evaluate multidimensional parameter space in fitting kinetic data. Anal Biochem. 2009;387:30–41. doi: 10.1016/j.ab.2008.12.025. [DOI] [PubMed] [Google Scholar]
- 36.Hatters DM, Zhong N, Rutenber E, Weisgraber KH. Amino-terminal domain stability mediates apolipoprotein E aggregation into neurotoxic fibrils. J Mol Biol. 2006;361:932–944. doi: 10.1016/j.jmb.2006.06.080. [DOI] [PubMed] [Google Scholar]
- 37.Kellett GL, Gutfreund H. Reactions of haemoglobin dimers after ligand dissociation. Nature. 1970;227:921–926. doi: 10.1038/227921a0. [DOI] [PubMed] [Google Scholar]
- 38.Pollard TD, Cooper JA. Actin and actin-binding proteins. A critical evaluation of mechanisms and functions. Annu Rev Biochem. 1986;55:987–1035. doi: 10.1146/annurev.bi.55.070186.005011. [DOI] [PubMed] [Google Scholar]
- 39.Noble RW, Reichlin M, Gibson QH. The reactions of antibodies with hemeprotein antgens. The measurement of reaction kinetics and stoichiometry by fluorescence quenching. J Biol Chem. 1969;244:2403–2411. [PubMed] [Google Scholar]
- 40.Ward ES, Gussow D, Griffiths AD, Jones PT, Winter G. Binding activities of a repertoire of single immunoglobulin variable domains secreted from Escherichia coli. Nature. 1989;341:544–546. doi: 10.1038/341544a0. [DOI] [PubMed] [Google Scholar]
- 41.Northrup SH, Erickson HP. Kinetics of protein-protein association explained by Brownian dynamics computer simulation. Proc Natl Acad Sci U S A. 1992;89:3338–3342. doi: 10.1073/pnas.89.8.3338. [DOI] [PMC free article] [PubMed] [Google Scholar]
- 42.Hesse C, Larsson H, Fredman P, Minthon L, Andreasen N, Davidsson P, Blennow K. Measurement of apolipoprotein E (apoE) in cerebrospinal fluid. Neurochem Res. 2000;25:511–517. doi: 10.1023/a:1007516210548. [DOI] [PubMed] [Google Scholar]
- 43.Schuck P. Sedimentation analysis of noninteracting and self-associating solutes using numerical solutions to the Lamm equation. Biophys J. 1998;75:1503–1512. doi: 10.1016/S0006-3495(98)74069-X. [DOI] [PMC free article] [PubMed] [Google Scholar]
- 44.Karbassi F, Quiros V, Pancholi V, Kornblatt MJ. Dissociation of the octameric enolase from S. pyogenes--one interface stabilizes another. PLoS One. 2010;5:e8810. doi: 10.1371/journal.pone.0008810. [DOI] [PMC free article] [PubMed] [Google Scholar]
- 45.Perugini MA, Schuck P, Howlett GJ. Differences in the binding capacity of human apolipoprotein E3 and E4 to size-fractionated lipid emulsions. Eur J Biochem. 2002;269:5939–5949. doi: 10.1046/j.1432-1033.2002.03319.x. [DOI] [PubMed] [Google Scholar]
- 46.Salter JD, Krucinska J, Raina J, Smith HC, Wedekind JE. A hydrodynamic analysis of APOBEC3G reveals a monomer-dimer-tetramer self-association that has implications for anti-HIV function. Biochemistry. 2009;48:10685–10687. doi: 10.1021/bi901642c. [DOI] [PMC free article] [PubMed] [Google Scholar]
- 47.Brown PH, Balbo A, Schuck P. On the analysis of sedimentation velocity in the study of protein complexes. Eur Biophys J. 2009;38:1079–1099. doi: 10.1007/s00249-009-0514-1. [DOI] [PMC free article] [PubMed] [Google Scholar]
- 48.Brookes E, Cao W, Demeler B. A two-dimensional spectrum analysis for sedimentation velocity experiments of mixtures with heterogeneity in molecular weight and shape. Eur Biophys J. 2010;39:405–414. doi: 10.1007/s00249-009-0413-5. [DOI] [PubMed] [Google Scholar]
- 49.Westley F, Cohen I. Tables of values relating the axial ratio to the frictional ratio of an ellipsoid of revolution. Biopolymers. 1966;4:4. [Google Scholar]
Associated Data
This section collects any data citations, data availability statements, or supplementary materials included in this article.