

Abstract
The common neurodegenerative pathologies underlying dementia are Alzheimer’s disease (AD), Lewy body disease (LBD) and Frontotemporal lobar degeneration (FTLD). Our aim was to identify patterns of atrophy unique to each of these diseases using antemortem structural-MRI scans of pathologically-confirmed dementia cases and build an MRI-based differential diagnosis system. Our approach of creating atrophy maps using structural-MRI and applying them for classification of new incoming patients is labeled Differential-STAND (Differential-diagnosis based on STructural Abnormality in NeuroDegeneration). Pathologically-confirmed subjects with a single dementing pathologic diagnosis who had an MRI at the time of clinical diagnosis of dementia were identified: 48 AD, 20 LBD, 47 FTLD-TDP (pathology-confirmed FTLD with TDP-43). Gray matter density in 91 regions-of-interest was measured in each subject and adjusted for head-size and age using a database of 120 cognitively normal elderly. The atrophy patterns in each dementia type when compared to pathologically-confirmed controls mirrored known disease-specific anatomic patterns: AD-temporoparietal association cortices and medial temporal lobe; FTLD-TDP-frontal and temporal lobes and LBD-bilateral amygdalae, dorsal midbrain and inferior temporal lobes. Differential-STAND based classification of each case was done based on a mixture model generated using bisecting k-means clustering of the information from the MRI scans. Leave-one-out classification showed reasonable performance compared to the autopsy gold-standard and clinical diagnosis: AD (sensitivity:90.7%; specificity:84 %), LBD (sensitivity:78.6%; specificity:98.8%) and FTLD-TDP (sensitivity:84.4%; specificity:93.8%). The proposed approach establishes a direct a priori relationship between specific topographic patterns on MRI and “gold standard” of pathology which can then be used to predict underlying dementia pathology in new incoming patients.
Keywords: MRI, Alzheimer’s disease, Lewy body disease, Frontotemporal lobar degeneration
INTRODUCTION
Neurodegenerative dementias are characterized immunohistochemically by the deposition of specific abnormal proteins. Clinical dementia syndromes are also characterized macroscopically by unique topographic patterns of cerebral atrophy. Presently, there can be considerable uncertainty in the clinical diagnosis of these syndromes antemortem because of clinical heterogeneity, subtle symptoms early in the disease process, and the frequent occurrence of mixed dementias. Much of the imaging literature devoted to developing automated methods to improve diagnosis in dementia has been devoted to the task of differentiating a single specific dementia from healthy elderly controls (Alexander and Moeller, 1994; Csernansky et al., 2005; Davatzikos et al., 2005; Fan et al., 2005; Freeborough and Fox, 1998; Kloppel et al., 2008b; Lao et al., 2004; Vemuri et al., 2008a). Relatively little effort has been directed at differentiating among different dementing disorders.
In this paper, we focus on the development of a diagnostic system for differentiating among the pathologies underlying the three most common causes of neurodegenerative dementia: Alzheimer disease (AD), Lewy body disease (LBD) and Frontotemporal lobar degeneration (FTLD). Since pathology is heterogeneous in FTLD, we focused exclusively on subjects with TDP-43 immunoreactive inclusions (FTLD-TDP) (Mackenzie et al., 2010) which is the most common pathology underlying the frontotemporal dementias (Josephs et al., 2004). Structural MRI measures macroscopic brain anatomy by capturing the regional variations in gray matter (GM) atrophy that is typically related to loss of neurons, synapses, and dendritic dearborization that occurs on a microscopic level in neurodegenerative diseases (Bobinski et al., 2000; Zarow et al., 2005). Our underlying assumption is that if each of these neurodegenerative dementias is examined independently in pathologically confirmed “pure” dementia cases, they will be associated with a unique pattern of atrophy in their MRI scans specific to the dementia disease process. Therefore, regional GM content in the brains of pathologically confirmed “pure” dementia subjects can be used as a library of ground truth for developing the differential diagnosis system.
We label the proposed approach where atrophy patterns estimated using structural MRI are applied for classifying new incoming patients as Differential-STAND (Differential diagnosis based on STructural Abnormality due to NeuroDegeneration). We label the 3D intracranial volume (TIV) and age adjusted regional GM Z-score information estimated using individual subject’s MRI scans relative to a bank of MRI scans from 120 cognitively normal subjects used for classification as Differential-STAND Maps. Therefore if we are able to measure the regional GM changes in the brain i.e. obtain each subject’s Differential-STAND Map, then we can use these maps to provide differential diagnosis information in new incoming MRI scans of individual patients. The differential diagnosis approach we employed in this study was based on the fact that within each dementia type, multiple clusters of different dementia sub-types exist. The broad goals of this study were two-fold:
To create an autopsy-based Differential-STAND database that encodes the patterns of atrophy unique to each of the three most common causes of neurodegenerative dementia.
To build a differential diagnosis system that separates each dementia pattern from the rest using Differential-STAND maps.
An illustration of the proposed differential diagnosis system can be seen in Fig. 1A. Using Differential-STAND maps of pathologically confirmed “pure” dementia cases as a library of scans, we can classify the scan of an incoming patient on the basis of the similarity of their structural MRI scans to some of the dementia (sub-) types present in the library (AD, LBD or FTLD-TDP).
Fig 1.
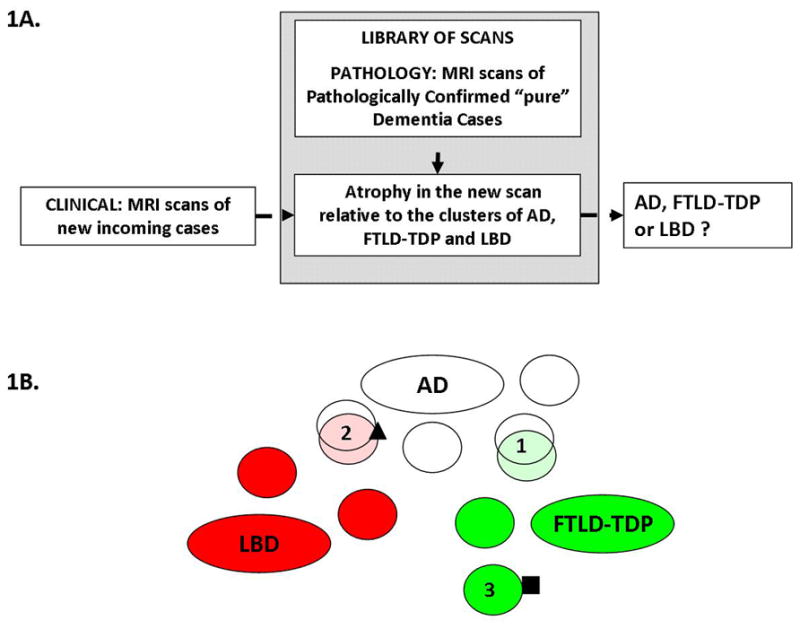
A) Schematic of the Differential-STAND system: atrophy in the new incoming scan is compared to the library of scans of pathologically confirmed cases and classified as AD, LBD or FTLD-TDP. B) Illustration of the clustering and classification approach. The dementia subtypes (or equivalently, patient clusters) are represented by ovals: white for AD, red for LBD and green for FTLD-TDP. An incoming patient, depicted as the square is diagnosed unambiguously as suffering from FTLD-TDP because he falls into the patient cluster #3 which is a subtype of FTLD-TDP. However an incoming patient depicted as a triangle will be diagnosed as belonging to cluster #2 which is a mixture of AD and LBD cases with similar atrophy patterns. Some inevitable overlap remains, mostly due to similarities in atrophy patterns between the dementia subtypes such as clusters 1 and 2.
MATERIALS AND METHODS
Subjects
All our subjects had been prospectively recruited into the Mayo Clinic Alzheimer’s Disease Research Center (ADRC), Alzheimer’s disease Patient Registry (ADPR) or Mayo Clinic behavioral neurology practice. These longitudinal studies include independent nursing, neurological, and psychometric evaluations. Each participant’s information is reviewed by a panel of neurologists, neuropsychologists, and research nurses to assign a consensus clinical diagnosis. Informed consent was obtained from all subjects for participation in the studies, which were approved by the Mayo Institutional Review Board.
Cognitively Normal subjects used to create a reference MRI data base for Age-adjustment
One hundred and twenty cognitively normal (CN) subjects were chosen for age-adjustment of regional gray matter density i.e. to create a reference MRI database. The selection criterion was as follows: Inclusion Criteria: The subjects maintained a clinical diagnosis of normal throughout their recorded medical history with a minimum follow-up time from the MRI scan of two years. Exclusion Criteria: Subjects were excluded: 1) if the patient had any possible diagnosis of dementia; any conversion to mild cognitive impairment or dementia or other neurodegenerative disease in the course of the entire follow-up; 2) if the patient had a secondary diagnosis other than depression; 3) if the patient’s last ADRC/ADPR visit had a CDR sum of boxes score greater than 0, an MMSE score of less than 28 or a short-test score less than 33 (these scores represent approximately the 25th percentile of all CN patients); 4) or if patients have an average cognitive decline of 1.0 or more points (of MMSE or short-test) per year. We selected these subjects in a manner that achieved a fairly uniform distribution of age across our clinical control group. We obtained roughly the same number of subjects in each age bin beginning at: 55–65, subsequent bins encompassed 3 year intervals 66–68, 69–71 etc, through the last bin which included ages 87+. The 120 clinically identified CN subjects were used for age-adjustment while a separate group of 21 pathologically identified CN subjects were used for identifying anatomic pattern differences between dementia cases and these pathological controls. These pathologically CN were identified by excluding all autopsy cases for the presence of any dementia pathology.
Pathologically Confirmed Dementia Cases
Subjects that met the pathological diagnosis of AD, lewy body disease (LBD) and FTLD-TDP and had received a 3D volumetric T1-weighted structural MRI scan at the time of clinical diagnosis of dementia were identified. The first available MRI scan at the time of dementia diagnosis was used in order to identify the most specific anatomic signature for each pathological entity. All subjects were required to have had a clinical diagnosis of dementia at the time of the MRI. The diagnosis was made based on the Diagnostic and Statistical Manual of Mental Disorders, Fourth Edition (American Psychiatric Association, 1994) and is also well-documented in (Knopman et al., 2003). Specific clinical diagnoses were made according to established criteria for AD (McKhann et al., 1984), dementia with Lewy bodies (DLB) (McKeith et al., 2005), behavioral variant frontotemporal dementia (bvFTD), semantic dementia, progressive non-fluent aphasia (Neary et al., 1998)or corticobasal syndrome (Boeve et al., 2003). We included subjects diagnosed with only single dementia pathology from the neuropathology files of the Mayo Clinic, Rochester, MN using the following neuropathological criteria:
Alzheimer Disease
Subjects were included if they fulfilled high probability of AD according to the National Institute on Aging and Reagan Institute Working Group on Diagnostic Criteria for the Neuropathological Assessment of Alzheimer’s disease (NIA-Reagan, 1997). Subjects were excluded if they had pathological evidence of hippocampal sclerosis, vascular dementia, or a non-AD neurodegenerative disorder.
FTLD-TDP
The FTLD group consisted of subjects with a pathological diagnosis of FTLD-TDP (Mackenzie et al., 2010). The pathological diagnosis of FTLD-TDP was based on the presence of inclusions that stained positive for TDP-43 and ubiquitin, yet stained negative for tau, neurofilament, and α-synuclein, in frontal or temporal cortex, and the hippocampus dentate granular cells (Whitwell et al., 2009b). Subtyping based on the morphological appearances and distribution of TDP-43 immunoreactive inclusions was performed using a published classification scheme (Mackenzie et al., 2006). Of the 47 subjects in the study, two were FTLD-TDP type 0, 22 were FTLD-TDP type 1, nine were FTLD-TDP type 2, 11 were FTLD-TDP type 3, and the type was unknown in three cases.
Lewy Body Disease
Subjects who fulfilled pathologically high likelihood of LBD according to the third consortium of DLB and had evidence of widespread α-synuclein positive Lewy bodies in limbic or neocortex that meet published criteria for neocortical or limbic variant of LBD (McKeith et al., 2005) were considered for these study. Subjects must have no histological evidence of probable or definite AD based on the CERAD criteria (Mirra et al., 1991).
We identified a “pure” pathology group of 48 AD, 20 LBD and 47 FTLD-TDP, using the criteria described above. A group of 21 pathologically normal cases with a clinical diagnosis of cognitively normal were identified in order to obtain group differences between the Differential-STAND Maps of CN and each dementia. All pathologically identified CN subjects had low NIA-Reagan and the only other pathology found was argyrophilic grains, a common pathological feature of aging (Josephs et al., 2006b). The characteristics of all subjects used in this study are shown in Table 1.
Table 1.
Demographics
| Reference | CN n = 21 | Path confirmed | FTD n = 47 | ||
|---|---|---|---|---|---|
| CN scans n = 120 | AD n = 48 | DLB n = 20 | |||
| No. with scan primary diagnosis matches pathology (%) | 120 (100) | 19 (90) | 43 (90) | 14 (70) | 38 (81) |
| No. of females (%) | 63 (53) | 14 (67) | 27 (56) | 7 (35) | 23 (49) |
| Median age at scan, yr (min, max) | 76 (55, 90) | 84 (53, 99) | 76 (46, 96) | 74 (59, 89) | 59 (34, 84) |
| Median age at death, yr (min, max)* | 89 (75, 99) | 89 (57, 103) | 81 (51, 103) | 78 (62, 93) | 67 (35, 90) |
| Median time from scan to death, yr (min, max) | 7.6 (3.1, 11.4) | 4.0 (1.2, 10.5) | 5.4 (2.3, 12.4) | 4.4 (0.2, 8.0) | 3.7 (0.2, 9.0) |
| Median education, yr (min, max) | 14 (8, 20) | 15 (8, 20) | 14 (8, 18) | 15 (8, 20) | 14 (8, 20) |
| No. of APOE e4 carriers (%)† | 32 (27) | 5 (24) | 25 (54) | 8 (42) | 8 (27) |
| Median MMSE (min, max) | 29 (24, 30) | 29 (25, 30) | 23 (11, 29) | 24 (15, 28) | 24 (2, 30) |
| Median CDR sum of boxes (min, max) | 0.0 (0.0, 0.5) | 0.0 (0.0, 2.0) | 4.0 (0.5, 17.0) | 4.3 (1.5, 11.0) | 5.5 (0.5, 18.0) |
There were 33 patients from the control reference scan group that died.
There were 20 patients missing APOE genotyping.
MRI Acquisition
MRI studies were performed on 1.5 Tesla GE-SIGNA MRI scanners (GE Medical Systems, Waukesha, WI) using a standard transmit-receive volume head coil. All Mayo scanners undergo a standardized quality control calibration procedure every morning which monitors geometric fidelity over a 200 mm volume along all three cardinal axes, signal to noise ratio, and transmit gain. Subject images were obtained using a standardized imaging protocol that included a coronal T1-weighted 3-dimensional volumetric spoiled gradient echo (SPGR) sequence.
Computation of Differential-STAND Map for each subject
In order to estimate the gray matter density in different regions-of-interest (ROI) of the brain, an anatomic atlas from (Tzourio-Mazoyer et al., 2002) was modified in-house to fit a custom MRI template of elderly population (Vemuri et al., 2008a). This atlas includes a dorsal midbrain ROI because a recent study from our group found that there was a reduction in the dorsal mesopontine GM density in DLB (Whitwell et al., 2007) which is associated with significant loss of cholinergic neurons. SPM5 was used for tissue segmentation and normalization. First, all structural T1-weighted MR images were normalized to the custom template and segmented into gray matter (GM), white matter (WM) and cerebrospinal fluid (CSF), using the unified segmentation routine in SPM5 (Ashburner and Friston, 2005), with the customized tissue probability maps corresponding to the custom template described above. Next, the inverse spatial normalization parameters were applied to the atlas, to produce a subject specific atlas, with the 118 ROIs labeled on the subjects MRI scan, and the GM of each patient was parcellated into ROIs. The total GM density in each ROI was obtained by multiplying the mean per-ROI GM probability by the number of GM voxels in the ROI and the voxel volume of the image. For the analysis in this study, we excluded regions in the cerebellum and pons leaving us with 91 ROIs from each subject scan. Total GM density in each ROI was scaled by the subject’s total intracranial volume (TIV) to adjust for head size differences. The TIV was also estimated using atlas normalization method described above. The 120 clinically defined CN subjects were used to compute age-adjusted Z-scores for the mean volume per ROI as follows: First, a linear regression model (GM in an ROI = m*DeltaAge + c) for each ROI was build using the 120 CN patients where DeltaAge is difference in age of the subject from the mean age of the 120 CN (mean age=75 years). Then, the parameters m and c from the model were applied to remove age related bias in each of the ROIs in the test dataset which included the Path CN, LBD, FTLD-TDP and AD. For each individual scan, the final Differential-STAND map represents age and TIV adjusted Z-scores of regional GM information (in 91 regions). Differential-STAND map was constructed for each of the patients used in this study.
Differential-STAND Maps specific to each Neurodegenerative Dementia
To determine the key differences between the patterns of atrophy in different neurodegenerative dementias, we performed a t-test between Differential-STAND Maps of pathology confirmed cases in each dementia group and the Differential-STAND Maps of the pathology confirmed CN group (n= 21).
Differential Classifiers
Our preliminary data analysis suggested that within each dementia type, multiple clusters of dementia sub-types exist. The subtypes or clusters we observe were not necessarily clinical subtypes but are discovered computationally through clustering of the patients solely based on their MRI features. We also found that there is considerable overlap among the three dementia pathologies. The approach we took in this work is to utilize clusters within each dementia type to reduce the overlap between the dementia types and separate them better. For diagnosing a new incoming patient, we only use the closest clusters rather than all the clusters in each dementia type. A simplistic two dimensional illustration of our approach is shown in Fig 1B. An incoming patient, depicted as the square in the figure, is diagnosed unambiguously with FTLD-TDP because he/she falls into the patient cluster #3 which is a cluster of FTLD-TDP. On the other hand, some pathology confirmed FTLD-TDP cases or LBD cases have medial temporal atrophy associated with memory problems. These cases are illustrated by clusters 1 and 2 in Fig. 1B.
As we discussed above, classification is carried out on the basis of dementia type in the closest clusters, which are discovered computationally via clustering. The diagnosis for a patient is the prevalent disease type in the patient cluster that the patient in question is most likely to fall into. Mathematically, this approach corresponds to a simplified mixture model (Bishop, 2006), which we will describe below. The single biggest challenge in this data set lies in its high dimensionality of the MRI data (high number of ROIs) compared to the small number of patients. Therefore we took the following approach: The dimensionality of the MR image is reduced by embedding the data into a new, lower-dimensional space that preserves the differences between the dementia types. This was accomplished using regularized discriminant analysis and we refer to the resulting dimensionality-reduced space as the discriminant space. Next, we identify the dementia clusters using the bisecting k-means algorithm in the discriminant space. Finally, we model the dementia types using our simplified mixture model. Upon classifying a patient, we map their MR image into the dimensionality-reduced discriminant space, determine the cluster that the patient falls into (the cluster whose centroid is closest to the point representing the patient in discriminant space) and apply the mixture model. We elaborate on each of these steps below:
-
Dimensionality reduction: We compute an appropriate dimensionality reduced space using all the subjects. Linear discriminant analysis (LDA) (Johnson and Wichern, 2002) is a popular technique for computing a projection of a data set into a set of discriminant dimensions where the separation among the classes is maximal.
Let X be an n × p observation matrix for n patients in C different classes and p ROIs. Let matrix B denote the between-class variance and S denote the within-class variance defined as follows.with X̄c denoting the mean observation for class c, nc being the number of patients in class c and Xi representing the observation vector for patient i. LDA aims to find a direction, denoted by w, in which the between-class variance is maximal relative to the within-class variance. Mathematically, LDA maximizes .
LDA in its original form is not suitable for high-dimensional problems, but regularizing LDA offers a remedy (Guo et al., 2007). In the regularized formulation, the criterion to maximize becomes . This modification allows for preventing over-fitting by assigning 0 or very minimal weights to less relevant ROIs. We used regularized LDA to compute a discriminant space of three dimensions, where each dimension is a regularized LDA direction discriminating one dementia type from the rest. Regularization parameters were selected using cross-validation.
Clustering Approach: We use the bisecting k-means algorithm for clustering of the patients. Most algorithms in the k-means family require the user to supply the number of clusters –i.e. the number of dementia types in our application. This number is not known a priori. Bisecting k-means is a hierarchical version of the k-means clustering (Steinbach et al., 2000), where clusters are recursively bisected as long as the resulting clusters are not too small (the only constraint being that each cluster must have at least five patients). This setup allows us to discover the number of clusters automatically. Repeated applications of k-means can lead to different clusterings; among the different clusterings, some clusters will contain exactly the same set of patients, while other clusters will contain different sets of patients. We refer to the first type of clusters as stable clusters and to the latter type as arbitrary clusters. Stable clusters indicate the presence of clear cluster structure while arbitrary clusters indicate the lack of clear cluster structure in the corresponding region of the discriminant space. In practice we determine the stable clusters by running the bisecting k-means clustering twice and retaining only those clusters that have 100% overlap across the two clustering and the rest of the clusters are labeled arbitrary clusters. We focus on stable clusters because they provide reliable classification. Bisecting k-means does not take the dementia types into consideration; it merely groups patients into clusters based on the similarity of their gray matter atrophy. Since the similarity is measured in discriminant space, it is related to dementia types; the assumption is that a patient is more similar to patients with the same dementia type than to patients with different dementia types. A stable patient cluster will be comprised of patients who are pathologically similar to each other but distinctly different from patients in other clusters, hence they represent a unique dementia cluster. Conversely, patients in the arbitrary clusters are either insufficiently similar to each other or they fail to be distinctly different from others. Therefore arbitrary clusters may not represent unique dementia clusters and were not be utilized for building the mixture model. The clustering step was done based on the data set and information regarding the different pathological classes was not used for clustering.
-
Classification: Finally, we use a simplified mixture model to classify patients based on the true pathological classes available. Assume we have T dementia types and we discovered Cstable patient clusters. Let x denote a point in the discriminant space that corresponds to the patient to be diagnosed. The diagnosis is the most likely dementia type where Pr denotes the probability function. The dementia type is determined based on the cluster c that the patient is most likely to fall into . To simplify computation, we use crisp assignment i.e. each patient is assigned to a single cluster, namely to the one whose centroid is closest to x in the discriminant space. Formally,
where ||a,b|| is the Euclidean distance between points a and b and centroid(Cj) denotes the centroid of the j-th cluster. Pr [t|c] is the portion of patients in cluster c with dementia type t. The probabilistic approach of mixture models allows us to assess our confidence in the classification. If the cluster indeed represents a dementia type, then the distribution of dementia types that the constituent patients suffer from are strongly skewed towards a single specific type; i.e. for each dementia type t, Pr [t|c] is either close to 0 or close to 1. If Pr [t|c] is neither close to 0 nor 1, then the cluster is either not representative of a specific dementia type, or the cluster is inherently a mixture of multiple dementia types.
RESULTS
Differential-STAND Maps specific to each Neurodegenerative Dementia
The t-statistics of the significant neurodegenerative ROIs (p<0.01) in the group composite Differential-STAND Maps of the AD, FTLD-TDP and LBD groups are shown in Fig. 2. The primary regions of neurodegeneration in the AD group were throughout the medial and lateral temporal lobes, inferior parietal lobe and insula. The other less significant regions involved were in superior and medial parietal, left frontal and occipital lobes. The FTLD-TDP group had significant atrophy throughout the frontal lobes except the precentral gyrus bilaterally. The other regions involved were insula, anterior cingulate, anteromedial temporal lobes, temporal pole, middle and inferior temporal gyri, caudate nucleus and inferior parietal lobe. In the LBD group, there were only six significant regions at p<0.01 level: bilateral amygdala, dorsal midbrain ROI, bilateral inferior temporal lobes and left middle temporal lobe.
Fig. 2.
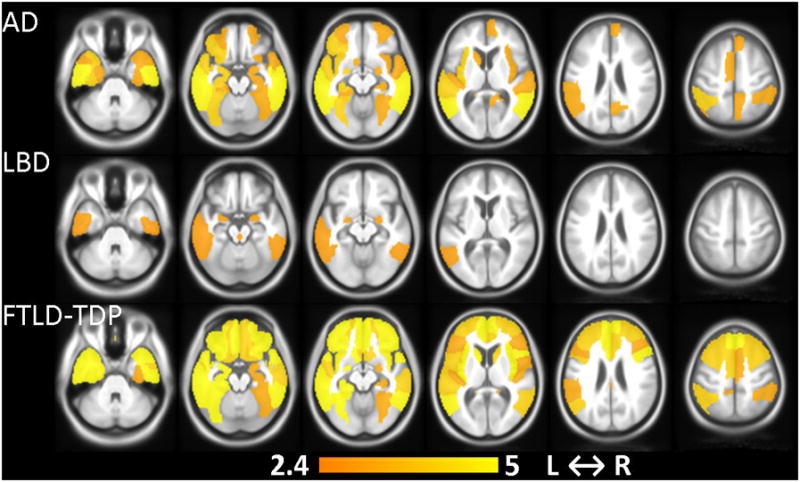
Differential-STAND Map patterns of gray matter loss that are specific to each dementia (AD, LBD, FTLD-TDP) identified when compared to pathology confirmed CN. Colorbar represents the t-statistic (p<0.01 uncorrected).
Differential-STAND Maps of individual subjects typical for AD, FTLD-TDP and LBD are shown in Fig. 3 with highlighted regions representing Z-scores less than −1. The AD subject shown is a 90 year old male with a clinical diagnosis of probable AD (CDR-SB=4.0) who had significant atrophy in the left and right hippocampus and bilateral mid and posterior-cingulum. The FTLD-TDP subject shown is a 67 year old male with clinical diagnosis of bvFTD with CDR-SB=1.5 who had significant atrophy throughout the frontal and temporal lobes bilaterally; but notably (and unlike the AD subject) had sparing of the posterior cingulate. The LBD subject shown is a 59 year old female with clinical diagnosis of DLB (CDR-SB=8.0) and had low GM Z-scores in bilateral amygdalae and dorsal midbrain ROI with additional low Z-scores in the right inferior parietal as well as left mid-occipital lobes.
Fig. 3.
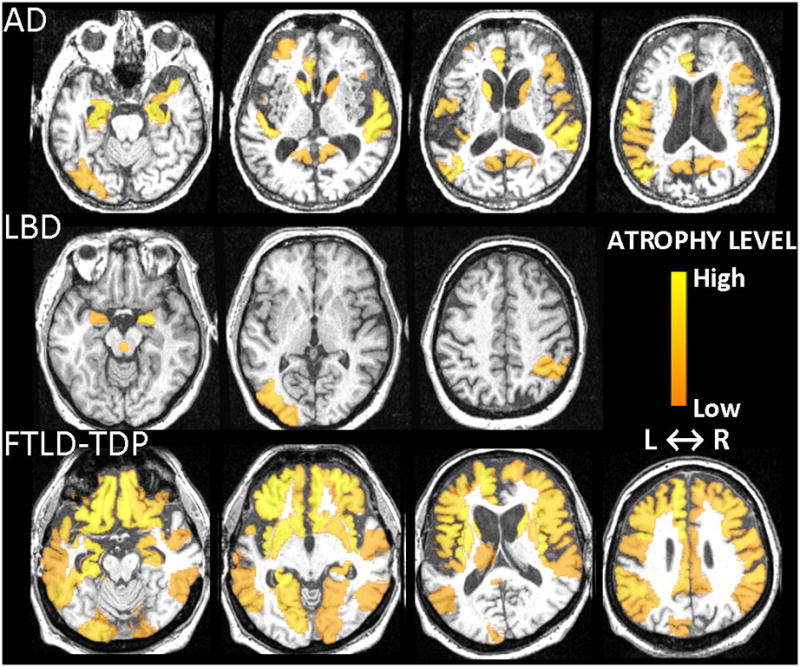
Typical Differential-STAND Maps of three different patients: AD, LBD and FTLD-TDP (Z-scores<−1). Colorbar represents the atrophy level relative to the CN reference image database and absolute value of the Z-score is shown.
Clustering and Classification of Patients
After dimensionality reduction, the patients are clustered using bisected k-means. After clustering the patients into multiple clusters, new incoming subjects are classified based on their closeness to each of these clusters. The mean sensitivity, specificity and their standard deviations was estimated using leave one out cross-validation in 100 independent runs and are tabulated in the top part of Table 2. Sensitivity and specificity were computed within all the dementia groups (AD, LBD, FTLD-TDP). As an example, sensitivity of AD was computed as the number of AD cases that were correctly classified as AD divided by the total number of AD cases and specificity was computed as the number of non-AD cases that were correctly classified as non-AD divided by the total number of non-AD cases. Accuracy was computed by estimating the true positive and true negative for each dementia subtype divided by the total number of samples. The clinical sensitivity and specificity are tabulated at the bottom of Table 2. The criteria used to estimate the sensitivity and specificity of the clinical diagnosis assuming pathology as the gold standard was as follows: clinically identified AD cases must have been classified as pathological AD, clinically identified DLB must have been classified as LBD. Patients with FTLD-TDP must have been diagnosed clinically with one of the FTLD spectrum disorders, including behavioral variant frontotemporal degeneration, progressive non-fluent aphasia, semantic dementia, or corticobasal degeneration.
Table 2.
Estimated performance of the proposed Differential-STAND system and clinical diagnosis.
| A. Performance of the Proposed Differential-STAND system | ||
|---|---|---|
| Underlying Dementia Pathology | Sensitivity (mean ± sd) | Specificity (mean ± sd) |
| AD | 90.7 ± 6.5 % | 84 ± 4.5 % |
| LBD | 78.6± 5.2 % | 98.8 ± 1.8 % |
| FTLD-TDP | 84.4 ± 5.8 % | 93.8 ± 3.6 % |
|
B. Classification based on Clinical Diagnosis | ||
| Underlying Dementia Pathology | Sensitivity | Specificity |
| AD | 89.5 % | 82.1 % |
| LBD | 70 % | 100 % |
| FTLD-TDP | 83.0% | 95.6% |
As mentioned earlier, repeated applications of k-means can lead to different clusterings. While some clusters will contain exactly the same set of patients (Stable clusters), other clusters will contain different sets of patients (Arbitrary clusters). A two dimensional representation of clustering of all the patients is shown in Fig. 4. We can observe that there are some clusters of different dementia pathologies that are close in these two dimensions showing the overlap of the features.
Fig. 4.
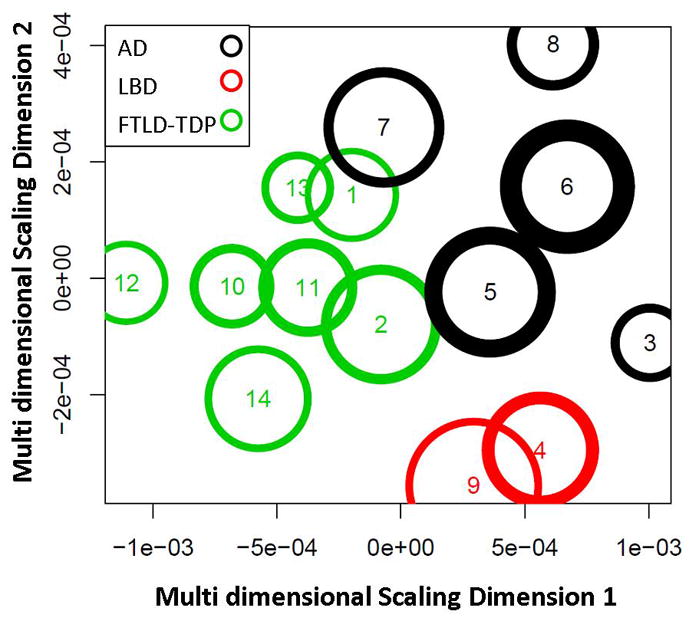
The multi-dimensional scaled dimensions 1 and 2 of a specific instance of the estimated stable clusters and their corresponding labels using the proposed differential STAND approach. The multi-dimensional scaled dimensions represent a transformation of the high dimensional Z-score GM densities and the transformation preserves the distances between the cluster centers and the cluster radii.
DISCUSSION
A differential diagnosis system for classifying demented patients based on their MRI scans is presented in this paper. The main findings of the paper are: 1) Patterns identified in the Differential STAND maps in each neurodegenerative dementia (AD, FTLD-TDP and LBD) are unique and mirror anatomic patterns of pathological neurodegeneration established in autopsy studies. 2) Differential classification based on structural MRI scan provides reasonable differential diagnostic accuracy of dementia in subjects antemortem with accuracy of differentially diagnosing AD 87%, LBD 95% and FTLD 90%. Importantly we describe a proof-of-concept differential diagnostic system based on structural MRI that considers the three common neurodegenerative dementias simultaneously as opposed to the more typical approach of systems that distinguish a single dementing disorder from cognitively normal elderly subjects.
An important feature of the proposed system is the use of “pure” autopsy confirmed cases for building the differential diagnosis system. This addresses two potentially significant confounding issues; situations where clinical presentation does not predict the correct underlying pathology, and patients with mixed pathologies which would obfuscate the desired objective of mapping MRI patterns onto specific neurodegenerative pathologies. Other studies have established regions of atrophy based on MRI for differential diagnosis between AD and FTD (Davatzikos et al., 2008; Foster et al., 2007; Horn et al., 2009; Kloppel et al., 2008a; Rabinovici et al., 2007). Likewise, (IMP) SPECT (Ishii et al., 2009) and (11C-DTBZ and 18F-FDG) PET studies (Koeppe et al., 2005) have addressed differential diagnosis of FTD, AD and DLB in clinical subjects. All of these studies have focused on pair wise differential diagnosis (i.e. AD vs. FTD, AD vs. DLB etc) but none have addressed the simultaneous differential diagnosis of all three common neurodegenerative causes of dementia using patterns of neurodegeneration from antemortem scans of pathology confirmed dementia cases.
In AD, the topographic distribution of neurofibrillary tangles (NFT) follows a fairly stereotypical pattern of progression (Braak and Braak, 1991) and it has been shown that atrophy seen on MRI correlates well with pathological Braak NFT stages (Gosche et al., 2002; Jack et al., 2002; Vemuri et al., 2008b; Whitwell et al., 2008) and with NFT density (Csernansky et al., 2004; Silbert et al., 2003). The neurodegenerative patterns we found in pathologically confirmed AD, as illustrated in Fig. 2, are concordant with the Braak NFT pattern.
Pathologically, FTLD is very heterogeneous (Forman et al., 2006; Hodges et al., 2004; Josephs et al., 2006a) and can be characterized by the deposition of both TDP-43 and tau. In this paper we considered only subjects with FTLD-TDP, the most common pathology underlying the frontotemporal dementias, because we wanted to develop a differential diagnosis system for diagnosis of pathology rather than diagnosis of clinical dementia type. Our results concur with previous pathological and imaging studies that have demonstrated progressive degeneration of the frontal and temporal lobes, with relative sparing of the parietal and occipital lobes, in frontotemporal dementia (Broe et al., 2003; Kril et al., 2005; Seeley et al., 2008; Whitwell et al., 2009b). Patterns of atrophy typically vary according to the specific clinical syndrome (Rosen et al., 2002), although we have allowed for this variability by applying a cluster-based approach to classification.
In LBD, the major pathological findings are Lewy bodies and Lewy neurites with degeneration of several neurotransmitter systems, most notably dopaminergic and cholinergic. The concentration of LB pathology is high in the amygdalae and various brain stem locations with low densities in the neocortical regions (Dickson, 2002; Klucken et al., 2003). A recent pathology study demonstrated that LBD is associated with depletion of cholinergic neurons in the pedunculopontine tegmental and laterodorsal tegmental nuclei present in the dorsal midbrain (Schmeichel et al., 2008) which agrees with the findings of a recent voxel based morphometry (VBM) study of DLB patients (Whitwell et al., 2007). The most severe supratentorial LB pathology is observed in the amygdale, often early in the disease (Marui et al., 2002). Also dysfunction of the visuo-amygdaloid pathway has been implicated in visual misidentification and visual hallucinations (Yamamoto et al., 2006). LBs and degeneration of amygdala might be one of the underlying causes of visual misidentification in LBD patients (Harding et al., 2002; Iseki et al., 2001; Yamamoto et al., 2006). The inferior temporal lobe is a unimodal visual association cortex related to the visual recognition network (Benarroch, 2006) and the structural abnormality of inferior longitudinal fasciculus has also been observed in diffusion tensor studies in DLB (Kantarci et al., 2010; Ota et al., 2009)., Thus, the regions of GM loss we found in LBD patients (Fig. 2) are consistent with the imaging and pathology literature in LBD.
One of the key problems in the field of dementia diagnosis is the antemortem separation of LBD subjects from AD. LBD subjects are often misclassified as AD and the sensitivity of DLB diagnosis in different studies varies between 0–100 percent (McKeith et al., 2004). AD and LBD pathology both increase in prevalence dramatically with age. The pathological hallmarks of AD (NFTs and neuritic plaques) and LBD (LBs) often coexist and there is evidence that the same neuronal circuits are disturbed within the hippocampal formation in both diseases (Klucken et al., 2003). For this reason there is a high probability of including mixed AD and LBD cases in MRI studies that are based on clinical diagnosis, which often leads to the conclusion that the patterns of atrophy overlap in AD and LBD. A unique feature of this study was that we included only pathologically confirmed LBD cases which helped us identify the following distinctive features that differentiate LBD from AD: 1) significant gray matter loss is confined to the amygdalae and middle temporal lobe in LBD whereas in AD it is throughout the entire medial temporal lobe (Gomez-Isla et al., 1999; Hashimoto et al., 1998; Lippa et al., 1998) and 2) decreased GM is present in the dorsal ponto-mesencepalic junction area in LBD (Schmeichel et al., 2008). Even though the sensitivity of LBD diagnosis was only 79%, the high specificity of 99 % indicates that it can be used to detect “pure” LBD cases with a relatively small number of false positives. In the specific example shown in Figure 2, MRI features were able to classify all ten patients in cluster #4 correctly as LBD where as three out of the ten LBD subjects were misclassified as AD clinically. This cluster consists of mild LBD cases which might be difficult to separate clinically from AD early in the disease process in the absence of all the LBD symptoms. Another interesting observation was cluster #3 where mild AD and LBD patients were clustered together due to similarity of features.
An MRI based automated differential diagnosis technique such as the one proposed here could be a very useful adjunct tool to clinical evaluation because it requires minimal human intervention, adjusts for aging related changes and may be able to extract subtle changes in brain structures that are difficult to assess by visually examining MRI scans. The proposed classification approach based on clustering has several advantages: Diagnosis is only made on stable clusters which may either be “pure” clusters (only a single dementia type) or “mixed” clusters (clusters that are a mixture of two or more dementia types) as shown in Figure 4. The arbitrary clusters are excluded from the decision making process due to the lack of a clear cluster structure based on the features from MRI. In the cases of “pure” clusters, Differential-STAND based pathology diagnosis has the highest chance of being correct while diagnosis on clinical information could possibly be misleading in a few cases. In the “mixed” clusters, the confidence of the MRI diagnosis is lower than that of the clinical diagnosis due to the considerable overlap in the MRI features. Theoretically the end user could be cautioned if the new incoming patient falls in a mixed cluster in order to facilitate an informed decision.
Additionally, Differential-STAND Maps provide a visual assessment of the ROIs that appear to be abnormal when compared to a normal database and when evaluated by the differential diagnosis system, provide information about the likely type of dementia pathology in demented patients. The construction of the algorithm using multi-ROI level GM volume rather than voxel-level GM volume addresses two issues: 1) smaller number of features containing GM sampled from across the entire brain rather than a very high dimensional feature set of GM voxels which will not provide good differential diagnosis due to the limited number of training samples and 2) reduces the number of false positives of voxel level differences that arise due to registration and segmentation errors.
Even though there are several two-class classification frameworks that are typically applied in the neuroimaging literature, the approach presented in this paper provides a conceptually elegant solution for the multi-class problem. The main reasons being 1) moving forward, the clustering of subjects into dementia sub-types might provide useful clinical or pathological subtype information regarding the disease; 2) the proposed approach is extremely useful in determining the pathology underlying mixed dementias which constitute of more than 40 % of all dementia cases. If we wanted to use a two-class SVM based framework like we used in our previous papers, then we would have to make a decision of applying either a pair-wise SVM or one-against-all SVM which is not conducive while attempting to visualize the distance of a specific patient from the different dementia sub-types. In contrast, the proposed approach naturally lends itself to simultaneously determining where the subject falls with respect to various dementia sub-types.
Value of Differential STAND approach to clinical diagnosis
There can be considerable mismatch between the antemortem clinical diagnosis and the gold standard postmortem pathology, specifically in FTLD-TDP and LBD. Autopsy confirmed studies have found that most FTD patients also fulfill the diagnostic criteria of AD (Varma et al., 1999) and LBD subjects are often misclassified as AD (McKeith et al., 2004). There can be low inter-rater reliability for differential diagnosis of neurodegenerative dementias, with the lowest generalized kappa of 0.37 for DLB diagnosis in (Lopez et al., 1999). Additionally, there can be considerable syndromic heterogeneity, e.g. some pathology confirmed FTLD-TDP cases have prominent anterograde amnesia while some pathology confirmed AD cases have mainly aphasia (Alladi et al., 2007; Josephs et al., 2008). There were some pathological confirmed cases which highlight this syndromic heterogeneity where both clinical as well as differential STAND classification were incorrect and both methods made similar mistakes possibly due to atypical patterns of atrophy presenting atypical clinical symptoms. Given that proteinopathy does not map exactly onto the clinical expression of the disease, we believe that complementary measures, such as the output of this system, can add great value to clinical diagnosis in conjunction with established clinical evaluation methods.
We acknowledge that the diagnostic accuracy of the Differential-STAND system is very similar to the accuracy based on clinical classification. However, we envision the added value of Differential-STAND system to clinical diagnosis will occur in subjects who have dementia that is difficult to classify (which the Differential-STAND approach was able to make correct pathological classification in all the cases), mixed dementia pathologies, mildly symptomatic subjects early in the disease process who have not yet presented symptoms clinically (e.g. mild LBDs in cluster #9), and clinically atypical cases. It has in fact been previously shown at the group-level that patterns of atrophy on MRI can help identify the presence of AD pathology in subjects with atypical clinical syndromes (Josephs et al., 2010; Whitwell et al., 2009a), suggesting that an individual-level differential-STAND approach could be very useful. Finally we note that while the diagnostic performance of Differential-STAND was similar to that of clinicians, the clinicians who proved the diagnoses in our study were highly skilled behavioral Neurology specialists practicing in a large tertiary referral medical center (Mayo Clinic). We expect that diagnostic performance of clinicians who do not see large numbers of neurodegenerative dementia patients would be worse. Diagnostic performance data support this assumption, for example the sensitivity of DLB diagnosis varies between 0–100 percent (McKeith et al., 2004) depending on the expertise of the clinician. In contrast, Differential-STAND is not based on clinical expertise but simply on a subject’s MRI scan which is independent of site to site variation in clinical expertise. We therefore expect that a major clinical utility of the Differential-STAND system would be in situations where highly skilled clinical experts are not available. Similar findings have been reported in the FDG PET literature indicating that the use of imaging (PET scans) can add valuable information to clinical evaluation particularly in situations where highly skilled specialists are not available (Silverman et al., 2002).
Limitations of this study
A scheme for pathological staging of disease severity that maps to cortical atrophy exists for AD (Braak staging) but analogous pathological schemes for staging severity and atrophy do not exist for FTLD-TDP or LBD. If accepted pathological severity staging schemes existed for FTLD-TDP and LBD, it would allow the development and validation of a system that could assign the relative contribution of each pathology subtype. However at the present time, the proposed system would deal with the problem of mixed pathologies by assigning the subjects with mixed pathologies to the atrophy pattern matching the Differential-STAND Maps of the dominant neurodegenerative pathology (underlying the dementia).
Strength of this study is the use of autopsy diagnoses as the gold standard. This is at the same time a weakness, because to our knowledge, no center world wide including our own is in possession of a large enough sample of subjects with antemortem protocol MRIs and autopsy diagnoses in all three diseases to permit splitting the sample into independent training and test samples. Due to the small number of autopsy confirmed pure dementia cases, we do not have an independent test dataset where new subjects would be input into the Differential-STAND Map based system that had not been used to construct the classifier..
It is inevitable that the identified pathologically confirmed CN subjects are older than the dementia cases specifically in the FTLD-TDP group. However the application of the age-adjustment of GM based on a uniform distribution of a large cohort of CN subjects ensures that this age effect is minimized.
Vascular pathology has not been considered in this work at the present time and will be part of our future training databases.
Acknowledgments
This work was supported completely by Mayo ADRC pilot grant and NIH grants R01 AG11378, K23 AG030935, R01 AG15866, P50 AG16574, U01 AG06786, Robert H. Smith Family Foundation Research Fellowship, Alexander Family Alzheimer’s Disease Research Professorship and Opus building grant NIH C06 RR018898.
Footnotes
Publisher's Disclaimer: This is a PDF file of an unedited manuscript that has been accepted for publication. As a service to our customers we are providing this early version of the manuscript. The manuscript will undergo copyediting, typesetting, and review of the resulting proof before it is published in its final citable form. Please note that during the production process errors may be discovered which could affect the content, and all legal disclaimers that apply to the journal pertain.
References
- Alexander GE, Moeller JR. Application of the scaled subprofile model to functional imaging in neuropsychiatric disorders: a principal component approach to modeling regional patterns of brain function in disease. Human Brain Mapping. 1994;2:79–94. [Google Scholar]
- Alladi S, Xuereb J, Bak T, Nestor P, Knibb J, Patterson K, Hodges JR. Focal cortical presentations of Alzheimer’s disease. Brain. 2007;130:2636–2645. doi: 10.1093/brain/awm213. [DOI] [PubMed] [Google Scholar]
- American Psychiatric Association. Diagnostic and Statistical Manual of Mental Disorders. 4. American Psychiatric Association; Washington DC: 1994. (DSM IV) [Google Scholar]
- Ashburner J, Friston KJ. Unified segmentation. Neuroimage. 2005;26:839–851. doi: 10.1016/j.neuroimage.2005.02.018. [DOI] [PubMed] [Google Scholar]
- Benarroch EE. Basic Neurosciences with clinical applications. Elsevier; Philadelphia: 2006. [Google Scholar]
- Bishop CM. Pattern Recognition and Machine Learning. 1. Springer; New York: 2006. [Google Scholar]
- Bobinski M, de Leon MJ, Wegiel J, Desanti S, Convit A, Saint Louis LA, Rusinek H, Wisniewski HM. The histological validation of post mortem magnetic resonance imaging-determined hippocampal volume in Alzheimer’s disease. Neuroscience. 2000;95:721–725. doi: 10.1016/s0306-4522(99)00476-5. [DOI] [PubMed] [Google Scholar]
- Boeve BF, Lang AE, Litvan I. Corticobasal degeneration and its relationship to progressive supranuclear palsy and frontotemporal dementia. Ann Neurol. 2003;54(Suppl 5):S15–19. doi: 10.1002/ana.10570. [DOI] [PubMed] [Google Scholar]
- Braak H, Braak E. Neuropathological stageing of Alzheimer-related changes. Acta Neuropathol (Berl) 1991;82:239–259. doi: 10.1007/BF00308809. [DOI] [PubMed] [Google Scholar]
- Broe M, Hodges JR, Schofield E, Shepherd CE, Kril JJ, Halliday GM. Staging disease severity in pathologically confirmed cases of frontotemporal dementia. Neurology. 2003;60:1005–1011. doi: 10.1212/01.wnl.0000052685.09194.39. [DOI] [PubMed] [Google Scholar]
- Csernansky JG, Hamstra J, Wang L, McKeel D, Price JL, Gado M, Morris JC. Correlations between antemortem hippocampal volume and postmortem neuropathology in AD subjects. Alzheimer Dis Assoc Disord. 2004;18:190–195. [PubMed] [Google Scholar]
- Csernansky JG, Wang L, Swank J, Miller JP, Gado M, McKeel D, Miller MI, Morris JC. Preclinical detection of Alzheimer’s disease: hippocampal shape and volume predict dementia onset in the elderly. Neuroimage. 2005;25:783–792. doi: 10.1016/j.neuroimage.2004.12.036. [DOI] [PubMed] [Google Scholar]
- Davatzikos C, Resnick SM, Wu X, Parmpi P, Clark CM. Individual patient diagnosis of AD and FTD via high-dimensional pattern classification of MRI. Neuroimage. 2008;41:1220–1227. doi: 10.1016/j.neuroimage.2008.03.050. [DOI] [PMC free article] [PubMed] [Google Scholar]
- Davatzikos C, Ruparel K, Fan Y, Shen DG, Acharyya M, Loughead JW, Gur RC, Langleben DD. Classifying spatial patterns of brain activity with machine learning methods: application to lie detection. Neuroimage. 2005;28:663–668. doi: 10.1016/j.neuroimage.2005.08.009. [DOI] [PubMed] [Google Scholar]
- Dickson DW. Dementia with Lewy bodies: neuropathology. J Geriatr Psychiatry Neurol. 2002;15:210–216. doi: 10.1177/089198870201500406. [DOI] [PubMed] [Google Scholar]
- Fan Y, Shen D, Davatzikos C. Classification of structural images via high-dimensional image warping, robust feature extraction, and SVM. Med Image Comput Comput Assist Interv Int Conf Med Image Comput Comput Assist Interv. 2005;8:1–8. doi: 10.1007/11566465_1. [DOI] [PubMed] [Google Scholar]
- Forman MS, Farmer J, Johnson JK, Clark CM, Arnold SE, Coslett HB, Chatterjee A, Hurtig HI, Karlawish JH, Rosen HJ, Van Deerlin V, Lee VM, Miller BL, Trojanowski JQ, Grossman M. Frontotemporal dementia: clinicopathological correlations. Ann Neurol. 2006;59:952–962. doi: 10.1002/ana.20873. [DOI] [PMC free article] [PubMed] [Google Scholar]
- Foster NL, Heidebrink JL, Clark CM, Jagust WJ, Arnold SE, Barbas NR, DeCarli CS, Turner RS, Koeppe RA, Higdon R, Minoshima S. FDG-PET improves accuracy in distinguishing frontotemporal dementia and Alzheimer’s disease. Brain. 2007;130:2616–2635. doi: 10.1093/brain/awm177. [DOI] [PubMed] [Google Scholar]
- Freeborough PA, Fox NC. MR image texture analysis applied to the diagnosis and tracking of Alzheimer’s disease. IEEE Trans Med Imaging. 1998;17:475–479. doi: 10.1109/42.712137. [DOI] [PubMed] [Google Scholar]
- Gomez-Isla T, Growdon WB, McNamara M, Newell K, Gomez-Tortosa E, Hedley-Whyte ET, Hyman BT. Clinicopathologic correlates in temporal cortex in dementia with Lewy bodies. Neurology. 1999;53:2003–2009. doi: 10.1212/wnl.53.9.2003. [DOI] [PubMed] [Google Scholar]
- Gosche KM, Mortimer JA, Smith CD, Markesbery WR, Snowdon DA. Hippocampal volume as an index of Alzheimer neuropathology: findings from the Nun Study. Neurology. 2002;58:1476–1482. doi: 10.1212/wnl.58.10.1476. [DOI] [PubMed] [Google Scholar]
- Guo Y, Hastie T, Tibshirani R. Regularized linear discriminant analysis and its application in microarrays. Biostatistics. 2007;8:86–100. doi: 10.1093/biostatistics/kxj035. [DOI] [PubMed] [Google Scholar]
- Harding AJ, Broe GA, Halliday GM. Visual hallucinations in Lewy body disease relate to Lewy bodies in the temporal lobe. Brain. 2002;125:391–403. doi: 10.1093/brain/awf033. [DOI] [PubMed] [Google Scholar]
- Hashimoto M, Kitagaki H, Imamura T, Hirono N, Shimomura T, Kazui H, Tanimukai S, Hanihara T, Mori E. Medial temporal and whole-brain atrophy in dementia with Lewy bodies: a volumetric MRI study. Neurology. 1998;51:357–362. doi: 10.1212/wnl.51.2.357. [DOI] [PubMed] [Google Scholar]
- Hodges JR, Davies RR, Xuereb JH, Casey B, Broe M, Bak TH, Kril JJ, Halliday GM. Clinicopathological correlates in frontotemporal dementia. Ann Neurol. 2004;56:399–406. doi: 10.1002/ana.20203. [DOI] [PubMed] [Google Scholar]
- Horn JF, Habert MO, Kas A, Malek Z, Maksud P, Lacomblez L, Giron A, Fertil B. Differential automatic diagnosis between Alzheimer’s disease and frontotemporal dementia based on perfusion SPECT images. Artif Intell Med. 2009;47:147–158. doi: 10.1016/j.artmed.2009.05.001. [DOI] [PubMed] [Google Scholar]
- Iseki E, Kato M, Marui W, Ueda K, Kosaka K. A neuropathological study of the disturbance of the nigro-amygdaloid connections in brains from patients with dementia with Lewy bodies. J Neurol Sci. 2001;185:129–134. doi: 10.1016/s0022-510x(01)00481-6. [DOI] [PubMed] [Google Scholar]
- Ishii K, Kanda T, Uemura T, Miyamoto N, Yoshikawa T, Shimada K, Ohkawa S, Minoshima S. Computer-assisted diagnostic system for neurodegenerative dementia using brain SPECT and 3D-SSP. Eur J Nucl Med Mol Imaging. 2009 doi: 10.1007/s00259-008-1051-3. [DOI] [PubMed] [Google Scholar]
- Jack CR, Jr, Dickson DW, Parisi JE, Xu YC, Cha RH, O’Brien PC, Edland SD, Smith GE, Boeve BF, Tangalos EG, Kokmen E, Petersen RC. Antemortem MRI findings correlate with hippocampal neuropathology in typical aging and dementia. Neurology. 2002;58:750–757. doi: 10.1212/wnl.58.5.750. [DOI] [PMC free article] [PubMed] [Google Scholar]
- Johnson RA, Wichern DW. Applied Multivariate Statistical Analysis. 5. Prentice Hall; 2002. [Google Scholar]
- Josephs KA, Holton JL, Rossor MN, Godbolt AK, Ozawa T, Strand K, Khan N, Al-Sarraj S, Revesz T. Frontotemporal lobar degeneration and ubiquitin immunohistochemistry. Neuropathol Appl Neurobiol. 2004;30:369–373. doi: 10.1111/j.1365-2990.2003.00545.x. [DOI] [PubMed] [Google Scholar]
- Josephs KA, Petersen RC, Knopman DS, Boeve BF, Whitwell JL, Duffy JR, Parisi JE, Dickson DW. Clinicopathologic analysis of frontotemporal and corticobasal degenerations and PSP. Neurology. 2006a;66:41–48. doi: 10.1212/01.wnl.0000191307.69661.c3. [DOI] [PubMed] [Google Scholar]
- Josephs KA, Whitwell JL, Boeve BF, Knopman DS, Petersen RC, Hu WT, Parisi JE, Dickson DW, Jack CR., Jr Anatomical differences between CBS-corticobasal degeneration and CBS-Alzheimer’s disease. Movement Disorders. 2010;25:1246–1252. doi: 10.1002/mds.23062. [DOI] [PMC free article] [PubMed] [Google Scholar]
- Josephs KA, Whitwell JL, Duffy JR, Vanvoorst WA, Strand EA, Hu WT, Boeve BF, Graff-Radford NR, Parisi JE, Knopman DS, Dickson DW, Jack CR, Jr, Petersen RC. Progressive aphasia secondary to Alzheimer disease vs FTLD pathology. Neurology. 2008;70:25–34. doi: 10.1212/01.wnl.0000287073.12737.35. [DOI] [PMC free article] [PubMed] [Google Scholar]
- Josephs KA, Whitwell JL, Parisi JE, Knopman DS, Boeve BF, Geda YE, Jack CR, Jr, Petersen RC, Dickson DW. Argyrophilic grains: A distinct disease or an additive pathology? Neurobiol Aging. 2006b doi: 10.1016/j.neurobiolaging.2006.10.032. [DOI] [PMC free article] [PubMed] [Google Scholar]
- Kantarci K, Avula R, Senjem ML, Samikoglu AR, Zhang B, Weigand SD, Przybelski SA, Edmonson HA, Vemuri P, Knopman DS, Ferman TJ, Boeve BF, Petersen RC, Jack CR., Jr Dementia with Lewy bodies and Alzheimer disease: neurodegenerative patterns characterized by DTI. Neurology. 2010;74:1814–1821. doi: 10.1212/WNL.0b013e3181e0f7cf. [DOI] [PMC free article] [PubMed] [Google Scholar]
- Kloppel S, Stonnington CM, Barnes J, Chen F, Chu C, Good CD, Mader I, Anne Mitchell L, Patel AC, Roberts CC, Fox NC, Jack CR, Jr, Ashburner J, Frackowiak RSJ. Accuracy of dementia diagnosis--a direct comparison between radiologists and a computerized method. Brain %R. 2008a doi: 10.1093/brain/awn239. awn239. [DOI] [PMC free article] [PubMed] [Google Scholar]
- Kloppel S, Stonnington CM, Chu C, Draganski B, Scahill RI, Rohrer JD, Fox NC, Jack CR, Jr, Ashburner J, Frackowiak RS. Automatic classification of MR scans in Alzheimer’s disease. Brain. 2008b;131:681–689. doi: 10.1093/brain/awm319. [DOI] [PMC free article] [PubMed] [Google Scholar]
- Klucken J, McLean PJ, Gomez-Tortosa E, Ingelsson M, Hyman BT. Neuritic alterations and neural system dysfunction in Alzheimer’s disease and dementia with Lewy bodies. Neurochem Res. 2003;28:1683–1691. doi: 10.1023/a:1026061021946. [DOI] [PubMed] [Google Scholar]
- Knopman DS, Boeve BF, Petersen RC. Essentials of the proper diagnoses of mild cognitive impairment, dementia, and major subtypes of dementia. Mayo Clin Proc. 2003;78:1290–1308. doi: 10.4065/78.10.1290. [DOI] [PubMed] [Google Scholar]
- Koeppe RA, Gilman S, Joshi A, Liu S, Little R, Junck L, Heumann M, Frey KA, Albin RL. 11C-DTBZ and 18F-FDG PET measures in differentiating dementias. J Nucl Med. 2005;46:936–944. [PubMed] [Google Scholar]
- Kril JJ, Macdonald V, Patel S, Png F, Halliday GM. Distribution of brain atrophy in behavioral variant frontotemporal dementia. J Neurol Sci. 2005;232:83–90. doi: 10.1016/j.jns.2005.02.003. [DOI] [PubMed] [Google Scholar]
- Lao Z, Shen D, Xue Z, Karacali B, Resnick SM, Davatzikos C. Morphological classification of brains via high-dimensional shape transformations and machine learning methods. Neuroimage. 2004;21:46–57. doi: 10.1016/j.neuroimage.2003.09.027. [DOI] [PubMed] [Google Scholar]
- Lippa CF, Johnson R, Smith TW. The medial temporal lobe in dementia with Lewy bodies: a comparative study with Alzheimer’s disease. Ann Neurol. 1998;43:102–106. doi: 10.1002/ana.410430117. [DOI] [PubMed] [Google Scholar]
- Lopez OL, Litvan I, Catt KE, Stowe R, Klunk W, Kaufer DI, Becker JT, DeKosky ST. Accuracy of four clinical diagnostic criteria for the diagnosis of neurodegenerative dementias. Neurology. 1999;53:1292–1299. doi: 10.1212/wnl.53.6.1292. [DOI] [PubMed] [Google Scholar]
- Mackenzie IR, Baborie A, Pickering-Brown S, Du Plessis D, Jaros E, Perry RH, Neary D, Snowden JS, Mann DM. Heterogeneity of ubiquitin pathology in frontotemporal lobar degeneration: classification and relation to clinical phenotype. Acta Neuropathol. 2006;112:539–549. doi: 10.1007/s00401-006-0138-9. [DOI] [PMC free article] [PubMed] [Google Scholar]
- Mackenzie IR, Neumann M, Bigio EH, Cairns NJ, Alafuzoff I, Kril J, Kovacs GG, Ghetti B, Halliday G, Holm IE, Ince PG, Kamphorst W, Revesz T, Rozemuller AJ, Kumar-Singh S, Akiyama H, Baborie A, Spina S, Dickson DW, Trojanowski JQ, Mann DM. Nomenclature and nosology for neuropathologic subtypes of frontotemporal lobar degeneration: an update. Acta Neuropathol. 2010;119:1–4. doi: 10.1007/s00401-009-0612-2. [DOI] [PMC free article] [PubMed] [Google Scholar]
- Marui W, Iseki E, Nakai T, Miura S, Kato M, Ueda K, Kosaka K. Progression and staging of Lewy pathology in brains from patients with dementia with Lewy bodies. J Neurol Sci. 2002;195:153–159. doi: 10.1016/s0022-510x(02)00006-0. [DOI] [PubMed] [Google Scholar]
- McKeith I, Mintzer J, Aarsland D, Burn D, Chiu H, Cohen-Mansfield J, Dickson D, Dubois B, Duda JE, Feldman H, Gauthier S, Halliday G, Lawlor B, Lippa C, Lopez OL, Carlos Machado J, O’Brien J, Playfer J, Reid W. Dementia with Lewy bodies. Lancet Neurol. 2004;3:19–28. doi: 10.1016/s1474-4422(03)00619-7. [DOI] [PubMed] [Google Scholar]
- McKeith IG, Dickson DW, Lowe J, Emre M, O’Brien JT, Feldman H, Cummings J, Duda JE, Lippa C, Perry EK, Aarsland D, Arai H, Ballard CG, Boeve B, Burn DJ, Costa D, Del Ser T, Dubois B, Galasko D, Gauthier S, Goetz CG, Gomez-Tortosa E, Halliday G, Hansen LA, Hardy J, Iwatsubo T, Kalaria RN, Kaufer D, Kenny RA, Korczyn A, Kosaka K, Lee VM, Lees A, Litvan I, Londos E, Lopez OL, Minoshima S, Mizuno Y, Molina JA, Mukaetova-Ladinska EB, Pasquier F, Perry RH, Schulz JB, Trojanowski JQ, Yamada M. Diagnosis and management of dementia with Lewy bodies: third report of the DLB Consortium. Neurology. 2005;65:1863–1872. doi: 10.1212/01.wnl.0000187889.17253.b1. [DOI] [PubMed] [Google Scholar]
- McKhann G, Drachman D, Folstein M, Katzman R, Price D, Stadlan EM. Clinical diagnosis of Alzheimer’s disease: report of the NINCDS-ADRDA Work Group under the auspices of Department of Health and Human Services Task Force on Alzheimer’s Disease. Neurology. 1984;34:939–944. doi: 10.1212/wnl.34.7.939. [DOI] [PubMed] [Google Scholar]
- Mirra SS, Heyman A, McKeel D, Sumi SM, Crain BJ, Brownlee LM, Vogel FS, Hughes JP, van Belle G, Berg L. The Consortium to Establish a Registry for Alzheimer’s Disease (CERAD). Part II. Standardization of the neuropathologic assessment of Alzheimer’s disease. Neurology. 1991;41:479–486. doi: 10.1212/wnl.41.4.479. [DOI] [PubMed] [Google Scholar]
- Neary D, Snowden JS, Gustafson L, Passant U, Stuss D, Black S, Freedman M, Kertesz A, Robert PH, Albert M, Boone K, Miller BL, Cummings J, Benson DF. Frontotemporal lobar degeneration: a consensus on clinical diagnostic criteria. Neurology. 1998;51:1546–1554. doi: 10.1212/wnl.51.6.1546. [DOI] [PubMed] [Google Scholar]
- NIA-Reagan. Consensus recommendations for the postmortem diagnosis of Alzheimer’s disease. The National Institute on Aging, and Reagan Institute Working Group on Diagnostic Criteria for the Neuropathological Assessment of Alzheimer’s Disease. Neurobiol Aging. 1997;18:S1–2. [PubMed] [Google Scholar]
- Ota M, Sato N, Ogawa M, Murata M, Kuno S, Kida J, Asada T. Degeneration of dementia with Lewy bodies measured by diffusion tensor imaging. NMR Biomed. 2009;22:280–284. doi: 10.1002/nbm.1321. [DOI] [PubMed] [Google Scholar]
- Rabinovici GD, Seeley WW, Kim EJ, Gorno-Tempini ML, Rascovsky K, Pagliaro TA, Allison SC, Halabi C, Kramer JH, Johnson JK, Weiner MW, Forman MS, Trojanowski JQ, Dearmond SJ, Miller BL, Rosen HJ. Distinct MRI atrophy patterns in autopsy-proven Alzheimer’s disease and frontotemporal lobar degeneration. Am J Alzheimers Dis Other Demen. 2007;22:474–488. doi: 10.1177/1533317507308779. [DOI] [PMC free article] [PubMed] [Google Scholar]
- Rosen HJ, Gorno-Tempini ML, Goldman WP, Perry RJ, Schuff N, Weiner M, Feiwell R, Kramer JH, Miller BL. Patterns of brain atrophy in frontotemporal dementia and semantic dementia. Neurology. 2002;58:198–208. doi: 10.1212/wnl.58.2.198. [DOI] [PubMed] [Google Scholar]
- Schmeichel AM, Buchhalter LC, Low PA, Parisi JE, Boeve BW, Sandroni P, Benarroch EE. Mesopontine cholinergic neuron involvement in Lewy body dementia and multiple system atrophy. Neurology. 2008;70:368–373. doi: 10.1212/01.wnl.0000298691.71637.96. [DOI] [PubMed] [Google Scholar]
- Seeley WW, Crawford R, Rascovsky K, Kramer JH, Weiner M, Miller BL, Gorno-Tempini ML. Frontal paralimbic network atrophy in very mild behavioral variant frontotemporal dementia. Arch Neurol. 2008;65:249–255. doi: 10.1001/archneurol.2007.38. [DOI] [PMC free article] [PubMed] [Google Scholar]
- Silbert LC, Quinn JF, Moore MM, Corbridge E, Ball MJ, Murdoch G, Sexton G, Kaye JA. Changes in premorbid brain volume predict Alzheimer’s disease pathology. Neurology. 2003;61:487–492. doi: 10.1212/01.wnl.0000079053.77227.14. [DOI] [PubMed] [Google Scholar]
- Silverman DH, Gambhir SS, Huang HW, Schwimmer J, Kim S, Small GW, Chodosh J, Czernin J, Phelps ME. Evaluating early dementia with and without assessment of regional cerebral metabolism by PET: a comparison of predicted costs and benefits. J Nucl Med. 2002;43:253–266. [PubMed] [Google Scholar]
- Steinbach M, Karypis G, Kumar V. A Comparison of Document Clustering Techniques ACM International Conference on Knowledge Discovery and Data Mining.2000. [Google Scholar]
- Tzourio-Mazoyer N, Landeau B, Papathanassiou D, Crivello F, Etard O, Delcroix N, Mazoyer B, Joliot M. Automated anatomical labeling of activations in SPM using a macroscopic anatomical parcellation of the MNI MRI single-subject brain. Neuroimage. 2002;15:273–289. doi: 10.1006/nimg.2001.0978. [DOI] [PubMed] [Google Scholar]
- Varma AR, Snowden JS, Lloyd JJ, Talbot PR, Mann DM, Neary D. Evaluation of the NINCDS-ADRDA criteria in the differentiation of Alzheimer’s disease and frontotemporal dementia. J Neurol Neurosurg Psychiatry. 1999;66:184–188. doi: 10.1136/jnnp.66.2.184. [DOI] [PMC free article] [PubMed] [Google Scholar]
- Vemuri P, Gunter JL, Senjem ML, Whitwell JL, Kantarci K, Knopman DS, Boeve BF, Petersen RC, Jack CR., Jr Alzheimer’s disease diagnosis in individual subjects using structural MR images: Validation studies. Neuroimage. 2008a;39:1186–1197. doi: 10.1016/j.neuroimage.2007.09.073. [DOI] [PMC free article] [PubMed] [Google Scholar]
- Vemuri P, Whitwell JL, Kantarci K, Josephs KA, Parisi JE, Shiung MS, Knopman DS, Boeve BF, Petersen RC, Dickson DW, Jack CR., Jr Antemortem MRI based STructural Abnormality iNDex (STAND)-scores correlate with postmortem Braak neurofibrillary tangle stage. Neuroimage. 2008b;42:559–567. doi: 10.1016/j.neuroimage.2008.05.012. [DOI] [PMC free article] [PubMed] [Google Scholar]
- Whitwell JL, Jack CR, Jr, Przybelski SA, Parisi JE, Senjem ML, Boeve BF, Knopman DS, Petersen RC, Dickson DW, Josephs KA. Temporoparietal atrophy: A marker of AD pathology independent of clinical diagnosis. Neurobiol Aging. 2009a doi: 10.1016/j.neurobiolaging.2009.10.012. Epub ahead of print. [DOI] [PMC free article] [PubMed] [Google Scholar]
- Whitwell JL, Jack CR, Jr, Senjem ML, Parisi JE, Boeve BF, Knopman DS, Dickson DW, Petersen RC, Josephs KA. MRI correlates of protein deposition and disease severity in postmortem frontotemporal lobar degeneration. Neurodegener Dis. 2009b;6:106–117. doi: 10.1159/000209507. [DOI] [PMC free article] [PubMed] [Google Scholar]
- Whitwell JL, Josephs KA, Murray ME, Kantarci K, Przybelski SA, Weigand SD, Vemuri P, Senjem ML, Parisi JE, Knopman DS, Boeve BF, Petersen RC, Dickson DW, Jack CR., Jr MRI correlates of neurofibrillary tangle pathology at autopsy: a voxel-based morphometry study. Neurology. 2008;71:743–749. doi: 10.1212/01.wnl.0000324924.91351.7d. [DOI] [PMC free article] [PubMed] [Google Scholar]
- Whitwell JL, Weigand SD, Shiung MM, Boeve BF, Ferman TJ, Smith GE, Knopman DS, Petersen RC, Benarroch EE, Josephs KA, Jack CR., Jr Focal atrophy in dementia with Lewy bodies on MRI: a distinct pattern from Alzheimer’s disease. Brain. 2007;130:708–719. doi: 10.1093/brain/awl388. [DOI] [PMC free article] [PubMed] [Google Scholar]
- Yamamoto R, Iseki E, Murayama N, Minegishi M, Marui W, Togo T, Katsuse O, Kato M, Iwatsubo T, Kosaka K, Arai H. Investigation of Lewy pathology in the visual pathway of brains of dementia with Lewy bodies. J Neurol Sci. 2006;246:95–101. doi: 10.1016/j.jns.2006.02.016. [DOI] [PubMed] [Google Scholar]
- Zarow C, Vinters HV, Ellis WG, Weiner MW, Mungas D, White L, Chui HC. Correlates of hippocampal neuron number in Alzheimer’s disease and ischemic vascular dementia. Ann Neurol. 2005;57:896–903. doi: 10.1002/ana.20503. [DOI] [PMC free article] [PubMed] [Google Scholar]