

Abstract
Rapid assembly and disassembly (turnover) of actin filaments in cytoplasm drives cell motility and shape remodeling. While many biochemical processes that facilitate filament turnover are understood in isolation, it remains unclear how they work together to promote filament turnover in cells. Here, we studied cellular mechanisms of actin filament turnover by combining quantitative microscopy with mathematical modeling. Using live cell imaging, we found that actin polymer mass decay in Listeria comet tails is very well fit by a simple exponential. By analyzing candidate filament turnover pathways using stochastic modeling, we found that exponential polymer mass decay is consistent with either slow treadmilling, slow Arp2/3-dissociation, or catastrophic bursts of disassembly, but is inconsistent with acceleration of filament turnover by severing. Imaging of single filaments in Xenopus egg extract provided evidence that disassembly by bursting dominates isolated filament turnover in a cytoplasmic context. Taken together, our results point to a pathway where filaments grow transiently from barbed ends, rapidly terminate growth to enter a long-lived stable state, and then undergo a catastrophic burst of disassembly. By keeping filament lengths largely constant over time, such catastrophic filament turnover may enable cellular actin assemblies to maintain their mechanical integrity as they are turning over.
Introduction
Actin filaments polymerize and depolymerize rapidly in cells, exchanging subunits with a pool of monomeric subunits on a timescale of tens of seconds (1). This rapid filament turnover enables cells to sustain continuous motility and change their shape in response to environmental signals. Filament turnover is powered by hydrolysis of filament subunit-bound ATP (2), and involves the action of multiple actin-binding protein factors. While the biochemistry of many such factors are understood in isolation, it remains unclear how they work together to promote rapid filament turnover in cells.
Actin filament nucleation in cells requires factors that stabilize minimal oligomers to seed filament elongation. The best understood nucleators are the Arp2/3 complex, which binds to pointed ends and generates branched filament assemblies, and formins, which generate polarized bundles. Once nucleated, filaments elongate from barbed ends. Termination of elongation is believed to involve stable binding of capping protein to barbed ends (3), although we recently proposed that it may instead involve switching of barbed ends into an elongation-incompetent state (4). Depolymerization also requires the action of factors, the most important of which is actin depolymerizing factor/cofilin, a protein that preferentially binds ADP-actin and may help couple ATP hydrolysis to filament turnover. Some in vitro studies have found that cofilin accelerates subunit dissociation from filament pointed ends (5), facilitating treadmilling. Others, however, have argued that cofilin severs actin filaments (6), and accelerates turnover by increasing the number of shrinking filament ends. In a recent study where cofilin was mixed with two co-factors, Aip1 and Coronin, we found a distinct mechanism where actin filaments depolymerize in bursts where hundreds of subunits are abruptly lost (4). These bursts of disassembly initiate preferentially but not exclusively from filament ends, with both barbed and pointed ends participating. A single burst of this type could completely depolymerize a short filament, so this mechanism could promote catastrophic, one-by-one disassembly of entire filaments, somewhat analogous to microtubule turnover by dynamic instability.
To understand the morphogenesis and dynamic organization of actin assemblies in the cell, we need to understand how single filaments turn over in cells. Most studies addressing this question have employed indirect techniques such as fluorescence recovery after photobleaching (7), photoactivation (8), or speckle-level imaging (9,10). While these techniques yield information on temporal and spatial scales of turnover, they do not reveal mechanism on the level of single filaments. Two recent studies have attempted to directly image the turnover of single actin filaments in sparse assemblies at the cell cortex (11,12). Both studies found that, while filaments grow smoothly from ends, consistent with barbed end elongation, they do not depolymerize in a smooth endwise manner, but instead incur disassembly events along the filament length. However, it was hard to determine the exact mechanism of depolymerization from these studies.
In this study, we seek to elucidate the pathways underlying rapid turnover of actin filaments inside cells. We attempt to do so by combining three approaches:
-
1.
Quantitative imaging to make accurate measurements of actin turnover in cells;
-
2.
Mathematical modeling to identify turnover pathways consistent with experimental measurements; and
-
3.
Single-filament imaging of depolymerization in a cytoplasmic context to distinguish between pathways favored by modeling.
Quantitative imaging was performed on actin comet tails formed by the intracellular pathogen Listeria monocytogenes (13,14). These comet tails allow accurate measurements of polymer mass dynamics, as filaments nucleate and elongate only at the surface of the moving bacterium, and remain stationary in cytoplasm once nucleated (14). Previous work found the decay of Listeria actin comet tails to be approximately exponential (14,15); however, the mechanistic implications of this observation have not been explored. The mathematical models attempt to describe candidate turnover pathways with a minimal number of free parameters. This approach allowed us to gain insights into general pathway behavior irrespective of exact parameter values, and to more effectively identify plausible turnover regimes using experimental measurements (see Note S1 in the Supporting Material). Single-filament experiments involved polymerization of single filaments from pure monomer, followed by perfusion with Xenopus egg extracts—a cytoplasmic system that recapitulates normal Listeria actin comet tail turnover (15,16). Filaments imaged here are not Arp2/3-nucleated, and may further differ from comet tail filaments in their length and binding partners; nonetheless, they serve as a useful probe for characterizing turnover pathways promoted by cytoplasmic factors.
Taken together, our data and models are most consistent with a pathway where actin filaments elongate transiently from barbed ends, rapidly terminate barbed-end growth to enter a long-lived stable state, then depolymerize through an end-initiated burst that catastrophically leads to whole-filament destabilization. On a single-filament level, this pathway has the effect of making the timing at which a subunit depolymerizes largely independent of its position along the filament length. On a bulk level, it gives rise to an exponential decay of polymer mass in an actin assembly, and keeps the filament length distribution in the assembly largely constant over time.
Methods
Imaging of Listeria-infected tissue culture cells
Infection of tissue culture cells with Listeria and subsequent imaging was performed as previously described (4). Briefly, BSC-1 cells were transduced with a GFP-actin-expressing adenovirus overnight. They were then infected with Listeria for 3 h and treated with 50 μg/mL gentamicin for 24 h before imaging. Imaging was performed on a wide-field fluorescence microscope (TE300; Nikon, Melville, NY) using a 100 × 1.4 NA oil objective, and fluorescence images were acquired with a cooled charge-coupled device camera (ORCA-ER; Hamamatsu, Hamamatsu City, Japan) using image acquisition software (MetaMorph; Molecular Devices, Carlsbad, CA). Infected cells containing visible GFP-actin comet tails were located for timelapse image acquisition. Timelapse image sequences of GFP-actin in these cells were then acquired at 2 s intervals for a minimum duration of 200 s. These timelapse acquisition parameters were chosen to give sufficient sampling of comet tails over their entire decay profiles without exposing them to excessive light.
Quantification of polymer mass decay in Listeria comet tails
Polymer mass decay curves for individual Listeria comet tails were extracted from timelapse images using custom-written image processing routines in MATLAB (The MathWorks, Natick, MA) and Igor Pro (WaveMetrics, Lake Oswego, OR). Details are provided in the Supporting Material.
Stochastic simulations of single-filament turnover
Stochastic simulations of single filament turnover were performed in MATLAB (The MathWorks) using the Gillespie algorithm (17), with filaments modeled using a one-dimensional state lattice, and chemical reactions modeled as discrete transformations on this state lattice. Polymer mass decay curves were obtained by ensemble averaging of single-filament trajectories. Details are provided in the Supporting Material.
Preparation of proteins and extracts
Xenopus laevis mitotic egg extracts were prepared as described in Rosenblatt et al. (16); actin was purified from rabbit skeletal muscle, as described in Pardee and Spudich (18), and labeled on lysines as described in Brieher et al. (19), using either carboxytetramethylrhodamine (C1171; Invitrogen, Carlsbad, CA), or Alexa Fluor 647 (A20006; Invitrogen). Filamin was purified from chicken gizzard smooth muscle as described in Wang (20).
Imaging single-filament disassembly in Xenopus egg extract
Time-lapse imaging of single actin filaments was performed by using the assay described in detail in Kueh et al. (4). Briefly, perfusion chambers were incubated with 10 μg/mL filamin for 10 min and then with blocking solution (5 mg/mL casein/0.2% Tween 20/0.1% Pluronic F-127) for 5 min. Alexa-647 actin was then polymerized in perfusion chambers in assay buffer (50 mM KCl/2 mM MgCl2/2 mM ATP/100 mM K+-HEPES, pH 7.8). Unpolymerized monomer was then washed out by using assay buffer supplemented with oxygen scavengers (4.5 mg/mL glucose/0.2 mg/mL glucose oxidase/35 μg/mL catalase) and 10% blocking solution. Attached filaments were then perfused with Xenopus egg extract and imaged under continuous illumination using streaming image acquisition.
Results
Actin polymer mass decays exponentially in Listeria comet tails
We took timelapse images of moving Listeria inside BSC-1 cells expressing GFP-actin, and measured the decay of actin polymer mass in Listeria comet tails as follows:
Step 1. We first manually traced the trajectory of a moving Listeria on a maximum intensity projection image of the timelapse sequence (Fig. 1 A).
Step 2. For every position along the bacterial trajectory, we located the time-point at which GFP-actin fluorescence was maximal and set it to be the time axis origin for the polymer mass decay curve.
Step 3. We then subtracted from each decay curve the background intensity, and divided it by its initial grayscale value.
Step 4. We then took these normalized decay curves and averaged them to form a single decay curve (Fig. 1 B). This averaging was warranted by our observations that the rate of polymer mass decay did not vary noticeably with the position of the comet tail in cytoplasm, nor did it change over the course of the experiment (not shown).
Figure 1.
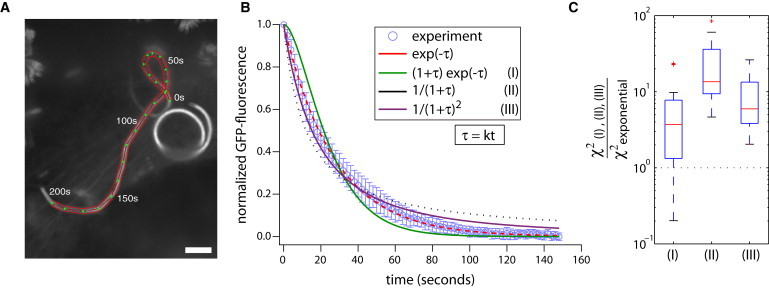
Polymer mass decay in Listeria actin comet tails is best fit by a simple exponential. (A) Maximum intensity projection of GFP-actin in a Listeria comet tail in a BSC-1 cell, taken over a timelapse movie. Red contour shows a trace of the Listeria trajectory. Scale bar = 5 μm. (B) GFP-actin decay curve (blue circles) for the Listeria trajectory in panel A. Error bars give the standard deviation in the decay curve across the trajectory. Smooth curves give best fits of the polymer mass decay to a simple exponential exp(–τ) (red, χ2exp = 0.0087); inflected exponential (1 + τ) · exp(– τ), (green, χ2inf = 0.24); hyperbola 1/(1 + τ), (black, χ2hyp = 0.40); and squared hyperbola 1/(1 + τ)2, (purple, χ2sqh = 0.11). All fits contain a single fitting parameter k, where τ = kt. (C) Ratio of sum-squared errors comparing best fits of other candidate curves to that of a simple exponential: (I) F = χ2inf/χ2exp, 〈F〉 = 5.9; (II) F = χ2hyp/χ2exp, 〈F〉 = 22.7); and (III) F = χ2sqh//χ2exp, 〈F〉 = 8.2. Fits from 23 Listeria comet tails were used. The simple exponential is the best fit to experimental data.
The resultant curve represents the decay of actin polymer mass about its maximum for a single moving Listeria.
The actin polymer mass decay in Listeria comet tails is very well fit by a simple exponential of the form exp(–τ) (Fig. 1 B). The exponential polymer mass decay curve shown here is representative of decay curves in an ensemble of Listeria comet tails taken from multiple independent measurements (N = 23 tails, 〈R2〉 = 0.99, τ = 25.4 ± 4.4 s). Approximately exponential decay was inferred previously using intensifying camera technology (14,15). Our measurements extend that conclusion by increasing dynamic range with a cooled charge-coupled device camera and decreasing noise by averaging.
Models of actin filament turnover
To identify pathways of actin filament turnover consistent with polymer mass decay in Listeria comet tails (Fig. 1), we analyzed a series of dynamical models describing different candidate filament turnover pathways (see Table S1 in the Supporting Material for a listing of models analyzed, along with a summary of parameters and main results for each model). These models explicitly consider turnover reactions at barbed and pointed ends, as well as along the filament length. From these models, we derived polymer mass decay curves and compared them to those measured in Listeria comet tails to identify turnover pathways consistent with experimental data.
Model A: Treadmilling
Treadmilling was first proposed by Wegner (21) to explain why pure actin filaments in solution turned over at a much faster rate than expected from random fluctuations at ends in thermodynamic equilibrium. It has since been hypothesized to be a major pathway of filament turnover inside cells (22). Here, we solve a single-filament model of treadmilling filament turnover. In this model, filaments grow from barbed ends with rate v+ until they terminate growth, which occurs at first-order rate kc (see Note S2 in the Supporting Material). Termination of growth could reflect barbed-end capping by capping protein, or conversion of barbed ends to an elongation-incompetent state (4,23). Meanwhile, filaments shrink from pointed ends at a rate v–(< v+). Pointed-end shrinkage continues until the filament is completely depolymerized. We describe these processes using two functions B(t) and P(t), which, respectively, give the position of a filament's barbed end and pointed end along a linear contour (Fig. 2, A and B):
| (1) |
| (2) |
where τc, the time to elongation termination, follows an exponential distribution,
| (3) |
and filament nucleation and elimination occur at time zero and τe = v+τc/v–, respectively. From Eqs. 1 and 2, we can determine the time evolution of a single filament's length
which we can then integrate over Eq. 3 to obtain the time evolution of the polymer mass:
| (4) |
Here α = v+/v–(> 1), τ = kct, and C is a constant. To obtain the corresponding polymer mass decay curve , we translate M(τ) horizontally such that its maximum coincides with the origin of the time axis (Fig. 2 C, top and bottom):
| (5) |
This expression captures the polymer mass decay for an ensemble of synchronously nucleated filaments, as is the case for filaments measured at fixed points along the Listeria comet tail (see Note S3 in the Supporting Material). Plots of show that its shape depends critically on α (Fig. 2 D, see Table S1 A for a summary) which defines two regimes:
Figure 2.
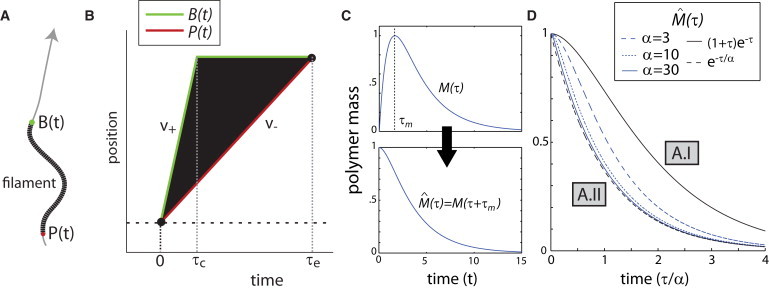
Slow pointed-end shrinkage generates exponential polymer mass decay. (A) Model diagram showing the actin filament (black), its barbed end B(t) (green), pointed end P(t) (red), and the coordinate system (gray line) with the arrow pointing toward the positive direction. (B) Treadmilling-based model of filament turnover. B(t) (green) and P(t) (red), respectively, give the positions of the barbed end and the pointed end as a function of time. The parameters v+ and v–, respectively, give the velocities of barbed-end growth and pointed-end shrinkage. The expressions τc and τe, respectively, give the time to stoppage of barbed-end growth and time to filament elimination. (C) The polymer mass time evolution curve (4) and polymer mass decay curve (5), shown here for α = 3. (D) Polymer mass decay curves (5), plotted for different values of α = v+/v–. Model regimes (A.I and A.II) are labeled in gray boxes.
Regime I: Growth and shrinkage rates are balanced (α ≳ 1). Here has a shoulder in its decay profile, and is well described by the following curve (Fig. 2 D, black solid):
| (6) |
This decay curve resembles an exponential, but has a shoulder and inflection point in its decay profile (Fig. 2 D). This shoulder reflects the coexistence of growing and shrinking filaments during the initial decay due to the balance in growth and shrinkage rates. We will hereafter refer to this curve as an inflected exponential.
Regime II: The growth rate is much larger than the shrinkage rate, α ≫ 1. Here, is well described by a simple exponential (Fig. 2 D, black dashed):
| (7) |
The disappearance of the shoulder in Eq. 7 reflects the fact that most filaments have already switched to a shrinking state during the initial decay due to the large disparity in growth and shrinkage rates.
To determine which regime of α better accounts for polymer mass decay in Listeria comet tails, we compared the best fits of experimental measurements to these two limiting curves (Fig. 1, B and C). This direct comparison showed that a simple exponential (Eq. 7) was a significantly better fit to Listeria comet tail data compared to an inflected exponential (Eq. 6) (F = χ2exp/χ2inf, 〈F〉 = 5.9 for 28 decay curves, degrees of freedom = 75, p < 10−16). This result constrains the treadmilling model to the regime where filaments elongate transiently from barbed ends, rapidly terminate growth, then shorten slowly through pointed-end shrinkage (Regime II, α ≫ 1, or v+ ≫ v−) . Consistent with this regime, filaments nucleated by moving Listeria have been found to elongate only at the bacterial surface, and exist predominantly in a nongrowing state in the comet tail (24,25) (see Fig. S1 in the Supporting Material). While this model regime can potentially account for experimental data, it neglects potential protective effects of the Arp2/3 complex on pointed-end shrinkage. In the next section, we explicitly consider the effect of Arp2/3 on filament turnover.
Model B: Arp2/3 dissociation followed by treadmilling
Arp2/3 dissociation from the pointed end, which causes filament debranching, is believed to be a critical step for actin filament turnover (26,27). Here, we extend the above treadmilling model to account for Arp2/3 dissociation from pointed ends. In this model, filaments grow from barbed ends with rate v+ until they terminate growth with rate kc, as above. Filament pointed ends are initially protected from shrinkage by the Arp2/3 complex; however, dissociation of Arp2/3, which occurs at rate kd, causes them to shrink at rate v–.
To determine whether this Arp2/3 pointed-end dissociation model is consistent with polymer mass measurements in Listeria, we solved for the polymer mass time evolution using the same approach described above (see Appendix A.1 and Note S4, both in the Supporting Material). The resultant polymer mass time evolution curve consists of three distinct exponentials,
| (8) |
composed of the following dimensionless variables and parameters:
| (9) |
| (10) |
| (11) |
Analysis of Eq. 8 revealed that the shape of the corresponding polymer mass decay curve
depends on the relative magnitudes of two timescales: the time required for Arp2/3 pointed-end dissociation (Td ∼1/kd), and the time required for complete filament shrinkage after Arp2/3 dissociation (T– ∼ v+/v–kc). These timescales defined three distinct parameter regimes (Fig. S2, see also Table S1 B), as follows.
Regime I. Fast Arp2/3 dissociation compared to subsequent depolymerization (Td ≪ T−; or κ ≫ 1/ α). In this regime, the model reduces to the treadmilling-only model (Model A), because Arp2/3 dissociation occurs so rapidly that it has little effect on turnover kinetics (analysis not shown).
Regime II. Similar timescales of Arp2/3 dissociation and subsequent depolymerization (Td ∼ T−; or κ ∼1/α). In this regime, Eq. 8 reduces to
| (12) |
This curve is an inflected exponential, identical in shape to that in Eq. 6. The initial shoulder in this curve reflects the fact that depolymerization involves two sequential biochemical processes (Arp2/3 dissociation and subsequent shrinkage) with similar timescales.
Regime III. Slow Arp2/3 dissociation compared to subsequent depolymerization (Td >> T−; or κ << 1/ α). In this regime, the polymer mass decay curve also reduces to a simple exponential:
| (13) |
Here the rate of the exponential decay is simply that of Arp2/3 dissociation. Best fits of Listeria polymer mass decays to these different analytical curves (Eqs. 7, 12, and 13) constrain filament turnover to either Regime I, with both the regime Arp2/3 dissociation and barbed-end growth being fast compared to shrinkage (Td ≪ T−; α ≫ 1), or Regime III, where Arp2/3 dissociation is slow compared to shrinkage (Td ≫ T−). When both events occur with similar timescales (Regime II), polymer mass decays as an inflected exponential (12), inconsistent with experimental data (Fig. 1 C). We further note that, in Regime III, filaments exist in a stable nongrowing and nonshrinking state for most of their lifetimes; they undergo Arp2/3 dissociation and subsequent shrinkage only shortly before their complete elimination (Fig. S2). Such dynamics can more generally describe turnover pathways where filaments elongate transiently, remain in a stable long-lived state, then undergo a catastrophic transition that leads to filament elimination. In subsequent analysis of bursting-mediated filament turnover, we identify a parameter regime that gives rise to similar catastrophic turnover behavior (Model E, Regime I).
Model C: Severing
A number of actin-binding proteins, including actin depolymerizing factor/cofilin and gelsolin, have been shown to sever actin filaments in vitro (6,28,29), leading to the hypothesis that severing accelerates filament turnover in cells. Here, we test whether filament severing can plausibly account for polymer mass decay in Listeria comet tails. We extend the slow treadmilling model (Model A.II) to include a severing reaction, where filaments break anywhere along their lengths with first-order rate ks/subunit (see Note S5 in the Supporting Material). Filament breakage is assumed to generate a new barbed end that does not grow or shrink, and a pointed end that shrinks at a constant rate v– (Note S6 in the Supporting Material). Because a single-filament model describing this reaction scheme was difficult to solve analytically, we performed simulations of single filaments using the Gillespie algorithm (17). These simulations assume negligible diffusion of severed filament fragments from the polymer assembly due to dense filament cross-linking in the Listeria tail (24); however, the same conclusions hold when we explicitly account for diffusion of a severed fragments in stochastic simulations (Appendix A.3 in the Supporting Material).
Stochastic simulations revealed that the shape of the polymer mass decay curve depends critically on the number of severing events that occur during a filament turnover cycle, which in turn depends on the relative magnitudes of two timescales: the time required for a filament to depolymerize completely through pointed-end shrinkage in the absence of severing T– ∼ 〈L〉/v– = v+/v–kc; and the time it takes for the filament to incur a first cut in the absence of shrinkage Ts ∼1/〈L〉ks = kc/v+ks (see Table S1 C). Two distinct regimes arise:
Regime I: T– ≪ Ts, or σ = T−/Ts ≪ 1. In this regime, filaments depolymerize completely before they can incur a cut (Fig. 3 A). Consequently, the model reduces to the treadmilling-only model (Model A, Regime II), and polymer mass decay is well fit by a simple exponential (Fig. 3, A and D).
Figure 3.
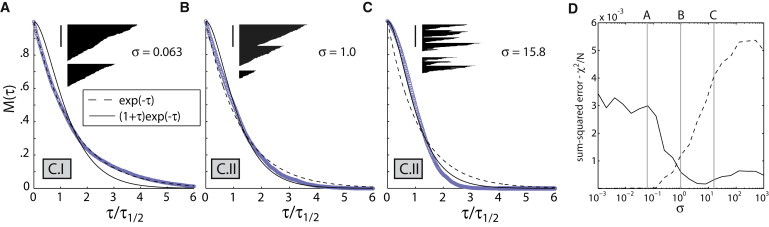
Severing generates nonexponential polymer mass decay curves. (A–C) Kymographs of single filaments and corresponding polymer mass decay curves for severing-based turnover (Model C), shown for parameters corresponding to regime C.I (A) and regime C.II (B and C). The values of σ = ksv2+/k2cv− for each plot are shown. Two example filament kymographs are shown for each set of parameters, with time on the x axis and subunits on the y axis. Vertical bar = 100 subunits; barbed ends point upwards. For each plot, polymer mass decay curves (circles) represent ensemble average of simulated single-filament trajectories. For each plot, kymographs and decay curves share the same time axis, which is scaled such that one unit represents the time required for the polymer mass to decay to half its initial value (τ1/2). Thin smooth lines represent best fits of simulated polymer mass decay curves to a single exponential (dashed) and an inflected exponential (solid). (D) Curve showing sum-squared errors (χ2/N) for best fits to a simple exponential (dashed) and an inflected exponential (solid) for different values of σ. Values of σ used for simulations in panels A–C are shown with vertical bars. In all simulations, ks was varied while all other parameters were kept constant at v– = 10, 〈L〉 = v+/kc = 100.
Regime II: T– ≥ Ts, or σ ≥ 1. Here, filaments incur single or multiple cuts during their turnover cycles (Fig. 3, B and C). The polymer mass decay curve deviates from exponentiality; it exhibits a shorter tail when T– ∼ Ts (Fig. 3 B), and a shoulder and inflection point when T– ≫ Ts (Fig. 3 C). In the severing-dominated limit T– ≫ Ts, we can show that the polymer mass decay curve is well approximated by an inflected exponential (see Appendix A.2 in the Supporting Material),
| (14) |
where τ = (ksɛt), and ɛ is a critical size below which actin oligomers are not counted in polymer mass, either because they are unstable or because they diffuse away rapidly from the assembly. In the severing-dominated limit, a nonzero value of ɛ is now required for polymer mass loss, which now becomes critically dependent on the generation of such small unstable oligomers. Compared to a simple exponential, this inflected exponential is a better fit to polymer mass decay curves from stochastic simulations in Regime II (Fig. 3 D), demonstrating consistency between analytical and numerical techniques. However, as discussed previously, the simple exponential is a superior fit to Listeria polymer mass decays compared to an inflected exponential (Fig. 1, B and C). Our results here show that, for a treadmilling-based turnover pathway, severing events must occur infrequently during turnover (Regime I). If severing occurs frequently (Regime II), the polymer mass decay curve exhibits a shoulder and inflection point (Fig. 3, B and C, Eq. 14), inconsistent with Listeria comet tail measurements.
How does severing generate inflected polymer mass decay curves? As severing proceeds, it increases the number of shrinking filament ends over time. Because the bulk depolymerization rate is directly proportional to the number of ends, this increase will in turn accelerate polymer mass decay over time, and generate a shoulder and inflection in the polymer mass decay curve. This acceleration of polymer mass decay is analogous to the well-characterized phenomenon where severing accelerates polymer mass accumulation by increasing the number of growing ends over time (30–32).
Model D: Severing with slow Arp2/3 dissociation
We also considered the effects of severing on a turnover pathway where slow Arp2/3 dissociation precedes fast pointed-end dissociation (Model B, Regime III). A detailed analysis of this model is presented in Appendix A.5 in the Supporting Material (see also Fig. S5 and Table S1 D). To summarize, we found that exponential polymer mass decay occurs only in the regime where filaments rarely sever their turnover cycles.
Alternate regimes that involve more frequent severing either give rise to hyperbolic polymer mass decay curves, or inflected polymer mass decay curves, both of which of are inferior fits to experimental data (Fig. 1 C; see also Note S7 in the Supporting Material). We note that incorporating severing into the turnover pathway where Arp2/3 dissociation and shrinkage occur with similar kinetics (Model B, Regime II) also results in inflected polymer mass decay curves from the same reasons as discussed above (data not shown). These results, together with those from Model C, further argue that severing plays a limited role in facilitating filament turnover in Listeria comet tails. All severing-based turnover pathways we have considered yield polymer mass decay curves inconsistent with those measured experimentally.
Model E: Bursting
In recent studies with cofilin, coronin and Aip1, we observed a depolymerization mechanism where filaments do not shrink smoothly from ends, but instead undergo bursts of disassembly involving concurrent loss of filament segments hundreds of subunits long (4). Here, we consider a turnover pathway where filaments terminate growth rapidly, then undergo such bursts of disassembly. In our model, bursts initiate from any subunit along the filament length, and result in the loss of Z contiguous subunits centered around the initiating subunit. Any given subunit along the filament length initiates bursting at a first-order rate of kb, whereas terminal subunits at barbed or pointed ends both initiate bursting at an elevated rate of βkb, where β ≥ 1. Because the rate at which a burst initiates along any internal subunit ∼〈L〉kb, bursts initiate preferentially from filament ends if β > 〈L〉; conversely, bursts initiate preferentially along the internal subunits if β < 〈L〉.
Stochastic simulations revealed that the shape of the polymer mass decay curve depends strongly on the magnitudes of the end-bias β and the burst size Z relative to 〈L〉 (see Note S8 in the Supporting Material; see also Table S1 E). Exponential polymer mass decay arises in the following regimes:
Regime I: β and Z are either both large compared to 〈L〉 (Fig. 4, A and E). Here, the majority of filaments catastrophically disassemble in a single endwise burst, though longer filaments, which arise infrequently, require multiple bursts for complete disassembly (Fig. 4 A, kymographs). Such catastrophic turnover kinetics are similar to that observed for slow Arp2/3 dissociation, followed by fast pointed-end shrinkage (Model B, Regime III). Both regimes involve catastrophic transitions at filament ends that result in rapid whole-filament destabilization.
Figure 4.
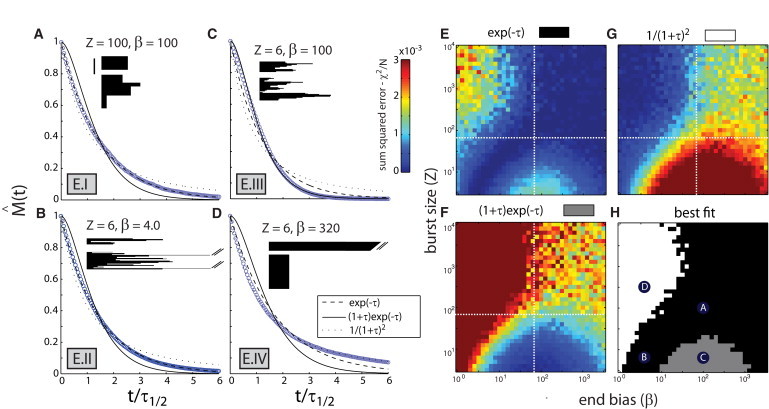
Bursting disassembly can generate exponential polymer mass decay curves. (A–D) Kymographs and polymer mass decay curves for bursting filament turnover (Model E), shown for parameters corresponding to Regimes E.I (A), E.II (B), E.III (C), and E.IV (D). The values of burst size Z and end bias β used for each plot are shown. Two example filament kymographs are shown for each set of parameters, with time on the x axis and subunits on the y axis. Vertical bar = 100 subunits. Polymer mass decay curves (blue) represent ensemble average of simulated single-filament trajectories. For each plot, kymographs and decay curves share the same time-axis, which is scaled such that one unit represents the time required for the polymer mass to decay to half its initial value. Smooth curves (black) represent best fits to simulated polymer mass decay curves. (E–G) Two-dimensional surface plots showing sum-squared errors (χ2/N) for best fits of different analytical curves to simulated curves as a function of β and Z. White-dotted lines give the value of 〈L〉 used in simulations. (H) Two-dimensional plot showing the regions in (β, Z) space where a given curve's best-fit has the smallest χ2/N value [exp(– τ), black; (1 + τ) exp(– τ), gray; 1/(1 + τ)2, white]. Labeled circles denote the parameter values used for simulations in panels A–D. Other values: 〈L〉 = v+/kc = 70.
Regime II: β and Z are both small compared to 〈L〉 (Fig. 4, B and E). Here, filaments undergo many bursts of disassembly, which initiate along the filament length with uniform probability (Fig. 4 B, kymographs). In this regime, filaments can be considered to contain multiple independent filament segments, all of which depolymerize at the same first-order rate due to lack of end bias (see Note S9 in the Supporting Material).
Nonexponential polymer mass decay arises in the other two regimes of the model:
Regime III: Z and β are smaller and larger than 〈L〉, respectively. Here, polymer mass decay follows an inflected exponential (Eq. 14), as filament turnover proceeds through a severing-like mechanism (see Note S10 in the Supporting Material, Fig. 4, C and F).
Regime IV: Z and β are larger and smaller than 〈L〉, respectively. Here, polymer mass decay curve exhibits a long tail, and can be approximated by a squared hyperbola (i.e., ; see Appendix A.6 in the Supporting Material and Fig. 4, D and G). This curve is also an inferior fit to Listeria comet tail data compared to a simple exponential (Fig. 1, B and C).
These results constrain this model to regimes of exponential polymer mass decay (Regimes I and II), where burst size Z and end bias β are either both larger or both smaller than the initial mean filament length 〈L〉. From single-filament disassembly experiments involving cofilin, coronin, and Aip1, we measured an effective burst size of Z ∼300 subunits and estimated an end bias of β ∼103 (see Note S11 in the Supporting Material). Both these parameters are larger than the average filament length estimated from electron microscopy observations of Listeria comet tails (33) (〈L〉 ∼100 subunits), suggesting that filament turnover in Listeria tails is better accounted for by large bursts that initiate preferentially from ends (Regime I). However, it is unclear whether bursting disassembly occurs in a cytoplasmic context, and, if so, whether its kinetic parameters are similar to those observed in the purified protein system. We address this question in the experiments below.
Single filaments disassemble in bursts in Xenopus egg extracts
To test whether bursting disassembly occurs in cytoplasm, we used fluorescence microscopy to directly observe the disassembly of single actin filaments perfused with Xenopus egg cytoplasmic extracts, a system that reconstitutes Listeria motility as observed inside cells (15). As in cells, polymer mass decays exponentially in Listeria comet tails in Xenopus egg extract (Fig. S6), validating the use of this system for studying physiological turnover mechanisms. To mimic the environment in a Listeria tail as closely as possible, and avoid age-associated stabilization (34), filaments were immobilized by binding to surface-attached filamin, and disassembly was induced <2 min after polymerization. Filaments were perfused with undiluted Xenopus egg cytoplasmic extract, and images of subsequent filament disassembly were recorded continuously at 400-ms intervals.
Upon perfusion with Xenopus egg extract, actin filaments disassembled within ∼80 s (Fig. 5 A), a turnover timescale similar to that observed for Listeria comet tails in extracts. Kymographs revealed that filaments disassembled in bursts (Fig. 5 B, f1–f3) that were rather similar to those observed in cofilin, coronin, and Aip1 (4). As previously discussed, we favor the hypothesis that these bursts of disassembly involve rapid filament destabilization, as opposed to filament severing, followed by rapid filament diffusion (4). The mean interval between bursts was 38 ± 11 s, and the mean size of a burst (corresponding to Z in the model above) was 312 ± 40 subunits. Bursts initiated both near filament ends (Fig. 5 B, f1–f3) and along internal filament segments (Fig. 5 B, f2) (see Note S12 in the Supporting Material). There was a preference for endwise initiation (68 ± 7% endwise events versus 32 ± 7% internal events), and also a slight preference for a filament to initiate a second burst of disassembly at the same end where an initial burst had occurred (f = 67% proximal bursts, 33% distal bursts), as also seen in cofilin, coronin, and Aip1 (4). These observations provide further evidence that bursting filament disassembly, as observed in cofilin, coronin, and Aip1 (4), drives filament turnover in Listeria comet tails in cytoplasm. Furthermore, the bursting parameters derived from these measurements (i.e., relatively long bursts Z ∼300 and a strong end bias β > 103) further point to a regime involving catastrophic filament elimination through large end-initiated bursts (Model E.I).
Figure 5.
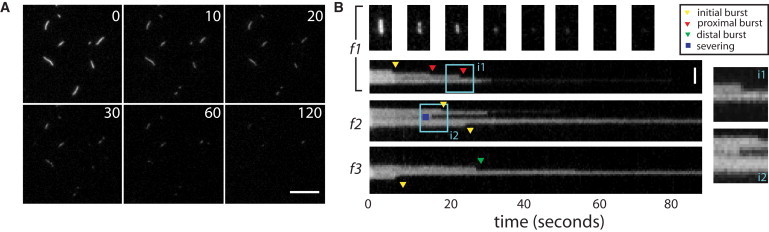
Single actin filaments disassemble in bursts in Xenopus egg cytoplasmic extracts. (A) Timelapse images of single actin filaments perfused with Xenopus egg extract. Elapsed time in seconds is shown in upper right of each image. Scale bar = 10 μm. (B) Kymographs of representative filaments (f1–f3), showing time on the x axis and distance along the filament contour on the y axis. (Triangles) Events scored as endwise bursting; (yellow triangles) initial bursts. (Red and green triangles) Proximal and distal bursts, respectively. (Blue squares) Internal events scored as severing events. (Light-blue square) Regions i1 and i2 magnified (insets on right). Filament polarity is unknown in these experiments. Scale bar = 2 μm.
Discussion
Using quantitative live cell imaging, we found that the decay of actin polymer mass in Listeria comet tails is very well fit by a simple exponential. By analyzing candidate turnover pathways using mathematical modeling, we found that exponential actin polymer mass decay is consistent with pathways where filaments grow rapidly and transiently from barbed ends, then depolymerize through either
-
1.
Slow pointed-end shrinkage (Model A, Regime II);
-
2.
Slow Arp2/3 dissociation from pointed ends, followed by rapid pointed-end shrinkage (Model B.III);
-
3.
Large bursts that initiate from filament ends (Model E.I); or
-
4.
Small bursts that initiate uniformly along the filament length (Model E.II).
By imaging single-filaments in Xenopus egg extracts, we found further evidence for filament disassembly through large bursts that initiate preferentially from filament ends. Taken together, our results most favor a pathway where filaments in Listeria comet tails grow transiently, enter a stable long-lived state, then undergo a large end-initiated burst that catastrophically causes whole-filament destabilization (Model E.I).
Our mathematical modeling results disfavor the concept that severing accelerates turnover by generating new shrinking filament ends (Fig. 3, and Fig. S4 and Fig. S5), or by generating short filament segments that can diffuse away as blocks (Fig. S3). Such pathways invariably generate nonexponential polymer mass decays, with a shoulder at short times not seen in Listeria comet tail data (Fig. 1). However, modeling results do not rule out the possibility that disassembly pathways act away from filament ends, as recently observed (12). In particular, bursting disassembly, which we proposed arises from the cooperative separation of the two actin filament strands (4), constitutes one such pathway consistent with polymer mass decay in Listeria comet tails (Model E.I or E.II).
How can we further distinguish between alternative models, and constrain parameters in our favored model (Model E.I) if it remained most consistent with data? The most obvious missing data is an accurate measurement of the actin filament length distribution, which might be obtainable with improved electron microscopy. Catastrophic turnover pathways (Models B.III and E.I) predict that the filament length distribution changes little in mean length or shape during turnover (i.e., the same distribution near the front and back of the Listeria tails (Fig. 4 A)). In contrast, severing-based pathways (Model C.II) predicts that mean filament length decreases progressively during filament turnover (Fig. 3 C). Measurements of residence lifetimes of individual polymer subunits in tail assemblies using single molecule techniques may also yield insights into mechanism (35,36). Finally, in the extract system it would surely be informative to perturb the levels of depolymerization factors, and then measure in-parallel effects on bulk depolymerization in comet tails, and single-filament depolymerization outside tails.
Finally, why might cells evolve such catastrophic turnover kinetics, where a single rate-limiting step (likely burst initiation, but possibly Arp2/3 dissociation) precedes rapid loss of whole filaments? In addition to enabling steady-state motility and rapid cytoskeleton remodeling, we propose that catastrophic turnover may maintain the mechanical integrity of dynamic actin assemblies by keeping filament lengths approximately constant during turnover (see Model B.III and Fig. S2). In severing-based turnover mechanisms, mean filament length decreases considerably even before any significant disassembly has occurred (Fig. 3 C, and Model C.II). This rapid filament shortening may soften an actin array, compromising its ability to support force generation (37,38). By keeping lengths relatively constant during turnover, catastrophic pathways may allow dynamic actin assemblies such as Listeria comet tails and lamellipodia to maintain their mechanical integrity as they are turning over.
Acknowledgments
We thank Sophie Dumont for a critical reading of this manuscript and other members of the Mitchison lab for insightful discussions. We also thank Christine Field for providing Xenopus egg extracts. Finally, we thank Michael Brenner, John Hartwig, and Marc Kirschner for intellectual guidance.
This work was supported by National Institutes of Health grant No. GM 23928. H.Y.K. was funded by a Howard Hughes Medical Institute predoctoral fellowship.
Supporting Material
References
- 1.Pollard T.D., Borisy G.G. Cellular motility driven by assembly and disassembly of actin filaments. Cell. 2003;112:453–465. doi: 10.1016/s0092-8674(03)00120-x. [DOI] [PubMed] [Google Scholar]
- 2.Kueh H.Y., Mitchison T.J. Structural plasticity in actin and tubulin polymer dynamics. Science. 2009;325:960–963. doi: 10.1126/science.1168823. [DOI] [PMC free article] [PubMed] [Google Scholar]
- 3.Bear J.E., Svitkina T.M., Gertler F.B. Antagonism between Ena/VASP proteins and actin filament capping regulates fibroblast motility. Cell. 2002;109:509–521. doi: 10.1016/s0092-8674(02)00731-6. [DOI] [PubMed] [Google Scholar]
- 4.Kueh H.Y., Charras G.T., Brieher W.M. Actin disassembly by cofilin, coronin, and Aip1 occurs in bursts and is inhibited by barbed-end cappers. J. Cell Biol. 2008;182:341–353. doi: 10.1083/jcb.200801027. [DOI] [PMC free article] [PubMed] [Google Scholar]
- 5.Carlier M.F., Laurent V., Pantaloni D. Actin depolymerizing factor (ADF/cofilin) enhances the rate of filament turnover: implication in actin-based motility. J. Cell Biol. 1997;136:1307–1322. doi: 10.1083/jcb.136.6.1307. [DOI] [PMC free article] [PubMed] [Google Scholar]
- 6.Andrianantoandro E., Pollard T.D. Mechanism of actin filament turnover by severing and nucleation at different concentrations of ADF/cofilin. Mol. Cell. 2006;24:13–23. doi: 10.1016/j.molcel.2006.08.006. [DOI] [PubMed] [Google Scholar]
- 7.Wang Y.L. Exchange of actin subunits at the leading edge of living fibroblasts: possible role of treadmilling. J. Cell Biol. 1985;101:597–602. doi: 10.1083/jcb.101.2.597. [DOI] [PMC free article] [PubMed] [Google Scholar]
- 8.Theriot J.A., Mitchison T.J. Actin microfilament dynamics in locomoting cells. Nature. 1991;352:126–131. doi: 10.1038/352126a0. [DOI] [PubMed] [Google Scholar]
- 9.Watanabe N., Mitchison T.J. Single-molecule speckle analysis of actin filament turnover in lamellipodia. Science. 2002;295:1083–1086. doi: 10.1126/science.1067470. [DOI] [PubMed] [Google Scholar]
- 10.Ponti A., Machacek M., Danuser G. Two distinct actin networks drive the protrusion of migrating cells. Science. 2004;305:1782–1786. doi: 10.1126/science.1100533. [DOI] [PubMed] [Google Scholar]
- 11.Diez S., Gerisch G., Bretschneider T. Subsecond reorganization of the actin network in cell motility and chemotaxis. Proc. Natl. Acad. Sci. USA. 2005;102:7601–7606. doi: 10.1073/pnas.0408546102. [DOI] [PMC free article] [PubMed] [Google Scholar]
- 12.Staiger C.J., Sheahan M.B., Blanchoin L. Actin filament dynamics are dominated by rapid growth and severing activity in the Arabidopsis cortical array. J. Cell Biol. 2009;184:269–280. doi: 10.1083/jcb.200806185. [DOI] [PMC free article] [PubMed] [Google Scholar]
- 13.Dabiri G.A., Sanger J.M., Southwick F.S. Listeria monocytogenes moves rapidly through the host-cell cytoplasm by inducing directional actin assembly. Proc. Natl. Acad. Sci. USA. 1990;87:6068–6072. doi: 10.1073/pnas.87.16.6068. [DOI] [PMC free article] [PubMed] [Google Scholar]
- 14.Theriot J.A., Mitchison T.J., Portnoy D.A. The rate of actin-based motility of intracellular Listeria monocytogenes equals the rate of actin polymerization. Nature. 1992;357:257–260. doi: 10.1038/357257a0. [DOI] [PubMed] [Google Scholar]
- 15.Theriot J.A., Rosenblatt J., Mitchison T.J. Involvement of profilin in the actin-based motility of L. monocytogenes in cells and in cell-free extracts. Cell. 1994;76:505–517. doi: 10.1016/0092-8674(94)90114-7. [DOI] [PubMed] [Google Scholar]
- 16.Rosenblatt J., Agnew B.J., Mitchison T.J. Xenopus actin depolymerizing factor/cofilin (XAC) is responsible for the turnover of actin filaments in Listeria monocytogenes tails. J. Cell Biol. 1997;136:1323–1332. doi: 10.1083/jcb.136.6.1323. [DOI] [PMC free article] [PubMed] [Google Scholar]
- 17.Gillespie D. Exact stochastic simulation of coupled chemical reactions. J. Phys. Chem. 1977;81:2340–2361. [Google Scholar]
- 18.Pardee J., Spudich J. Purification of muscle actin. Methods Enzymol. 1982;85:164–181. doi: 10.1016/0076-6879(82)85020-9. [DOI] [PubMed] [Google Scholar]
- 19.Brieher W.M., Kueh H.Y., Mitchison T.J. Rapid actin monomer-insensitive depolymerization of Listeria actin comet tails by cofilin, coronin, and Aip1. J. Cell Biol. 2006;175:315–324. doi: 10.1083/jcb.200603149. [DOI] [PMC free article] [PubMed] [Google Scholar]
- 20.Wang K. Filamin, a new high-molecular-weight protein found in smooth muscle and nonmuscle cells. Purification and properties of chicken gizzard filamin. Biochemistry. 1977;16:1857–1865. doi: 10.1021/bi00628a015. [DOI] [PubMed] [Google Scholar]
- 21.Wegner A. Head to tail polymerization of actin. J. Mol. Biol. 1976;108:139–150. doi: 10.1016/s0022-2836(76)80100-3. [DOI] [PubMed] [Google Scholar]
- 22.Pantaloni D., Le Clainche C., Carlier M.F. Mechanism of actin-based motility. Science. 2001;292:1502–1506. doi: 10.1126/science.1059975. [DOI] [PubMed] [Google Scholar]
- 23.Marchand J.B., Moreau P., Pantaloni D. Actin-based movement of Listeria monocytogenes: actin assembly results from the local maintenance of uncapped filament barbed ends at the bacterium surface. J. Cell Biol. 1995;130:331–343. doi: 10.1083/jcb.130.2.331. [DOI] [PMC free article] [PubMed] [Google Scholar]
- 24.Cameron L.A., Svitkina T.M., Borisy G.G. Dendritic organization of actin comet tails. Curr. Biol. 2001;11:130–135. doi: 10.1016/s0960-9822(01)00022-7. [DOI] [PubMed] [Google Scholar]
- 25.Coughlin M., Brieher W.M., Ohi R. Cell-free extract systems and the cytoskeleton: preparation of biochemical experiments for transmission electron microscopy. Methods Mol. Biol. 2007;369:199–212. doi: 10.1007/978-1-59745-294-6_10. [DOI] [PubMed] [Google Scholar]
- 26.Le Clainche C., Pantaloni D., Carlier M.F. ATP hydrolysis on actin-related protein 2/3 complex causes debranching of dendritic actin arrays. Proc. Natl. Acad. Sci. USA. 2003;100:6337–6342. doi: 10.1073/pnas.1130513100. [DOI] [PMC free article] [PubMed] [Google Scholar]
- 27.Martin A.C., Welch M.D., Drubin D.G. Arp2/3 ATP hydrolysis-catalyzed branch dissociation is critical for endocytic force generation. Nat. Cell Biol. 2006;8:826–833. doi: 10.1038/ncb1443. [DOI] [PubMed] [Google Scholar]
- 28.Maciver S.K., Wachsstock D.H., Pollard T.D. The actin filament severing protein actophorin promotes the formation of rigid bundles of actin filaments crosslinked with α-actinin. J. Cell Biol. 1991;115:1621–1628. doi: 10.1083/jcb.115.6.1621. [DOI] [PMC free article] [PubMed] [Google Scholar]
- 29.Silacci P., Mazzolai L., Hayoz D. Gelsolin superfamily proteins: key regulators of cellular functions. Cell. Mol. Life Sci. 2004;61:2614–2623. doi: 10.1007/s00018-004-4225-6. [DOI] [PubMed] [Google Scholar]
- 30.Carlier M.F., Pantaloni D., Korn E.D. Polymerization of ADP-actin and ATP-actin under sonication and characteristics of the ATP-actin equilibrium polymer. J. Biol. Chem. 1985;260:6565–6571. [PubMed] [Google Scholar]
- 31.Edelstein-Keshet L., Ermentrout G.B. Models for the length distributions of actin filaments. I. Simple polymerization and fragmentation. Bull. Math. Biol. 1998;60:449–475. doi: 10.1006/bulm.1997.0011. [DOI] [PubMed] [Google Scholar]
- 32.Carlsson A.E. Stimulation of actin polymerization by filament severing. Biophys. J. 2006;90:413–422. doi: 10.1529/biophysj.105.069765. [DOI] [PMC free article] [PubMed] [Google Scholar]
- 33.Tilney L.G., DeRosier D.J., Tilney M.S. How Listeria exploits host cell actin to form its own cytoskeleton. I. Formation of a tail and how that tail might be involved in movement. J. Cell Biol. 1992;118:71–81. doi: 10.1083/jcb.118.1.71. [DOI] [PMC free article] [PubMed] [Google Scholar]
- 34.Kueh H.Y., Brieher W.M., Mitchison T.J. Dynamic stabilization of actin filaments. Proc. Natl. Acad. Sci. USA. 2008;105:16531–16536. doi: 10.1073/pnas.0807394105. [DOI] [PMC free article] [PubMed] [Google Scholar]
- 35.Needleman D.J., Groen A., Mitchison T. Fast microtubule dynamics in meiotic spindles measured by single molecule imaging: evidence that the spindle environment does not stabilize microtubules. Mol. Biol. Cell. 2010;21:323–333. doi: 10.1091/mbc.E09-09-0816. [DOI] [PMC free article] [PubMed] [Google Scholar]
- 36.Kim S.Y., Gitai Z., Moerner W.E. Single molecules of the bacterial actin MreB undergo directed treadmilling motion in Caulobacter crescentus. Proc. Natl. Acad. Sci. USA. 2006;103:10929–10934. doi: 10.1073/pnas.0604503103. [DOI] [PMC free article] [PubMed] [Google Scholar]
- 37.Zaner K.S., Hartwig J.H. The effect of filament shortening on the mechanical properties of gel-filtered actin. J. Biol. Chem. 1988;263:4532–4536. [PubMed] [Google Scholar]
- 38.Doi M., Edwards S. Clarendon Press; London, UK: 1999. The Theory of Polymer Dynamics. [Google Scholar]
Associated Data
This section collects any data citations, data availability statements, or supplementary materials included in this article.