

Abstract
Recent theoretical approaches to food intake hypothesize that eating represents a balance between reward-driven motivation to eat versus inhibitory executive function processes, however this hypothesis remains to be tested. The objective of the current study was to test the hypothesis that the motivation to eat, operationalized by the relative reinforcing value (RRV) of food, and inhibitory processes, assessed by delay discounting (DD), interact to influence energy intake in an ad libitum eating task. Female subjects (n = 24) completed a DD of money procedure, RRV task, and an ad libitum eating task in counterbalanced sessions. RRV of food predicted total energy intake, however the effect of the RRV of food on energy intake was moderated by DD. Women higher in DD and RRV of food consumed greater total energy, whereas women higher in RRV of food but lower in DD consumed less total energy. Our findings support the hypothesis that reinforcing value and executive function mediated processes interactively influence food consumption.
Keywords: Food reinforcement, Delay discounting, Impulsivity, Food intake
Introduction
Behavioral paradigms to study choice include concurrent choices in which the choice involves responding among alternate reinforcers, or choices that vary over time. These paradigms tap into different processes: measuring responding for current choices is a way to assess relative reinforcing value (RRV) of alternatives, whereas choice that varies over time is a way to assess delay discounting (DD), an important component of impulsivity and executive function. Theories of drug addiction posit that the balance between the motivation to consume drugs and self-regulation of discounting of future consequences (Bickel et al., 2007) or more general self-regulatory abilities (Wiers et al., 2007) is critical for drug use and abuse. The same logic has been applied to hedonic-motivated eating (i.e., eating for pleasure) or overeating, with the hypothesis that eating involves a balance between the motivation to eat regulated by food reinforcement and the control of the impulse to eat (Appelhans, 2009; Epstein, Salvy, Carr, Dearing, & Bickel, 2010; van den Bos & de Ridder, 2006).
RRV refers to how hard someone will work to gain access to that reinforcer using progressive ratio schedules of reinforcement (Epstein, Leddy, Temple, & Faith, 2007). Having higher RRV of food is related to greater energy intake in an ad libitum eating task (Epstein et al., 2004a, 2004b; Epstein, Temple, et al., 2007), and obesity is associated with greater RRV for food (Giesen, Havermans, Douven, Tekelenburg, & Jansen, 2010; Saelens & Epstein, 1996; Temple, Legierski, Giacomelli, Salvy, & Epstein, 2008). Further, greater RRV for a palatable food predicts future weight gain in children (Hill, Saxton, Webber, Blundell, & Wardle, 2009) and abdominal obesity in rats (la Fleur et al., 2007).
Delay discounting is a behavioral paradigm that assesses the choice between two rewards that vary in amount and availability, and discounting occurs when a small immediate reward is chosen over a larger delayed reward (Bickel, Madden, & Petry, 1998). A substantial body of research has demonstrated that drug dependent individuals (Bickel & Marsch, 2001; Bickel, Odum, & Madden, 1999; Kirby, Petry, & Bickel, 1999; Madden, Petry, Badger, & Bickel, 1997; Petry, 2001), gamblers (Dixon, Jacobs, & Sanders, 2006; Dixon, Marley, & Jacobs, 2003), and obese individuals (Weller, Cook, Avsar, & Cox, 2008) show enhanced discounting of future rewards. In terms of eating, this may mean that obese persons are likely to engage in impulsive behaviors such as overeating energy-dense foods while discounting future problems associated with obesity.
To date, there is limited research on the interactive effects of RRV for food and DD. Recent models have theorized that inhibitory processes such as DD and reward processes such as RRV of food interact to influence food and drug intake (Alonso-Alonso & Pascual-Leone, 2007; Appelhans, 2009; Bickel et al., 2007; van den Bos & de Ridder, 2006). For example, individuals who steeply discount delayed rewards may find it difficult to resist the immediate gratification of preferred palatable energy-dense foods, whereas those who discount delayed rewards less steeply are better able to resist palatable foods (Appelhans, 2009). The aim of the current study was to examine the independent and interactive effects of the RRV of food and DD on food intake.
Methods
Participants
Twenty-eight healthy, non-smoking non-obese women (body-mass-index [BMI] < 30 kg/m2) were recruited from flyers and through an existing database maintained in the laboratory. Interested participants were screened by phone to ensure that they met the inclusion criteria of being female, having no experience with the study methods, and moderate to high liking of the study foods (≥4 on a 7-point Likert scale). Exclusionary criteria included taking medications that could influence taste, appetite, or olfactory sensory responsiveness, medical or psychological conditions that could impact eating or appetite, developmental or psychological disorders, food restrictions or allergies to the study foods, dieting, use of tobacco products, excessive alcohol drinking (>20 drinks per week), pregnancy, and prior participation in a laboratory study that used similar methods. This investigation was approved by the Social and Behavioral Sciences Institutional Review Board of the State University of New York at Buffalo, and the Pennsylvania State University Institutional Review Board.
Design and procedures
Eligible participants were scheduled for three 60–90 min weekday sessions between the hours of 11 am and 2 pm. Sessions were completed between 2 and 14 days apart, with all but two participants completing the sessions no longer than 7 days apart. Participants were instructed to refrain from eating and drinking anything except for water 3-h prior to each session, and were asked not to consume any of the food used in the RRV task 24 h prior to each session. Participants were asked to indicate their preferred food (macaroni and cheese or chicken nuggets) during the initial phone screen; this preferred food was used during the RRV task. Upon arrival to the first session, participants were taken to the experimental room where they read and signed consent forms. Same-day and 24-h food recalls were completed at each session to ensure compliance; one participant was rescheduled due to eating one of the study foods less than 24 h before the session. Participants completed one of three tasks per session: an ad libitum eating task, RRV task, and DD task in a counterbalanced order. Hunger and liking scales were administered immediately before and after each task. At the end of the first session, participants completed a demographic questionnaire. At the end of the final session, participants completed the Three-Factor Eating Inventory (Stunkard & Messick, 1985), Binge Eating Scale (Gormally, Black, Daston, & Rardin, 1982), and Questionnaire of Eating and Weight Patterns (Spitzer et al., 1992), and participants' heights and weights were measured. At study completion, each participant was debriefed and compensated with a $40 gift card.
Ad libitum eating task
Participants were provided with a tray containing large portions of lunch foods (Table 2) that were served in small individual bowls, cups, and plates. The lunch foods included both of the entrée foods that participants could choose for the RRV task, as well as salad ingredients and water ad libitum. Participants were instructed that they could eat as much of the presented foods as they liked and that additional portions of each item were available. The maximum amount of energy available if a person consumed both portions of all the lunch foods was 2411 kcal. No participant requested more than two portions of any item. Participants were instructed to remain in the experimental room for at least 20 min, after which they could stay for as long as they liked to complete their lunch. Three newspapers were available at a separate table in case the participant did not wish to consume any more food during the session. Foods were weighed before and after the session using an electronic scale (Denver Instrument XP-3000, Denver Instrument Company, Avada, Colorado) that was sensitive to 0.1 g; manufacturer's product information was used to compute the total energy intake of all lunch foods and energy intake of the preferred food. In the event that the participants mixed the individual foods, the foods were separated as much as possible before being individually weighed.
Table 2.
Weight, energy, and energy density per portion of each study food.a.
| Weight(g) | Energy(kcal) | Energydensity (kcal/g) | |
|---|---|---|---|
| Wegmans macaroni and cheese | 304 | 500 | 1.7 |
| Tyson southern style chicken nuggets | 84 | 270 | 3.2 |
| Wegmans honey mustard | 39 | 90 | 2.5 |
| Wegmans Memphis style barbeque sauce | 39 | 35 | 1.0 |
| Wegmans shredded iceberg lettuce | 50 | 10 | 0.3 |
| Wegmans ranch dressing | 32 | 140 | 4.7 |
| Wegmans Italian dressing | 32 | 110 | 3.7 |
| Tomatoes | 48 | 9 | 0.2 |
| Green bell peppers | 34 | 7 | 0.2 |
| Wegmans twice baked lightly seasoned croutons | 7 | 35 | 5.0 |
Two portions of each study food was made available.
Relative reinforcing value (RRV) of food task
RRV of food was determined by measuring the number of responses on a progressive ratio schedule that participants made to gain access to their preferred food. This measure has been used to assess the RRV of food in previous studies (Epstein, Temple, et al., 2007; Temple et al., 2008). The experimental room included two identical computer stations; participants could freely work at either station. At one station the participant could earn access to their preferred palatable food and at the other station they could earn access to three local and national newspapers. The latter computer station was provided to prevent participants from working for access to their preferred food out of boredom, and also provided an assessment of the relative reinforcing value of food versus alternatives. In previous research we have shown that non-overweight youth find alternatives to food more reinforcing than food (Temple et al., 2008), and this study provided an opportunity to extend this finding to non-overweight adults. The computer screens at both stations displayed three boxes containing different shapes that rotated and changed color every time the mouse button was pressed. Similar to a slot machine, a point was earned when all of the shapes matched. For every 5 points earned, a 100 kcal portion of their preferred food or 2 min of reading was awarded, depending on the station. The schedule of reinforcement for food and reading began at a fixed ratio of 4 and then doubled (FR8, FR16, FR32, FR64, FR128, FR256, FR512, FR1024, and FR2048) each time 5 points were earned. For instance, the participant initially had to click the mouse four times to earn each point, but after the first portion was earned, the participant had to click 8 times for each point, and then double that amount after the second portion was earned. The computers recorded the number of responses. Participants were instructed to do one activity at a time (i.e., play the computer, eat or read) and that the session would end when they no longer wished to earn points for access to food or reading materials. Water was provided ad libitum.
Delay discounting (DD) task
The DD task was used to measure the degree to which women discounted a hypothetical reward of $10 with increasing time delay. The procedure was adapted from Odum, Baumann, and Rimington (2006), where the same monetary amount and delay times were used. Though the amount was hypothetical, it has been shown that hypothetical and real amounts of money are discounted similarly (Johnson & Bickel, 2002). In the discounting task, two stacks of index cards were placed on a table in front of the participant; the stack on the left showed an amount that was always available now (i.e., “Would you like $10 now”) and the stack on the right showed an amount that was available after a time delay (i.e., “Would you like $10 in 1 day”). For each trial, the participant was asked to choose between the two monetary amounts, and the “available now” cards were shifted so that the value of the immediate outcome changed after each trial. Values for the monetary reward began at $10 and then decreased to $9.90, $9.75, $9.50, $9.25, $9.00, $8.50, $8.00, $7.50, $7.00, $6.50, $6.00, $5.50, $5.00, $4.50, $4.00, $3.50, $3.00, $2.50, $2.00, $1.50, $1.00, $0.75, $0.50, $0.25 and $0.10. For each time delay (1 day, 2 days, 1 week, 2 weeks, 1 month, 6 months, and 2 years), the immediate reward cards were titrated down and then up for half of the subjects and up and then down for the other half, the order of which was counterbalanced. This procedure produced two equivalence points per delay time (i.e., the immediate reward value at which the participant switched their preference from the immediate reward to the delayed reward, and the immediate reward value when the participant switched preference from the delayed reward to the immediate reward), which were then averaged. The task took approximately 40 min; after completing the task, each subject was provided with a small portion of their preferred food.
Measures
Height and weight
Height and weight were measured using a digital stadiometer (Measurement Concepts & Quick Medical, North Bend, WA) and digital scale (TANITA Corporation of America Inc., Arlington Heights, IL), respectively, and used to compute BMI (kg/m2).
Hunger and liking
Subjective ratings for hunger were collected using a 7-point Likert scale anchored by 1 = “Not at all hungry” and 7 = “Extremely hungry.” Liking for the study foods were assessed using a 7-point Likert scale anchored by 1 = “Do not like” to 7 = “Like very much.”
Dietary recalls
To ensure participants' compliance with the study protocol, at the beginning of each session participants were asked to recall all of the foods and beverages they consumed the day of and day before the experimental session. The participants were guided through the process and asked to list each food item they consumed as well as the portion size, method of preparation, added fats and sugars, and condiments. Measuring cups and spoons were provided to assist participants in recalling portion sizes. Energy intake was calculated using the Food Works nutrition software version 9 (Nutrition Company, Long Valley, NJ, USA); manufacturer's product information was located online when needed. Total energy consumed the day before the ad libitum session, and same-day energy intake prior to the ad libitum session were computed.
Eating questionnaires
Cognitive restraint, susceptibility to hunger, and dietary disinhibition were measured using the Three-Factor Eating Questionnaire (TFEQ; Stunkard & Messick, 1985), an instrument that has been shown to have good reliability and validity (Allison, Kalinsky, & Gorman, 1992; Bond, McDowell, & Wilkinson, 2001; Stunkard & Messick, 1985). The Binge Eating Scale (Gormally et al., 1982) and Questionnaire of Eating and Weight Patterns (Spitzer et al., 1992) were used to assess binge eating disorder (BED). Participants were identified as potentially having BED if they scored higher than 27 on the BES or were indicated as having the disorder by the Questionnaire of Eating and Weight Patterns. Individuals who met the criteria for BED were required to complete the Eating Disorders Examination (Fairburn & Cooper, 1993). In the current study, none of the participants met the criteria for BED.
Demographics
A general demographics questionnaire was used to assess participant's race, ethnicity, and education level. Race was coded into a dichotomous variable (0 = non-white, 1 = white).
Analytical plan
Except where noted, all descriptives and data analysis were completed using SAS version 9.1 (SAS Institute Inc., Cary, NC, USA).
Preliminary analyses
Changes in hunger measured before and after each behavioral task (i.e., DD, RRV, ad libitum eating task) were tested using repeated measures ANOVA with task type as the between-subjects factor.
A series of analyses were used to describe participants' discounting of money in the delay discounting task. Using Sigma Plot version 8 (Systat software, San Jose, CA, USA), k values, representing the impact of delay on discounting, and R2 (goodness-of-fit) estimates were computed per subject using the hyperbolic discounting equation described in Mazur (1987). These parameters could not be estimated for three subjects because their indifference points did not fit the hyperbolic discounting model, and as a result, they were excluded from all analyses. A sufficient fit was determined by having a hyperbolic discount function with a p-value less than .20. Because k values are not normally distributed, analyses were also computed based on the natural log of k values. Area under the curve (AUC) was also computed using their indifference points for each delay (Myerson, Green, & Warusawitharana, 2001), with AUC values ranging from 0 (highest possible discounting) to 1 (no discounting). In all analyses AUC and loge k values produced similar results as the original k values, and subsequently only findings based on the original k values will be presented in the current paper.
Repeated measures ANOVA was used to compare the breakpoints for RRV of food and non-food alternatives. Breakpoints were operationalized as the highest reinforcement schedule completed for access to food or non-food alternatives. Pearson correlation was used to assess the association between delay discounting and RRV of food. To establish which covariates to control for in predicting energy intake, Pearson correlations were used to assess the relations between the covariates (i.e., age, BMI, race, education, baseline hunger ratings in the ad libitum session, same-day caloric intake before the ad libtum session, cognitive restraint, disinhibition, TFEQ hunger, and BES) and dependent variables (i.e., total and preferred food energy intakes in the ad libitum eating task). Statistically significant covariates were entered in the following hierarchical regression models described below. Because age, BMI, and race are potential confounds, they were entered into each of the hierarchical regression models, regardless of significance level.
Hypothesis testing
A series of three hierarchical regression models were used to test the independent and hypothesized interactive effects of the RRV of food and DD on total energy intake in the ad libitum eating task. The first hierarchical regression model tested the main effect of the RRV of food and RRV of nonfood alternatives on total energy intake controlling for covariates. The covariates were entered into step 1, RRV of non-food alternatives was entered in step 2, and RRV of food was entered in step 3. The second model tested the main effect of DD on total energy intake after controlling for covariates. The covariates were entered in step 1 and k values were entered in step 2. The final model tested the hypothesized moderation effect of DD on RRV of food. Covariates, RRV of food, RRV of non-food alternatives, and k values were entered in step 1, and the interaction term RRV of food × k was added in step 2. As instructed by Aiken and West (1991) to reduce multicollinearity, RRV of food and k values were first centered and then used to form the RRV of food × k interaction term. Simple slopes were used to examine the significant interaction analyses (Aiken & West, 1991; Holmbeck, 2002) by calculating the slope for the RRV of food as a function of the median split of the k values. For each hierarchical regression model, extreme outliers were identified using the Cook's d statistic and then evaluated to determine whether they altered the significance of the model parameters. As a result, one participant was removed from all the hierarchical models (n = 24).
The preceding three hierarchical regression models were repeated with preferred food energy intake as the dependent variable; however, these results mirrored the findings obtained when total energy intake was used as the dependent variable. This is not surprising, given that total energy intake and preferred food energy intake are highly correlated (r = .74, p < 0.001). For brevity, only the findings for total energy intake are presented.
Results
Preliminary results
Twenty-eight women were enrolled in the study; however, k values could not be calculated for three women who had indifference points that did not fit the hyperbolic discounting function. In addition, one participant was a consistent outlier in regression models testing our hypotheses, and thus was excluded from all analyses. Analysis and descriptives will be presented for the remaining 24 subjects. No significant differences in BMI, age, education, and eating behaviors were observed between the excluded subjects and the remaining sample.
As shown in Table 1, 33.3% of the participants were non-Caucasian and 45.8% reported at least a college degree. The average participant was 31.5 years old and had a BMI percentile of 57.6 (SD = 26.4). Participants consumed an average of 1750.7 kcal (SD = 894.9) the day before the ad libitum session, and 216.1 kcal (SD = 204.2) the same day prior to completing the ad libitum session. A significant pre-post reduction in hunger ratings was observed following the ad libitum task (5.3 ±1.0 vs. 1.2 ±0.4, p < 0.001) and RRV task (before: 5.3 ± 0.8 vs. 2.2 ± 1.5, p < 0.001). No change in hunger was observed for the DD task (5.2 ±1.1 vs. 5.5 ± 1.5, p > 0.05), as participants did not eat during the task. No mean differences in pre-session hunger ratings by session task were observed (p = .91). Half the sample (50.0%) chose macaroni and cheese as their preferred food.
Table 1.
Subject characteristics (n = 24).
| Mean | SD | |
|---|---|---|
| Age | 31.5 | 11.2 |
| BMI (kg/m2) | 23.2 | 3.2 |
| TFEQ cognitive restraint | 9.9 | 4.3 |
| TFEQ disinhibition | 6.3 | 3.4 |
| TFEQ hunger | 5.3 | 2.6 |
| BES | 7.6 | 5.5 |
| Preferred food energy intake (kcal) | 294.1 | 122.4 |
| Total energy intake (kcal) | 655.3 | 222.5 |
| RRV of non-food alternativesa | 77.8 | 109.9 |
| RRV of fooda | 29.2 | 19.9 |
| k | 0.025 | 0.045 |
| AUC | 0.50 | 0.21 |
| N | % | |
|---|---|---|
| Race | ||
| Caucasian | 16 | 66.7 |
| Asian | 6 | 25.0 |
| African–American | 1 | 4.2 |
| Hispanic | 1 | 4.2 |
| Education completed | ||
| High school/vocational | 13 | 54.2 |
| College or graduate | 11 | 45.8 |
Note: BMI, body-mass-index; TFEQ, Three-Factor Eating Questionnaire; BES, Binge Eating Scale; RRV, relative reinforcing value; AUC, area under the curve.
Measured using breakpoints–the highest reinforcement schedule completed for access to food or alternatives in the RRV task (Epstein, Temple, et al., 2007; Temple et al., 2008).
In the RRV task, participants earned an average of 3.5 ±1.0 portions of their preferred food with breakpoints ranging from FR4 to FR64, and 4.1 ± 2.1 blocks of non-food alternatives (i.e., reading time), with breakpoints ranging from FR4 to FR512. ANOVA revealed that the RRV of non-food alternatives was significantly higher than the RRV of food (p < 0.01), which is consistent with previous research for non-overweight participants (Temple et al., 2008).
On average, women discounted money as the delay to its receipt increased. For example, as indicated by the median indifference points (data not shown), a $10 reward delayed by 1 day was worth $9.13, whereas it was only worth $3.25 2 years from now. The hyperbolic discounting function, used to compute the median k parameter for the total sample, revealed a median k parameter of .005 that fit the data well, explaining 89% of the variance in the delay discounting data. In addition, as shown in Table 1, the average woman in the study had a k value of 0.025 ± 0.044 and AUC value of 0.50 ± 0.21, the latter suggesting that the average woman showed moderate delay discounting of money.
Participants' relative reinforcing values for food were not associated with their k values (r= −.29, p = 0.18). In addition, no significant relationships were observed between total energy consumed in the ad libitum eating task and age, BMI, race, education, baseline hunger ratings in the ad libitum session, same-day caloric intake before the ad libitum session, cognitive restraint, disinhibition, TFEQ hunger, and BES.
Interactive effects of RRV of food and DD on energy intake of palatable foods
Table 3 provides standardized regression coefficients, R2, and change statistics from three models examining the effects of RRV of food and non-food alternatives (model 1), DD (model 2) and RRV of food × DD (model 3) on total energy intake. For model 1, BMI, age, and race were entered in step 1 and together accounted for 22% of the variance in total energy consumed in the ad libitum eating task. RRV of non-food alternatives was entered in step 2, and as expected it did not significantly predict total energy intake in the ad libitum eating task (β = –0.02, p = 0.90). In step 3, RRV of food was entered and emerged as a significant predictor of total energy intake (β =.58, p<0.01), explaining an additional 27% of the variance. For model 2, k values were not a significant predictor of total energy intake in the ad libitum eating task (β = –.29, p = 0.30). In model 3, the covariates, RRV of food and non-food alternatives, and k values were entered in step 1, accounting for 52% of the variance in total energy consumed in the ad libitum eating task. The RRV food × DD interaction term (β = .96, p < 0.01) was added in step 2 and explained an additional 15% of the variance; the final model explained 67% of the variance in total energy intake. Simple slope analyses demonstrated that RRV of food was a significant predictor of total energy intake in the ad libitum eating task when k values were high (β = 1.57, p < 0.01), but was only marginally significant when k values were low (β = 0.43, p = 0.07) (Fig. 1). In other words, women who showed high discounting of money and responded more for their palatable food in the RRV task consumed greater total energy in the ad libitum eating task, whereas only a weak, though similar, trend was observed among women who showed low discounting of money.
Table 3.
Standardized regression coefficients (β), R2, and change statistics from hierarchical regression models predicting total energy intake.
| Variables | Model 1 | Model 2 | Model 3 | ||||
|---|---|---|---|---|---|---|---|
| Step 1 | Step 2 | Step 3 | Step 1 | Step 2 | Step 1 | Step 2 | |
| BMI (kg/m2) | .34 | .34 | .29 | .34 | .29 | .26 | .30 |
| Age | .14 | .12 | .22 | .14 | .16 | .23 | .38 |
| Race | .46 | .46 | .25 | .46 | .41 | .24 | .32 |
| RRV of non-food alternativesa | −.02 | −.08 | −.07 | −.03 | |||
| RRV of fooda | .58** | .54** | 1.12*** | ||||
| k | −.29 | −.18 | .67 | ||||
| RRV fooda × k | .96** | ||||||
| Total R2 | .22 | .22 | .49 | .22 | .30 | .52 | .67 |
| F | 1.89 | 1.35 | 3.44* | 1.89 | 2.06 | 3.02* | 4.71** |
| ΔR2 | .01 | .27 | .08 | .15 | |||
| ΔF | .02 | 9.40** | 2.20 | 7.71** | |||
Note: BMI, body-mass-index.
p<.05.
p<.01.
p<.001.
Measured using breakpoints–the highest reinforcement schedule completed for access to food or alternatives in the RRV task (Epstein, Temple, et al., 2007; Temple et al., 2008).
Fig. 1.
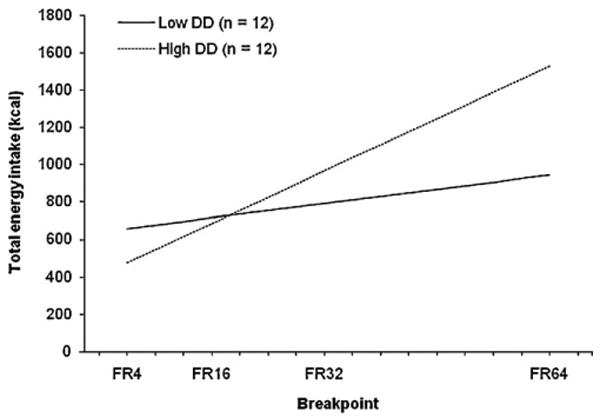
Association between the schedule of relative reinforcing value (RRV) of food and total energy intake across two levels of delay discounting (DD), operationalized as k values. High and low DD groups were obtained using median splits. Among women who showed high DD, higher RRV of food (measured using breakpoints or the highest schedule completed in the RRV task) predicted greater total energy intake in the ad libitum eating task (β = 1.57, p < 0.01); in contrast, only a weak trend between RRV of food and total energy intake was observed among women showing low DD (β = 0.43, p = 0.07). Breakpoints were the highest fixed ratio reinforcement schedule completed for access to food in the RRV task (Epstein, Temple, et al., 2007; Temple et al., 2008).
Discussion
The current study replicated the observation that individuals who respond more for food in the RRV task consume more food in an ad libitum eating task than individuals who respond less (Epstein et al., 2004a, 2004b; Temple et al., 2008), and that non-overweight participants respond more for non-food alternatives than food (Temple et al., 2008). The effect of the RRV of food was moderated by DD, such that women who showed higher discounting of future rewards and higher RRV of food consumed more total energy when given free access to palatable foods than women who showed lower discounting and a similar RRV of food. RRV of food was a strong predictor of total energy intake in the ad libitum eating task among women who discounted future rewards more, whereas RRV of food was a poor predictor of energy intake among women who discounted future rewards less. This may suggest that the energy intake of palatable foods among women who showed lower discounting was relatively insensitive to the RRV of a preferred palatable food.
Our findings, which were based on behavioral measures, are consistent with recent neurobiological hypotheses for hedonic-motivated eating (i.e. eating for pleasure; Appelhans, 2009; van den Bos & de Ridder, 2006), suggesting that the neural substrates mediating reward (e.g., limbic structures) and inhibition processes (e.g., prefrontal cortex) may interact in decision-making, and the substrate that dominates subsequently influences hedonic-motivated food consumption. To our knowledge, the current study may provide the first behavioral evidence in support of these models, suggesting that non-obese women who prefer short-term rewards over long-term rewards may be susceptible to consuming greater amounts of highly reinforcing, palatable foods than women who prefer long-term rewards. Moreover, given that the current study measured energy intake following a short fast, our findings may provide behavioral evidence that processes of reinforcement and cognitive inhibition might interact along with homeostatic mechanisms in hunger-motivated food intake, as suggested by Alonso-Alonso and Pascual-Leone (2007). Future neuroimaging studies are needed to provide neurocognitive evidence that these brain regions interact in both hedonic and hunger-motivated eating.
On average, women moderately discounted money, which is consistent with previous studies among adults (Odum et al., 2006; Odum & Rainaud, 2003). Previous research on delay discounting and obesity showed that obese women discounted money more than lean women, with no differences for men (Weller et al., 2008). The failure to find a relationship between discounting and eating in the current study may have been due to the inclusion of only non-obese women, who discount the future less than obese women (Weller et al., 2008). However, our findings do suggest that delay discounting predicts the energy intake of palatable foods among non-obese women who find a preferred palatable food highly reinforcing. In other words, it may be that non-obese women who discount future rewards more tend to consume more calories of palatable foods only when they find those foods highly reinforcing.
The primary limitation of this study was that it was conducted among non-obese women and thus may not be generalizable to men and obese women. In addition, a single palatable lunch food was used in the food reinforcement task and it is unclear whether the current findings are generalizable to other palatable foods such as desserts. Given that dessert foods are generally highly palatable, associations between RRV of food and dessert intake may be stronger than that observed for lunch foods, at least among those high in delay discounting.
In summary, the current study shows that DD and RRV of food interact in their influence on energy intake among non-obese women. Women who showed higher discounting of money and relative reinforcing value of a palatable food consumed a greater amount of calories when given free access to palatable foods; in contrast, women who showed lower discounting of money were relatively insensitive to the relative reinforcing value of palatable foods. This study provides supportive evidence for recent behavioral (Epstein et al., 2010) and neurobiological models advocating for an interactive role of reward and cognitive inhibition processes in both hunger- (Alonso-Alonso & Pascual-Leone, 2007) and hedonic-motivated eating (Appelhans, 2009; van den Bos & de Ridder, 2006). Future research is needed to examine whether these processes are different or more exaggerated in obese individuals.
Footnotes
This research was supported by grants from the Variety Club/Kalieda Health Foundation and the National Institute of Drug Abuse R01 HD 39778 awarded to Dr. Epstein, and the National Science Foundation's Alliances for Graduate Education & the Professoriate Program (AGEP) at the Pennsylvania State University and Ruth L. Kirschstein National Research Service Award grant F31 HL092721 awarded to Ms. Rollins. The content is solely the responsibility of the authors and does not necessarily represent the official views of the National Heart, Lung, and Blood Institute or the National Institutes of Health. We thank Lora G. Roba and Tinuke Oluyomi for their help with data collection and entry, and Jochebed Gayles, Mary Lai, Jackie Wiersma, and Claudio Ortiz for their assistance in revising the manuscript. Dr. Epstein is a consultant to Kraft foods and NuVal/ONQI.
References
- Aiken LS, West SG. Multiple regression: Testing and interpreting interactions. Thousand Oaks, CA: Sage Publications Inc; 1991. [Google Scholar]
- Allison DB, Kalinsky LB, Gorman BS. A comparison of the psychometric properties of three measures of dietary restraint. Psychological Assessment. 1992;4:391–398. [Google Scholar]
- Alonso-Alonso M, Pascual-Leone A. The right brain hypothesis for obesity. Journal of the American Medical Association. 2007;297:1819–1822. doi: 10.1001/jama.297.16.1819. [DOI] [PubMed] [Google Scholar]
- Appelhans BM. Neurobehavioral inhibition of reward-driven feeding: Implications for dieting and obesity. Obesity (Silver Spring) 2009;17:640–647. doi: 10.1038/oby.2008.638. [DOI] [PubMed] [Google Scholar]
- Bickel WK, Madden GJ, Petry NM. The price of change: The behavioral economics of drug dependence. Behavior Therapy. 1998;29:545–565. [Google Scholar]
- Bickel WK, Marsch LA. Toward a behavioral economic understanding of drug dependence: Delay discounting processes. Addiction. 2001;96:73–86. doi: 10.1046/j.1360-0443.2001.961736.x. [DOI] [PubMed] [Google Scholar]
- Bickel WK, Miller ML, Yi R, Kowal BP, Lindquist DM, Pitcock JA. Behavioral and neuroeconomics of drug addiction: Competing neural systems and temporal discounting processes. Drug and Alcohol Dependence. 2007;90(Suppl 1):S85–S91. doi: 10.1016/j.drugalcdep.2006.09.016. [DOI] [PMC free article] [PubMed] [Google Scholar]
- Bickel WK, Odum AL, Madden GJ. Impulsivity and cigarette smoking: Delay discounting in current, never, and ex-smokers. Psychopharmacology. 1999;146:447–454. doi: 10.1007/pl00005490. [DOI] [PubMed] [Google Scholar]
- Bond MJ, McDowell AJ, Wilkinson JY. The measurement of dietary restraint, disinhibition and hunger: An examination of the factor structure of the Three Factor Eating Questionnaire (TFEQ) International Journal of Obesity and Related Metabolic Disorders. 2001;25:900–906. doi: 10.1038/sj.ijo.0801611. [DOI] [PubMed] [Google Scholar]
- Dixon MR, Jacobs EA, Sanders S. Contextual control of delay discounting by pathological gamblers. Journal of Applied Behavior Analysis. 2006;39:413–422. doi: 10.1901/jaba.2006.173-05. [DOI] [PMC free article] [PubMed] [Google Scholar]
- Dixon MR, Marley J, Jacobs EA. Delay discounting by pathological gamblers. Journal of Applied Behavior Analysis. 2003;36:449–458. doi: 10.1901/jaba.2003.36-449. [DOI] [PMC free article] [PubMed] [Google Scholar]
- Epstein LH, Leddy JJ, Temple JL, Faith MS. Food reinforcement and eating: A multilevel analysis. Psychological Bulletin. 2007;133:884–906. doi: 10.1037/0033-2909.133.5.884. [DOI] [PMC free article] [PubMed] [Google Scholar]
- Epstein LH, Salvy SJ, Carr KA, Dearing KK, Bickel WK. Food reinforcement, delay discounting and obesity. Physiology and Behavior. 2010;100:438–445. doi: 10.1016/j.physbeh.2010.04.029. [DOI] [PMC free article] [PubMed] [Google Scholar]
- Epstein LH, Temple JL, Neaderhiser BJ, Salis RJ, Erbe RW, Leddy JJ. Food reinforcement, the dopamine D2 receptor genotype, and energy intake in obese and nonobese humans. Behavioral Neuroscience. 2007;121:877–886. doi: 10.1037/0735-7044.121.5.877. [DOI] [PMC free article] [PubMed] [Google Scholar]
- Epstein LH, Wright SM, Paluch RA, Leddy J, Hawk LW, Jaroni JL, et al. Food hedonics and reinforcement as determinants of laboratory food intake in smokers. Physiology and Behavior. 2004;81:511–517. doi: 10.1016/j.physbeh.2004.02.015. [DOI] [PubMed] [Google Scholar]
- Epstein LH, Wright SM, Paluch RA, Leddy JJ, Hawk LW, Jr, Jaroni JLJ, et al. Relation between food reinforcement and dopamine genotypes and its effect on food intake in smokers. American Journal of Clinical Nutrition. 2004;80:82–88. doi: 10.1093/ajcn/80.1.82. [DOI] [PubMed] [Google Scholar]
- Fairburn CG, Cooper Z. The Eating Disorder Examination. In: Fairburn CG, Wilson G, editors. Binge eating: Nature, assessment, and treatment. 12th. New York, NY: Guilford Press; 1993. pp. 317–360. [Google Scholar]
- Giesen JC, Havermans RC, Douven A, Tekelenburg M, Jansen A. Will work for snack food: The association of BMI and snack reinforcement. Obesity (Silver Spring) 2010;18:966–970. doi: 10.1038/oby.2010.20. [DOI] [PubMed] [Google Scholar]
- Gormally J, Black S, Daston S, Rardin D. The assessment of binge eating severity among obese persons. Addictive Behaviors. 1982;7:47–55. doi: 10.1016/0306-4603(82)90024-7. [DOI] [PubMed] [Google Scholar]
- Hill C, Saxton J, Webber L, Blundell J, Wardle J. The relative reinforcing value of food predicts weight gain in a longitudinal study of 7–10-y-old children. American Journal of Clinical Nutrition. 2009;90:276–281. doi: 10.3945/ajcn.2009.27479. [DOI] [PubMed] [Google Scholar]
- Holmbeck GN. Post-hoc probing of significant moderational and mediational effects in studies of pediatric populations. Journal of Pediatric Psychology. 2002;27:87–96. doi: 10.1093/jpepsy/27.1.87. [DOI] [PubMed] [Google Scholar]
- Johnson MW, Bickel WK. Within-subject comparison of real and hypothetical money rewards in delay discounting. Journal of the Experimental Analysis of Behavior. 2002;77:129–146. doi: 10.1901/jeab.2002.77-129. [DOI] [PMC free article] [PubMed] [Google Scholar]
- Kirby KN, Petry NM, Bickel WK. Heroin addicts have higher discount rates for delayed rewards than non-drug-using controls. Journal of Experimental Psychology: General. 1999;128:78–87. doi: 10.1037//0096-3445.128.1.78. [DOI] [PubMed] [Google Scholar]
- la Fleur SE, Vanderschuren LJ, Luijendijk MC, Kloeze BM, Tiesjema B, Adan RA. A reciprocal interaction between food-motivated behavior and diet-induced obesity. International Journal of Obesity. 2007;31:1286–1294. doi: 10.1038/sj.ijo.0803570. [DOI] [PubMed] [Google Scholar]
- Madden GJ, Petry NM, Badger GJ, Bickel WK. Impulsive and self-control choices in opioid-dependent patients and non-drug-using control participants: Drug and monetary rewards. Experimental and Clinical Psychopharmacology. 1997;5:256. doi: 10.1037//1064-1297.5.3.256. [DOI] [PubMed] [Google Scholar]
- Mazur JE. An adjusting procedure for studying delayed reinforcement. In: Commons ML, Mazur JE, Nevin JA, Rachlin H, editors. The effect of delay and of intervening events on reinforcement value. Hillsdale, NJ, England: Lawrence Erlbaum Associates, Inc; 1987. pp. 55–73. [Google Scholar]
- Myerson J, Green L, Warusawitharana M. Area under the curve as a measure of discounting. Journal of the Experimental Analysis of Behavior. 2001;76:235–243. doi: 10.1901/jeab.2001.76-235. [DOI] [PMC free article] [PubMed] [Google Scholar]
- Nutrition Company . FoodWorks nutrient analysis software: The professional's choice (Version 9) [Computer software] Long valley, NJ: Nutrition Company; [Google Scholar]
- Odum AL, Baumann AAL, Rimington DD. Discounting of delayed hypothetical money and food: Effects of amount. Behavioural processes. 2006;73:278–284. doi: 10.1016/j.beproc.2006.06.008. [DOI] [PubMed] [Google Scholar]
- Odum AL, Rainaud CP. Discounting of delayed hypothetical money, alcohol, and food. Behavioural processes. 2003;64:305–313. doi: 10.1016/s0376-6357(03)00145-1. [DOI] [PubMed] [Google Scholar]
- Petry NM. Delay discounting of money and alcohol in actively using alcoholics, currently abstinent alcoholics, and controls. Psychopharmacology. 2001;154:243–250. doi: 10.1007/s002130000638. [DOI] [PubMed] [Google Scholar]
- Saelens BE, Epstein LH. The reinforcing value of food in obese and nonobese women. Appetite. 1996;27:41–50. doi: 10.1006/appe.1996.0032. [DOI] [PubMed] [Google Scholar]
- SAS Institute Inc . SAS (version 9) [computer software] Cary, NC: SAS Institute Inc; [Google Scholar]
- Spitzer RL, Devlin MJ, Walsh B, Hasin D, Wing R, Marcus M, et al. Binge eating disorder: A multisite field trial of the diagnostic criteria. International Journal of Eating Disorders. 1992;11:191–203. [Google Scholar]
- Stunkard AJ, Messick S. The three-factor eating questionnaire to measure dietary restraint, disinhibition and hunger. Journal of Psychosomatic Research. 1985;29:71–83. doi: 10.1016/0022-3999(85)90010-8. [DOI] [PubMed] [Google Scholar]
- Systat software . Sigma Plot (Version 11) [computer software] San Jose, CA: Systat Software; [Google Scholar]
- Temple J, Legierski C, Giacomelli A, Salvy S, Epstein L. Overweight children find food more reinforcing and consume more energy than do nonoverweight children. American Journal of Clinical Nutrition. 2008;87:1121–1127. doi: 10.1093/ajcn/87.5.1121. [DOI] [PMC free article] [PubMed] [Google Scholar]
- van den Bos R, de Ridder D. Evolved to satisfy our immediate needs: Self-control and the rewarding properties of food. Appetite. 2006;47:24–29. doi: 10.1016/j.appet.2006.02.008. [DOI] [PubMed] [Google Scholar]
- Weller RE, Cook EW, III, Avsar KB, Cox JE. Obese women show greater delay discounting than healthy-weight women. Appetite. 2008;51:563–569. doi: 10.1016/j.appet.2008.04.010. [DOI] [PubMed] [Google Scholar]
- Wiers RW, Bartholow BD, van den Wildenberg E, Thush C, Engels RC, Sher KJ, et al. Automatic and controlled processes and the development of addictive behaviors in adolescents: A review and a model. Pharmacology, Biochemistry and Behavior. 2007;86:263–283. doi: 10.1016/j.pbb.2006.09.021. [DOI] [PubMed] [Google Scholar]