

Abstract
Single-molecule measurement techniques have illuminated unprecedented details of chemical behavior, including observations of the motion of a single molecule on a surface, and even the vibration of a single bond within a molecule. Such measurements are critical to our understanding of entities ranging from single atoms to the most complex protein assemblies. We provide an overview of the strikingly diverse classes of measurements that can be used to quantify single-molecule properties, including those of single macromolecules and single molecular assemblies, and discuss the quantitative insights they provide. Examples are drawn from across the single-molecule literature, ranging from ultrahigh vacuum scanning tunneling microscopy studies of adsorbate diffusion on surfaces to fluorescence studies of protein conformational changes in solution.
Keywords: single molecule, scanning tunneling microscopy, atomic force microscopy, transmission electron microscopy, optical microscopy, subdiffraction microscopy, Förster resonance energy transfer, fluorescence, photoactivation light microscopy, magnetic resonance, spin, magnetic resonance force microscopy, electron spin resonance, nitrogen vacancy
Vocabulary
- diffraction limit
nominal lower bound on feature sizes resolved with scattered particles or radiation; in general, 200 nm for visible light and less than 0.1 nm for high-energy electrons
- conformational change
a change of the orientation (geometry) of a given chemical group relative to others in a single molecule or macromolecule
- real-space measurement
in this context, a measurement based on positions of individual molecules, rather than by diffracting radiation through a regular lattice; advantageous since it allows heterogeneous structures to be measured
- localization
ability to determine the location of a single molecule in space
- resolution
ability to distinguish two closely-spaced molecules; in general, for far-field measurements, resolution is proportional to the wavelength of probe radiation used
The ability to measure the structure and behavior of single molecules has evolved in parallel in fields ranging from physics to biology. Molecules studied vary widely: from small molecules less than 1 nm in diameter to DNA molecules with lengths of several thousand nanometers. Some measurements are performed at cryogenic temperatures (often near 1 K) and ultrahigh vacuum (10−9 Torr), others in liquid at room temperature. Some experiments measure the molecule directly, while others require attachment of a high-contrast label, which may be orders of magnitude larger than the molecule itself.
Broadly, the field has evolved from two complementary perspectives that may be understood in analogy to the “top-down vs bottom-up” dichotomy that has driven nanotechnology. The bottom-up approach starts from single atoms and certain classes of simple molecules, observed under rigorously controlled conditions (often cryogenic temperatures and ultrahigh vacuum). Such experiments have their roots in the early development of field emission and field ionization microscopy1,2 and have evolved and expanded to include such techniques as single-molecule fluorescence(3) and transmission electron and scanning tunneling microscopies,(4) some with resolutions better than 0.1 nm.
The top-down approach starts from large macromolecules such as DNA, sometimes with lengths as great as several micrometers.5−7 Although such molecules natively function in complex, three-dimensional cellular environments, early experiments required simplifications in order to observe single molecules. Typically this meant fixing molecules to surfaces and/or operating in simple solutions such as aqueous buffers. A number of experimental techniques have developed in parallel: optical measurements based on attachment of single fluorophores or other optical tags;8−10 force measurements using optical traps,(11) magnetic beads,5,12 flowing solvent,13,14 or AFM;(15) and patch clamp(16) and other techniques(17) based on the application of external fields.
Both bottom-up and top-down approaches have developed increasingly sophisticated single-molecule measurements. For bottom-up measurements, this typically means understanding larger, more complex molecules in less restricted environments (frequently under atmospheric conditions and sometimes in liquids).8,18−21 For top-down measurements, this often means understanding more details about an already complex molecule, either by measuring at shorter length scales or by working in less simplified environments (e.g., live cells).22−27 Bottom-up experiments typically provide more detailed information on molecular behavior, and top-down experiments still deal in more complicated molecules and environments.
As these approaches begin to converge in terms of both length scales and target complexity, it becomes important to develop a joint understanding that exploits the measurement capabilities of each. Across the spectrum of tools and targets, experiments have localized and measured the topography of molecules in space, tracked their motion, and quantified their physical properties. Imaging ranges from tracking single molecules in live cells(23) to mapping the chemical structure of single molecules on surfaces.(28) Molecular motion can also be measured, from internal conformational changes to nanometer-scale rotation and translation,11,29 as well as the forces required for these motions.(30) Single-molecule spectroscopic measurements include molecular vibrations,(31) conductance,(32) nuclear(33) and electronic spins,(34) and differences in enzymatic activity.35,36
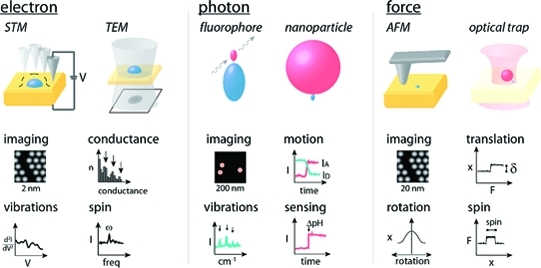
To create a more unified perspective, we select seminal reviews and experimental examples from across the breadth of the single-molecule literature, grouped broadly by probe type. We discuss electron-based measurements,(18) optical measurements,8,37 and force-based methods11,12 (1), with a primary focus on work in the condensed phase. Each probe type has unique measurement advantages, which we first discuss briefly to provide context for understanding how the physical properties of the sample and length scales to be measured influence the choice of probes.
Figure 1.

Quantitative analysis of single-molecule measurements based on photons, force, and electrons. Photonic measurements (left) are usually based on one or more fluorescent labels (either small molecules or fluorescent proteins) or a larger nanoparticle label. Force-based measurements (center) typically use a macroscopic cantilever or a micrometer-scale bead to apply forces from piconewtons to nanonewtons. Electron-based methods (right) can involve electron conductance, tunneling, or scattering.
Electrons have a number of features that make them useful probes at the very short length scales relevant for single-molecule measurements. Their small mass means they exhibit substantial quantum mechanical tunneling behavior, which allows measurement of distances up to a few nanometers with sub-Ångström sensitivity. Coupling tunneling with inelastic processes enables measurement of vibrational and other energy levels.38,39 The sub-Ångström wavelength of high-energy electrons means they are able to resolve atomic-scale features in diffraction experiments.(40) Since electrons are responsible for molecular bonding, measuring electronic conductance through a molecule can in some cases also probe single-molecule conformations.(41)
The excellent spatial resolution achieved in electron-based single-molecule measurements comes at a cost. Observed areas are typically quite small (often much less than 1 μm2). Thus, while measuring the behavior of a single molecule relative to its immediate environment is straightforward, relating it to micro- to macroscopic features can be more difficult. Electron-based measurements also place fairly stringent requirements on sample preparation: scanning tunneling microscopy generally requires samples no more than a few nanometers thick on conductive substrates, and transmission electron microscopy requires samples to be electron-transparent (usually less than 100 nm thick and composed of low-atomic-number materials).
Photons in the visible and near-visible ranges have much longer wavelengths and, consequently, are used in different ways to quantify single-molecule behavior. The longer length scales typically probed under photonic illumination make such measurements especially useful in quantifying the relationships between single molecules and micro- to macroscopic features in their environment, such as in biological samples. Measuring the behavior of a single molecule requires that the molecule display a unique optical signature to distinguish it from up to trillions of background molecules; almost universally this is achieved by covalently binding a fluorescent emitter or other optical tag to the molecule of interest.(42) Fluorophores can be chosen to be sensitive to pH, electric fields, ionic strength, and other factors, providing a probe of the target molecule’s immediate environment.(43) Fluorescence polarization measurements can be used to determine fluorophore orientation, which correlates with target molecule orientation.(44)
The diffraction limit would appear to restrict photonic measurements to features of hundreds of nanometers and larger. However, subdiffraction optical methods, such as stimulated emission depletion and selective photoactivation, are beginning to allow single fluorophores to be localized down to tens of nanometers, usually at a cost to measurement time and thus the ability to probe dynamics. Measurements of energy transfer efficiency between two fluorescent dyes or plasmonic probes can be used to measure the distance between the probes enabling measurements of the dynamics of protein conformation changes on millisecond time scales.
In addition to diffraction-based limitations on spatial resolution, fluorescence measurements are constrained by the need to add a label to the molecule of interest and by the fact that fluorescent dyes eventually bleach, losing their ability to fluoresce after 104−106 excitations. Nanoparticle probes are less sensitive to bleaching, but are often larger than the molecule being measured.
Forces between a sharp cantilever and a surface can be used to measure the topography of single molecules on a surface. Typical lateral resolution is 1−10 nm (depending on the radius of curvature of the cantilever tip), with vertical resolution better than 1 nm. However, careful instrumental design (often including ultrahigh vacuum and cryogenic temperatures) and noncontact imaging based on frequency shifts can provide subnanometer lateral resolution.
Force-based methods are also useful for understanding force-induced conformational changes in single molecules. Such measurements typically involve a molecule tethered to a surface and to a probe (such as an AFM tip, magnetic bead, or nanoparticle suitable for optical trapping). Forces on the order of 0.1−1000 pN are applied to the probe, resulting in measured displacements on the order of nanometers, usually corresponding to protein unfolding or motion of a molecular motor.(45)
In comparison to optical traps and magnetic beads, AFM allows the application and measurement of larger forces, usually with lower spatial resolution due to surface drift relative to the probe. Often AFM measurements use nonspecific binding between target and probe, which can impact reproducibility. Optical traps work in a lower force regime (<100 pN) but can provide better spatial resolution (<1 nm), especially if the target is bound to two traps rather than a trap and a surface.(46) Targets are usually bound to the trap bead using specific covalent strategies, increasing reproducibility, but photodamage of the target is a concern. Magnetic beads work in an even lower force regime (<20 pN) and provide reduced spatial resolution relative to optical traps but eliminate the concern of photodamage and allow the probe to be rotated controllably.6,45 Forces can also be applied to many magnetically labeled targets in parallel.(47)
Electron-Based Measurements
Electrons are well-suited for direct, label-free measurements of single molecules, in which either the structure of the molecule or its interactions with its immediate surroundings (over length scales of 1−100 nm) are of interest. Two of the most widely used techniques for performing such measurements are scanning tunneling microscopy (STM) and transmission electron microscopy (TEM).
In STM (Figure 1, top right) molecules are adsorbed on a conductive surface, and an atomically sharp metallic probe is rastered across the surface while a bias (typically about 1 V) is applied and a tunneling current (picoamperes to nanoamperes) is measured. The tunneling current decreases exponentially with increasing tip−surface distance and is measurable up to distances of a few nanometers. Thus, the topography of surface features, including single molecules and atoms, can be measured with both vertical and lateral resolution better than 0.1 nm (sometimes 0.1 pm). The tunneling current also depends on the electronic structure of the molecule in the tunneling junction; thus, it is possible to quantify energy levels within the molecule using STM. Since each pixel in an STM image is collected sequentially, frame rates are relatively slow: a 256 × 256 pixel image, collected at 1 ms per pixel (about 6000 tunneling electrons in 1 ms at 1 pA), requires approximately 1 min to acquire.
In TEM (2, top center), molecules are deposited on a thin, electron-transparent surface, and a beam of high-energy electrons (on the order of 100 keV) is directed through the sample. Unscattered electrons can be collected in a CCD, producing a negative image of the strong electron scatterers. Scattering intensity depends on both crystallographic order and the atomic number of the scatterer. For low-contrast samples such as proteins, salts containing high-atomic-number nuclei, such as uranyl acetate, can be used to enhance contrast. Diffraction patterns in scattered electrons can also be analyzed to measure crystallographic structure in ordered samples. Typical spatial resolutions are on the order of 1 nm, although there are recent examples of resolutions better than 0.1 nm.
Figure 2.

Overview of electron-based single-molecule measurements. Electrons can be used to perform label-free structural measurements of single atoms and molecules, including molecular lattices and their defects, heterogeneous structures, and motion including diffusion and switching. Single-molecule spectroscopy can also be performed using a scanning tunneling microscope by varying either bias or tip height or by applying a magnetic field to polarize spins.
Imaging Structure
Both STM and TEM can be used to measure the structure or motion of molecules on surfaces;40,48−51 STM can also be used to perform spectroscopy on single molecules (2, right).(52) One of the powerful advantages to performing label-free real-space measurements at subnanometer length scales is that it allows the single-molecule measurement not only of ordered structures but also of defects and heterogeneous structures. This is important since nanoscale reactivity is often determined by the behavior of high-energy defects and other heterogeneous features.53,54
Lattice Structure
Molecular lattices have traditionally been measured using crystallographic techniques such as X-ray diffraction (XRD), but in some cases, it is both possible and advantageous to measure lattices using single-molecule techniques (3).(55) In STM, the organization of the molecules on the surface is measured directly in real-space, and image-processing software is used to calculate lattice parameters based on the Fourier transformation of the image. A typical calculation might be made using a 20 nm × 20 nm image containing roughly 103 molecules in a single 2D layer. In relation, 3D single-crystal XRD measurements require a 50−500 μm3 crystal containing on the order of 1015 molecules(56) and averages out heterogeneous features. Conversely, a 2D STM lattice measurement shows heterogeneous features but may or may not provide information about the locations of nuclei within the molecules, depending on molecular orientation.55,57
Figure 3.

Electron-based measurements can be used to quantify both regular lattice structures and defects. (a,b) STM is used to quantify packing density and structure of two different halogenated phenols on a Cu{111} surface. Both regular structure and defects are evident in both frames. (c) TEM image and Fourier transform of a nanocrystal superlattice composed of PbS and Pd particles. Again, direct imaging allows defects to be observed in addition to lattice structure. (d) TEM image of a one-dimensional lattice of endohedral lanthanide fullerenes in a single-walled carbon nanotube. Inset shows positions of individual lanthanide atoms within fullerenes. Note that while TEM typically measures longer length scales than STM (observe difference in scale bars between (a−b) and (c)), it is also possible to measure shorter length scales similar to STM (note similar scale bars in (a−b) and (d)). Adapted from refs (58), (59), and (66).
Molecular lattice structures based on STM image analysis have informed much of the understanding of the behavior of self-assembled monolayers (SAMs) on surfaces.55,60 Such measurements can be made under vacuum or atmospheric conditions or at liquid−solid interfaces. The properties of a monolayer depend strongly upon both its epitaxy with the underlying substrate and the strength of intermolecular interactions within the monolayer, also determined by lattice spacing. Substrate epitaxy is critical enough that SAM lattices are described in relation to the substrate lattice. For example, the (√3 × √3)R30° lattice formed by n-alkanethiolates on Au{111} has a lattice constant of 4.995 Å = √3 × 2.884 Å (the Au lattice constant) and is rotated 30° relative to the Au lattice.(61) A wide variety of SAM lattices have been measured,(21) including alkanethiols, alkaneselenols, functional cage molecules, amino acids, sugars, and DNA bases. Even complex structures such as lattices formed by different stereochemical binding patterns of modified oligo(phenylene ethynylene) molecules can be measured.(62) In cases where binding is more promiscuous, such as n-alkaneselenolates on Au{111}, Moiré patterns can still form, resulting in large unit cells comprising many molecules.(63)
Lattice structures measured by TEM complement the length scales of those measured by STM. While it is difficult to measure lattices for small-molecule organic species due to their low electron scattering cross sections, TEM has been used to measure both atomic lattices in higher-atomic-number inorganic nanocrystals with sizes comparable to single proteins and structures of superlattices composed of nanocrystals.(64) In certain cases, it is also possible to achieve even higher resolution using aberration-corrected lenses and for structures with inherently high contrast or low background. For instance, fullerene peapod structures can be observed inside carbon nanotubes,(65) and when the structures are assembled using endohedral lanthanide fullerenes, the positions of individual lanthanide atoms can be measured within the assembly.(66)
Recently, it has also become possible to determine 3D structures for large, high-symmetry organic molecules such as virus capsids by compiling thousands of real-space images taken from individual capsids at a range of angles.67−69 This technique has been used to derive crystal structures of aqueoviruses(68) and the holoenzyme of propionyl-coenzyme A carboxylase(69) with resolutions as good as 3.3 and 3.2 Å, providing important insights into the biological functions of each. Although computationally intensive, such analyses are valuable for a broad range of biologically important molecules that have not yet been successfully crystallized and therefore cannot be analyzed by standard bulk structural techniques such as XRD.
Defects and Heterogeneous Structure
While the ability to measure regular structures at the nanoscale has proved important in understanding the properties of nanostructured surfaces and materials, the ability to probe structural heterogeneities is equally vital. Defects and disordered areas are often the most reactive sites in molecular and atomic lattices, and heterogeneous, noncrystalline structures can be the most important to probe at the single-molecule level since they are difficult or impossible to characterize using bulk or ensemble measurements.
Scanning tunneling microscopy resolves surface structure and defects with molecular detail and has been used to quantify changes in SAM structure, including nanometer-scale increases in domain size70,71 and changes in lattice structure72,73 due to thermal annealing, as well as nanometer-scale phase segregation in multicomponent SAMs.74,75
Both inorganic surfaces and self-assembled 2D lattices of alkanethiols bound to Au{111} surfaces via their thiol headgroups have been studied extensively.(55) For example, Poirier and Tarlov observed that adding alkanethiols to an atomically flat gold surface has a number of important effects in addition to forming a SAM (4).(76) The gold structure distorts under the 5−15 nm ordered domains in the monolayer, forming a c(4 × 2) lattice, and irregular one-atom deep pits form in the gold surface as atoms are removed by thiols in solution. Domain boundaries, the largest and most reactive defects in the SAM, are found to run between pairs of vacancy islands, an example of resolving complex inter-related processes on surfaces at the single-molecule level.
Figure 4.

Scanning tunneling microscopy used to measure heterogeneity in self-assembled monolayers of alkanethiols on Au{111}. Addition of thiols to an atomically flat gold surface causes reconstruction of the gold surface under ordered molecular domains and creates irregular one-atom deep pits where thiols have removed gold atoms. The etch pits act to trap tilt domain defects (lines running between pits in (b)). Adapted from ref (76).
Defect reactivity can be used to target further deposition of single active molecules in the monolayer; secondary deposition can also be tracked by STM. This capability has been exploited by Andrews and co-workers to distribute neurotransmitter receptors on a surface,(77) increasing binding specificity, and by Weiss and co-workers to distribute single-molecule switches,20,41,78 increasing switching activity. In this context, monolayer defects can be controlled through high-temperature annealing or selection of the size and chemistry of the assembled molecules,79−85 thereby controlling the placement and environments of active molecules inserted for study.
Both STM and TEM can be used to measure the behavior of heterogeneous structures at the molecular level (5). For instance, STM measurements of heterogeneous structure by a number of groups have been used to quantify substrate-mediated interactions.86−915 shows an image of 2 nm islands of Br atoms adsorbed to a Cu{111} surface, measured by Weiss and co-workers.(91) The Br adsorbates perturb the energy levels of the surface, visible as rings around each island. Measuring the shortest distance between more than 3000 pairs of neighboring islands (5) reveals peaks at multiples of 1.5 nm, or about half the Fermi wavevector. Simultaneous barrier height and topography measurements of single molecules in heterogeneous (bicomponent) SAMs have been used to measure the tilt angles of single alkanethiols.(92) Structure within a single molecule can also be probed. While some molecules contain high-contrast features that can be measured directly, large molecules lacking significant contrast, such as DNA, can be stained by metallic intercalators to enhance contrast.(93) A number of studies have probed the ability of STM to identify nucleotides.94,95
Figure 5.

Electron-based measurements in real space can be used to quantify heterogeneous structure at the single-molecule scale. (a) STM image of Br adatom islands on Cu{111}. (b) Histogram of inter-island distances exhibits peaks at multiples of half the Fermi wavevector; black dotted line shows the expected distribution in the absence of interisland interactions. (c) Automated analysis of TEM images identifies gold nanoparticle and gold/quantum dot groupings on single-molecule DNA scaffolds; DNA scaffolds are not visible in TEM images due to the low atomic number of organic elements. Adapted from refs (91) and (98)−(100).
Larger molecules such as DNA can also be studied by TEM,96,97 although again additional contrast agents may be required due to the low scattering cross sections of organic compounds. 5 (lower half) shows TEM images of discrete structures comprising individual DNA helices bound on both ends to Au nanocrystals(98) and/or quantum dots.(99) A custom image-analysis routine(100) developed by Alivisatos and co-workers allows automated analysis of hundreds of structures to determine population hybridization statistics. Nanocrystal labels may also be combined with background staining to visualize single protein filaments and other biological structures more completely.(101)
Electronic Measurements of Motion
Although both STM and TEM are most often used to perform static measurements of molecules or particles, each technique has also been used to quantify motion at the nanometer scale. This provides linear spatial resolution an order of magnitude better than even subdiffraction optical methods, while often restricting the types of samples that can be examined. Broadly, electron-based studies can be classified as measurements of translation, rotation, and switching.
Translation
Molecules adsorbed on surfaces can undergo 2D diffusive motion, which can be quantified by STM.102,103 As mentioned previously, STM frame rates are typically on the order of minutes, so such studies are sometimes performed at low temperatures (often 4 K) to slow diffusion to a relevant time scale; the temperature is selected to match the barrier to motion and the limited data acquisition rate. A number of studies by Bartels and co-workers have measured Arrhenius diffusion constants for small aromatic molecules on Cu{111},104−108 tracking on the order of 1000 motion events.
Studies at the single-molecule level highlight phenomena that would be averaged out in bulk measurements. For instance, measurements of 9,10-dithioanthracene (DTA) (6) show that it diffuses only parallel to the long axis of the molecule, with a rate constant of 4 × 10⁹ s−1.(104) For a similar molecule, anthroquinone, which can bind up to two CO2 molecules (6), diffusion rates were found to correlate strongly with the number of bound CO2 molecules.(109)
Figure 6.

Measuring single-molecule motion on surfaces using STM. (a) Diffusion of aromatic acene on Cu{111} and Arrhenius plot of diffusion rate vsT. (b) STM images of single acene molecules bound to one and two CO2 molecules, and Arrhenius plot showing reduced diffusion rate of acenes with CO2 bound. (c) Automated analysis of diffusion of benzene on Au{111} based on image cross-correlation. Motion events are binned based on the number of nearest-neighbor benzenes to calculate association energies based on substrate-mediated interactions. Adapted from refs (104) and (109)−(111).
Automated image analysis greatly facilitates such measurements. Weiss and co-workers studied the motion of benzene on Au{111},110,111 developing an automated image analysis procedure based on image convolution and cross-correlations. Motion events in over 800 sequential images were pooled and analyzed to calculate the strength of interactions between neighboring benzene molecules on the surface.
Currently, the ability to measure diffusive processes by STM at higher temperatures is largely limited by slow frame rates, which arise from the precise feedback control required for nonperturbative imaging. Ongoing development of high-speed (video-rate and faster) STM scanning mechanisms promises to expand the range of dynamic processes that can be measured.112−114
Faster native frame rates (on the order of milliseconds) make TEM better suited to the study of dynamic processes. A variety of in situ TEM designs enable measurements of nanoscale responses to external stimuli such as mechanical force from an AFM or the application of an electric field. The requirement that samples be strong electron scatters has meant that most studies have examined dynamic processes in larger (>10 nm) nanoscale particles of inorganic materials.(115) However, some measurements are approaching the resolution and sensitivity necessary for single-molecule experiments. For instance, tumbling motions of single La atoms confined within La2@C80−carbon nanotube peapod assemblies have been observed.(66) Importantly, the ability to observe the motion of high-contrast species may enable tagging experiments similar to many of the optical experiments discussed in later sections.
The high-energy electron beam requires that samples be measured under vacuum, which has limited studies in liquid, restricting many types of dynamic processes. The recent development of enclosed liquid TEM sample holders116−118 has enabled the measurement of both diffusion of small (∼5 nm) inorganic nanocrystals(117) and the rate of growth of individual nanocrystals in solution (7), with particles becoming visible starting at about 2 nm in diameter.(118) Again, the ability to measure single particles directly in real space provides insights unavailable from bulk measurements. For instance, measurements of large numbers of diffusion events in anisotropic rod-shaped particles have quantified differences in diffusion rates along the long and short axes.(117)
Figure 7.
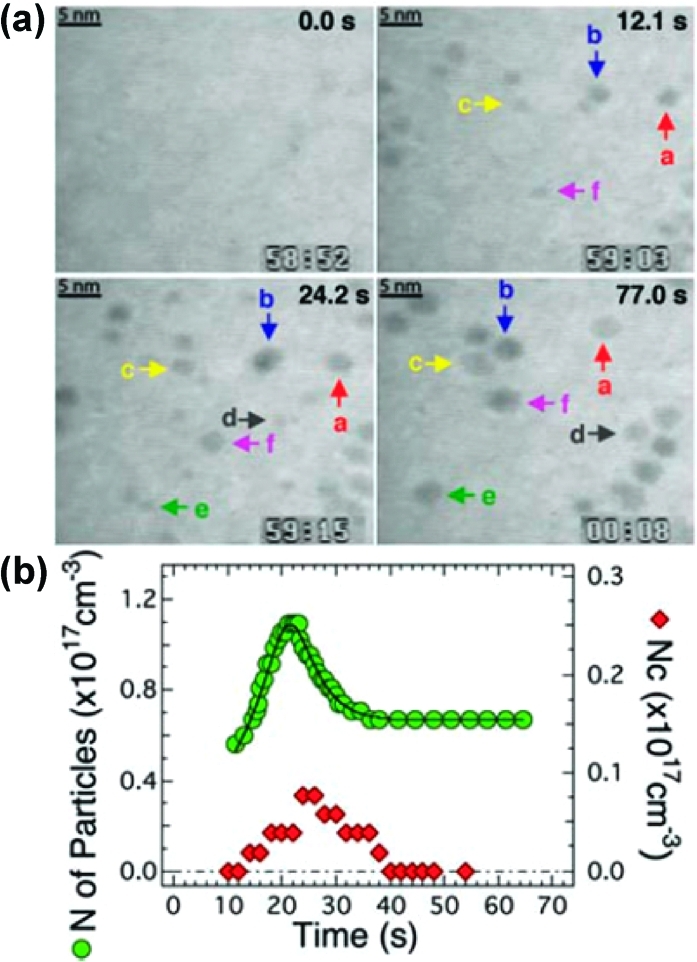
(a) Sequence of liquid TEM images of the growth and coalescence of single platinum nanocrystals. (b) Tracking the number of nanoparticles over time shows an initial growth phase followed by coalescence. Adapted from ref (118).
Conformational Changes: Switching
Molecular switching processes are central to biological activities ranging from vision to muscular contraction; more recently, they have also been studied in the context of nanoscale electronic and mechanical devices.119−121
Since STM can measure both molecular topography and electronic energy levels, the technique has been used to quantify the behavior of both electronic and mechanical molecular switches.(122) Single-molecule switching measurements can also be performed using nanofabricated break junctions;(122) here we focus on STM-based measurements since they also allow investigation of the local environment.52,123
Certain classes of molecules, such as oligo(phenylene ethynylene) (OPE) derivatives41,78,81,124,125 porphyrins,126,127 azobenzenes,(128) naphthalocyanines,(129) and rotaxanes,119,130 undergo conformational switching, which can be monitored by STM, based on changes in either conductance or geometry. In all such measurements, coupling between the molecule and the surface (and STM tip) is an important consideration, as are steric interactions with both the surface and surrounding molecules (especially if measured as part of a larger assembly).
The behavior of populations of single-molecule switches can be quantified through repeated imaging of a single set of molecules to form “stop-action” movies. For instance, Weiss and co-workers measured hundreds of individual OPE molecules bound to a Au{111} surface distributed throughout a monolayer of less conductive alkanethiols. Binning according to their apparent height allows classification into populations—molecules in the “ON” state appear in higher contrast due to both their orientation more normal to the surface and their greater conductance (8). Quantifying the number of ON and OFF molecules makes it possible to measure the response of switches to external factors such as applied electric fields(78) and electrochemical potential,(130) as well as local environmental factors such as SAM order or disorder.(41) The relatively large number of molecules measured also enables tracking of minority populations, for instance, in molecules that perform atomic-scale stepping motions near step-edge defects in the underlying substrate.(81)
Figure 8.

STM imaging of single-molecule switching and diffusion on surfaces. (a) Single oligo(phenylene ethynylene) molecules near step edges in a Au{111} surface exhibit both ON/OFF conductance switching and migration up and down the monatomic step edges. (b) Sequential images of the same molecule show three populations of apparent heights analyzed over time and in histogram form (c). Adapted from ref (81).
Switching of individual molecules oriented parallel to the surface can also be quantified, often with even better spatial resolution.129,130 For example, naphthalocyanine molecules deposited on NaCl bilayers on Cu(111) exhibit two-state current switching when the STM tip is positioned above one end of the molecule (9).(129) Constant−current images of the entire molecule show differences in electron density corresponding to the two tautomers formed by hydrogen shifts. When the STM tip is sequentially positioned at points over a single molecule and the rate of switching at each point is measured based on approximately 100 current switching events, systematic differences are observed across the molecule (9).
Figure 9.

Standard STM geometry used to quantify conductance at many points within a single-molecule switch. (a) Changes in tunneling current observed at a single point due to hydrogen tautomerization in naphthalocyanine on a NaCl bilayer on Cu(111). (b) Schematic of tautomerization. (c) Spatial mapping of switching rate, with each pixel representing approximately 100 switching events. Adapted from ref (129).
Mechanical switches based on azobenzene derivatives have been well-studied at the single-molecule level by STM in both horizontal and vertical configurations and show important differences in switching behavior based on the extent of their coupling to the surface.128,131,132 Under irradiation with UV light, azobenzene undergoes isomerization from its more stable trans state to a less stable cis state. Experiments by Crommie and co-workers have quantified the absorption cross section for the isomerization when the molecules lay flat on a Au{111} substrate; cross sections under both UV and visible radiation are 2.3 × 10⁻²³ cm2, 4 orders of magnitude lower than typical solution cross sections for the same reaction. Unlike the solution reaction, trans-to-cis cross sections were similar to cis-to-trans under blue illumination, suggesting fundamental differences in the reaction process.(133) Further, as shown by Weiss and co-workers, when the aromatic groups are spaced away from the surface through a nonconjugated linker, the dominance of the trans-to-cis isomerization under UV irradiation and cis-to-trans under visible irradiation can again be measured (as in solution).(134)
Rotation
Molecular rotors are central to natural processes, such as the interconversion of chemical and mechanical energy by F1-ATPase.(135) Since such rotors are widely used to perform work in natural systems, they have also been studied in the context of molecular machines.29,136,137 In solution, the action of molecular rotors is typically characterized by NMR, measuring changes in coupling between nuclei in the rotor as their proximities change due to rotation. However, a number of groups, including those of Feringa(138) and Michl,139,140 have begun to perform ensemble studies of molecular rotors bound to surfaces as a means for controlling motion on the molecular scale.
Rotation of individual molecules on surfaces can be visualized by STM, although as with translation, the relatively slow frame rate may make it difficult to measure the rotation rate directly. Single-molecule rotation measurements were first reported by Gimzewski in 1998 for hexa-tert-butyl decacyclene (HBDC), a propeller-shaped conjugated molecule with three-fold symmetry.(141) When surrounded by other HBDC molecules in a lattice, the molecules did not rotate, but if a single molecule shifted slightly within a nanoscopic vacancy in the lattice, it began to rotate faster than the imaging rate of the STM, blurring the three-fold symmetric shape and creating a toroidal image.
As with translation, the energetics of rotation can be quantified by measuring large numbers of rotation events at varying temperatures.(142) Rotation rates faster than the STM frame rate are measured by holding the STM tip stationary over the edge of the molecule, turning off the feedback loop, and monitoring changes in current as the molecule switches between its allowed rotational states. Sykes and co-workers have performed such studies with dibutyl sulfides on Au{111} (10).(143) Below 15 K, each molecule appears as an elliptical protrusion on the surface; above 15 K, the molecule begins to rotate between three equivalent orientations with respect to the Au lattice. The measured energy barrier is on the order of 1 kJ/mol. An automated analysis procedure facilitates quantification and binning of large numbers of state changes.(144)
Figure 10.
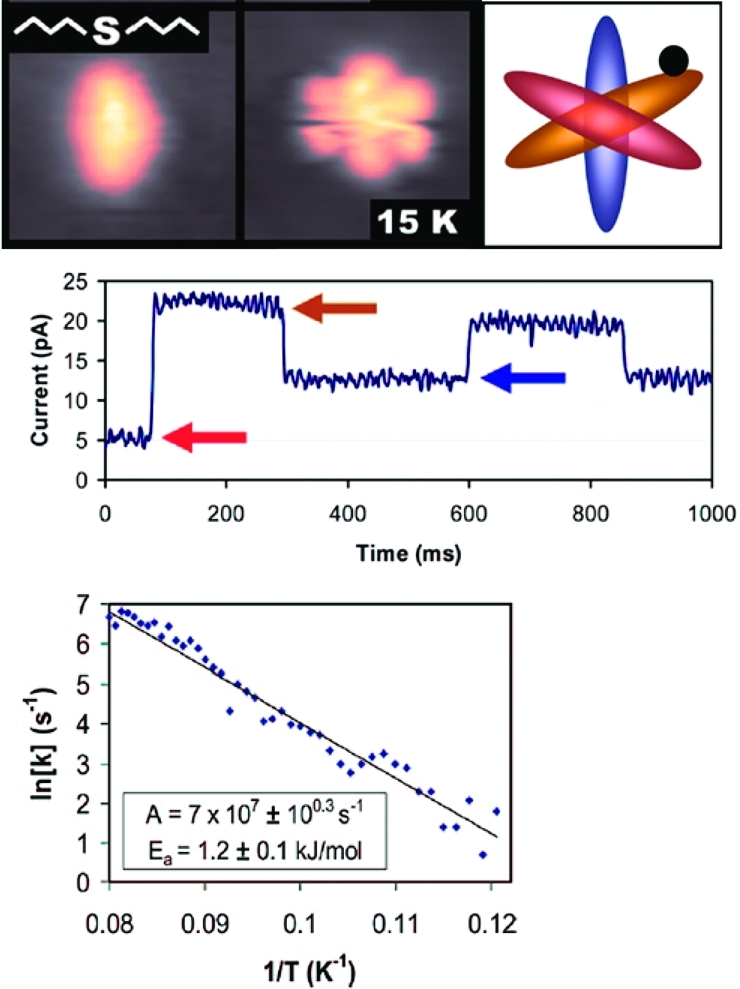
Molecular rotation can be quantified by STM. At temperatures above 15 K, dibutyl sulfide rotates between three equivalent orientations (top right) on a Au{111} surface, appearing as a hexagon (top center). When the STM tip is positioned off-center on the molecule (top right, black dot), changes in the tunneling current can be used to track changes between the three orientations (center). Many such measurements can be combined to calculate rotational energy barriers and pre-exponential factors (bottom). Adapted from ref (143).
Although the use of scanning probes limits image acquisition rates, rotors can be measured in the context of their immediate molecular environment and manipulated on the surface. For instance, rotors can be pushed across the surface using the STM tip, bringing them into proximity with other molecules,143,145,146 which allow them to be controlled in either rack-and-pinion(145) or molecular gear(146) configurations. Electrons from the STM tip can be used to initiate rotation or to increase rotation rates, as demonstrated by Ho and co-workers for O2 on Pt{111}.(142) Inelastic tunneling processes can excite vibrational modes in molecules that also contribute to rotational processes. Ho and co-workers measured this property in acetylene (C2H2) and deuterated acetylene (C2D2) on Cu(100).(147) Inelastic coupling leads to 10-fold and 60-fold increases in rotation rates, respectively, for the two species when tunneling electrons have appropriate potentials (358 and 266 mV) to excite the C−H and C−D vibrations. In some cases, action spectroscopy can be used to understand which vibrational modes contribute to rotation; measurements similar to those in 10 are made at a series of increasing bias voltages, and vibrational and rotational motion events are correlated with bias.(148) Calculations by Joachim and co-workers(149) suggest that single rotating molecules could be used to construct a single-molecule amperometer. Recent calculations by van der Zant and co-workers(137) suggest it may also be possible to actuate a conjugated molecular motor using an external electric field and to measure rotation based on molecular conductance.
Electronic Spectroscopy Measurements
Electron-based methods can be used to perform spectroscopic measurements on single molecules,52,150 including measurements of molecular conductance, vibrational energy levels, electronic polarizability, and spin states.
Conductance
One of the most frequently performed measurements quantifies single-molecule conductance (11).19,32,150−153 Although it has been known for some time that certain classes of molecules can conduct electrons,154,155 measuring the conductance of a single molecule places stringent restrictions on electrode positioning since it requires that opposite ends of the molecule (with typical molecular lengths of ca. 1 nm) bind to two terminals of a macroscopic circuit that can be used to measure current.
Figure 11.

Electronic break junction can be used to quantify the conductance of single molecules. As a gold contact is slowly broken, quantized decreases in conductance are observed, first corresponding to changes in the geometry of the gold contact (a,b), then a set of smaller quantized peaks (c,d) resulting from one, two, or three conductive molecules (here dipyridine) bridging the junction. At slightly larger distances, the junction ceases to exhibit conductance (e,f). Adapted from ref (164).
Although multiple approaches exist,123,150,156−159 the scanning probe geometry is one of the most straightforward experimental means for establishing two-terminal contact with a single molecule with sub-angstrom precision in the spacing between electrodes since the spacing can be varied continuously and dynamically.(32) Of the scanning probe geometries, one of the most widely used is the break junction, in which the scanning probe (STM or AFM) tip is first pressed into the surface and then slowly withdrawn.160−163 As the tip is retracted, the metal junction narrows (11) and then breaks. If the surface is covered with bifunctional (e.g., dithiolated) molecules, the newly formed break junction is often bridged by one or more bifunctional molecules (11), which can then be measured. Since the tip−surface distance can be cycled quickly (on the order of 1 s) and automatically, as demonstrated by Tao and co-workers,(164) facilitating collection of thousands of measurements. When conductances are binned, as shown in 11, a first set of peaks emerges corresponding to multiples of G0 = 2e2/h, the conductance value through a chain of single Au atoms.165,166 If the break junction is bridged by one or more molecules (11), conductance peaks will also be observed at fractions of G0, corresponding to the quantized molecular conductance (11). Measured conductances range from 0.01 G0 for the 4,4′-bipyridine shown to less than 10−4G0 for unconjugated molecules.162,167 Statistical analysis of families of molecules of varying lengths, performed by Venkataraman and co-workers, shows longer conductive plateaus for longer molecules as the junction is broken, suggesting atomic-level shifts in the molecular attachment point prior to breakage.(168)
For some conductance measurements, it is necessary to incorporate a third electrode to act as a gate.(150) In such cases, it is possible to create a molecular junction either mechanically,(169) by breaking nanowires on a surface, similar to the STM break junction described above, or more typically by electromigration,(170) in which high current through a nanowire results in formation of a ∼1 nm gap at the narrowest point in the wire. Since none of the electrodes in this configuration are mobile, it is common to fabricate many devices in parallel to increase the probability of forming devices in which a single molecule bridges the source and drain electrodes. Three-electrode measurements have been used to characterize Coulomb blockade and Kondo effects in single molecules,171,172 which in many cases require the ability to control electronic energy levels on the target molecule using the gate electrode. In the future, larger numbers of atomically precise interconnects may be possible using specially designed instrumentation.(173)
Molecular Vibrations: Inelastic Electron Tunneling Spectroscopy
In addition to tip−sample distance, electron tunneling depends on the electronic structure of the molecule in the tunneling junction,174−176 a property that can be exploited to perform single-molecule spectroscopy.(177) Inelastic electron tunneling spectroscopy (IETS) was originated by Jaklevic and Lambe in 1966 using bulk tunneling junctions38,39 and quantifies modulations in tunneling current with changes in voltage, resulting in peaks characteristic of transitions between molecular vibrational levels. The technique yields information similar to infrared (IR) and Raman vibrational spectroscopies but has evolved sensitivity adequate for measuring single molecules.178,179 Selection rules for single-molecule IETS are not completely understood but appear to involve a propensity for longitudinal modes normal to the surface.176,180
Again, the STM provides a relatively straightforward means of making single-molecule IETS measurements.(147) For instance, Ho and co-workers have measured vibrational levels in CO on Cu(001) and Cu(110),(178) and Persson, Ho, and co-workers have demonstrated the isotopic dependence of vibrational levels in acetylene isotopes C2H2, C2D2, and C2HD on Cu.(179) Adsorbate−surface vibrational modes have been measured by Weiss, Rust, and co-workers, studying benzene on Ag(110).(181) Importantly, the real-space STM measurement allows vibrational energy differences to be correlated with inhomogeneities in the Ag surface. Inelastic tunneling measurements can also be used to distinguish between multiple species on a surface;(182) recent work by Weiss and co-workers has used STM-based IETS to characterize intermediates in an Ullman coupling reaction, a common catalytic reaction between haloaromatic molecules that occurs on Cu surfaces (12).(180) In some cases, photon emission spectra due to inelastic tunneling or the excitation of surface plasmons can also be measured, as shown by Gimzewski and co-workers.183−185
Figure 12.

Inelastic electron tunneling spectroscopy (IETS) measures vibrational energy levels in single molecules. Single-molecule tunneling spectroscopy at low temperatures allows identification of Br and fluorophenyl (F−Ph) intermediates in an Ullman coupling reaction on a Cu{111} surface and measurement of the C−H out-of-plane bending mode in the fluorophenyl group. Adapted from ref (180).
Electronic Polarizability: Microwave STM
Single-molecule polarizability can be measured as a form of chemical contrast in STM imaging. Although polarizability is a contributor to standard, nominally topographic, STM imaging,(186) it is also possible to measure relative single-molecule polarizabilities directly by applying small microwave-frequency (GHz) bias modulation (a few percent of the DC bias) through the STM tip.(187) Such modulations change the electric field across the molecule in the tunneling junction, causing its electron cloud to deform in response to the field. These electronic changes can be measured as small (fA) periodic changes in the tunneling current. Since the polarizability is measured at higher frequencies (5 kHz or higher) than the imaging feedback loop, the two measurements can be made simultaneously, effectively deconvolving polarizability contrast from topography. As shown in 13, conductive single-molecule switches show variable polarizability immediately prior to switching between conductance states.
Figure 13.
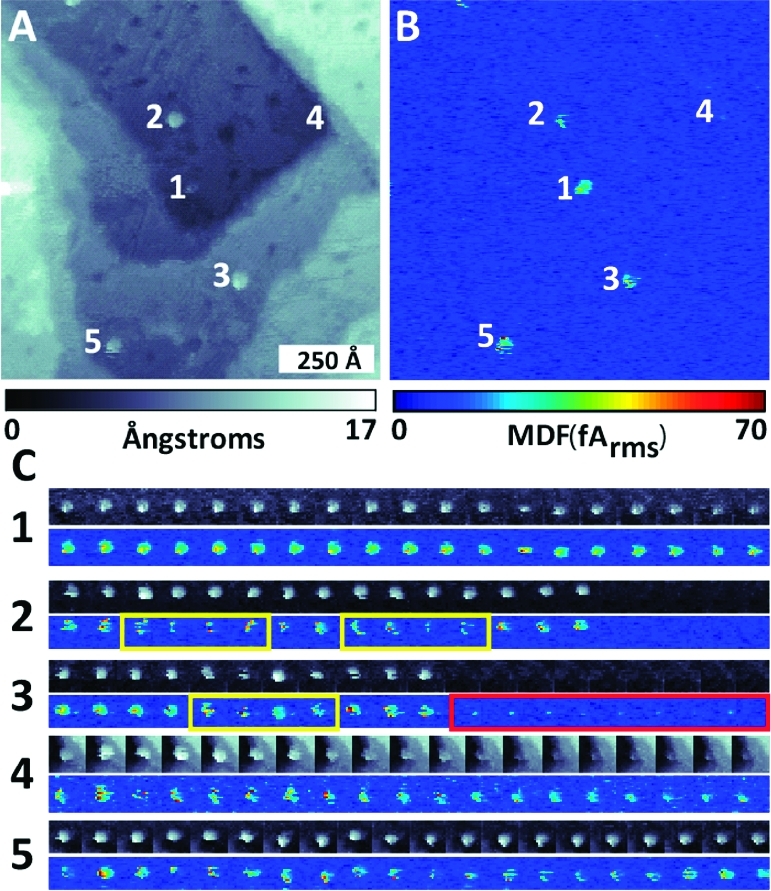
Simultaneously acquired (a) topographic and (b) polarizability STM images of a dodecanethiolate SAM with inserted nitro-functionalized OPE molecular switches. (c) Sequential images (30 s between frames) of individual switch molecules, showing instabilities in microwave polarizability image prior to visible switching in topographic image, and microwave peaks evident after topographic peak disappears. Adapted from ref (187).
Electronic Spin: Electron Spin Resonance STM
Spin spectroscopies, in the form of nuclear magnetic resonance (NMR) and electron spin resonance (ESR), have been integral to the understanding of molecular structure.
Electron spin resonance STM (ESR-STM) utilizes similar principles to detect electronic spins within a single molecule. Conventional ESR techniques require the measurement of a minimum of ∼109−1010 spins in order to obtain a reliable signal.(188) By contrast, ESR-STM takes advantage of the inherently local nature of STM, as well as its sensitivity to the electronic properties of molecules in the tunneling junction, to probe individual spins on single molecules. This technique was first discussed by Manassen and co-workers for single spins on partially oxidized silicon surfaces.189,190 Durkan and Welland later demonstrated the ability to use ESR-STM to detect spin centers on individual α,γ-bisdiphenylene β-phenylallyl (BDPA) molecules.(191) More recently, others have collected ESR-STM spectra on other molecules containing free radicals;192−194 such molecules are extensively studied using conventional ESR and thus make ideal candidates for preliminary ESR-STM measurements.
In ESR-STM, a static magnetic field (100−300 G) is applied normal to the sample surface, using a permanent magnet placed near the sample.(191) The magnetic field causes unpaired spins in the sample to align parallel (and antiparallel) to the axis of the field and to precess around this axis at a constant rate known as the Larmor frequency (for an electron, about 560 MHz at a field strength of 200 G). The precession of the electron spin dipole around the field manifests itself as a small time-varying (AC) current superimposed upon the constant (DC) tunneling current measured by STM, which is measured using a high-sensitivity spectrum analyzer. Signal-to-noise ratios can be improved by using phase-sensitive detection (PSD), which employs an additional, small (∼10 mG), time-varying magnetic field,190,192 to modulate the AC resonance peak. Monitoring the shift in the resonance peak relative to the phase of the time-varying magnetic field improves the measurement sensitivity enabling real-time monitoring of the ESR-STM signal.
Spin-polarized STM (SP-STM), a technique in which a magnetic STM tip is used to polarize the spins of tunneling electrons, can also be used to probe single molecules.(195) Since the tunneling current measured in SP-STM is dependent on the relative spin polarization directions of the sample and tunneling electrons, changes in this current can be used to measure the relaxation times of excited spin states, as demonstrated by Heinrich and co-workers.(196) Weisendanger, Blugel, and co-workers have also recently demonstrated that individual organic molecules containing π-electrons interacting with dz electron orbitals in ferromagnetic surfaces may act to reverse the tunneling current spin polarization.197,198
Photonic Measurements
Similar to electrons, photons can also be used to probe either the physical location or the chemical environment of a molecule of interest (14).8,9,199 In general, this is done by tagging the molecule with either a small-molecule fluorophore or green fluorescent protein (GFP),(43) although other types of labels(200) and nonfluorescence-based measurement strategies201−203 have begun to emerge. Optical labeling works well in water and in three-dimensional samples and provides relatively large fields of view, on the order of hundreds of micrometers, making this an excellent means of performing cellular studies. While long photon wavelengths lead to native spatial resolution on the order of 200 nm, improvements are possible: subdiffraction microscopies can provide better localization,(204) down to tens of nanometers, and FRET-based methods can measure dynamic processes at very short distances, up to about 10 nm.(9)
Figure 14.

Overview of photonic quantification of single-molecule properties. Photonic measurements are typically based on observation of a fluorophore or larger optical probe covalently linked to the target molecule. Longer length scales enable fluorophore locations to be correlated with larger structures such as cells. Short distances (1−100 nm) can also be probed by measuring coupling between two optical labels on a single molecule; such experiments are used for observing conformational changes in proteins and DNA. Orientation changes have been probed using both fluorescence polarization measurements and larger probes. Fluorophores can also be chosen to be sensitive to pH, ion concentrations, or other factors, providing a readout of the local environment around a single molecule.
A fluorescent probe absorbs photons and re-emits them at a longer wavelength; the characteristics of this process are important for quantitative optical measurements. Usually it is desirable for a fluorescent marker to have a relatively broad absorption spectrum and a narrow emission peak, simplifying detection. Although high quantum efficiencies for re-emission of absorbed photons are also desirable, the range of efficiencies in commonly used dyes is large: from 4% for Cy3(205) to near 100% for rhodamine.(206) Short excited-state lifetimes (on the order of nanoseconds) enable fast measurements, especially important when the target is subject to diffusion; fluorescence lifetime can also be used to discriminate between fluorophores.(199) Fluorophore excited states are susceptible to photobleaching reactions, which permanently turn off fluorescence; the average number of excitations prior to photobleaching can vary from less than 10 to over 1 000 000,(207) depending on both fluorophore structure and local chemical environment. In some cases, it is possible to amplify the fluorescence signal by creating multiple fluorophore binding sites at the target.(208) Fluorophores can also be chosen to be sensitive to pH, calcium ion concentration, or other properties, to provide a probe of the local chemical environment of the target.(43)
Other structural properties of probes are also significant. For instance, the length and rigidity of the linker connecting the fluorophore to the target is integral for fluorescence polarization and FRET measurements, in which the placement and orientation of the dye relative to the target impact quantification. Although most fluorophores are small molecules with extended π-conjugated systems, inorganic nanocrystals can also be used as fluorescent probes. Inorganic quantum dots are generally quite large (2−20 nm, including surface ligands and linkers) relative to small-molecule fluorophores (∼1 nm) but also exhibit greater brightness, longer excited-state lifetimes, and increased photostability, all of which can facilitate measurements.(200)
Photonic Imaging: Position and Structure
Diffraction-Limited Microscopy and Centroid Tracking
Although features in diffraction-limited optical microscopy are typically hundreds of nanometers in diameter, it is often possible to determine the centroid of a feature with 1 nm precision and to track its motion. Such analysis is possible either using a micrometer-scale bead that emits or scatters light or by collecting thousands of photons emitted by a single fluorophore.
Early measurements by Sheetz and co-workers used this principle to make video-rate observations of kinesin motor proteins bound to plastic beads as they moved along microtubules(209) and to monitor the motion of membrane-bound glycoproteins attached to 40 nm gold particles.(210) Others have also taken advantage of large nanoparticles and other labels to observe single-molecule motion, since such labels permit faster imaging.(211) However, care must be taken to ensure that the dynamics of the large probe (for scale, a 40 nm gold particle is approximately 500 times the volume of a 5 nm globular protein) do not interfere with those being observed in the target.
Later measurements by Selvin and co-workers used the point spread function (PSF) of photons emitted from a single organic fluorophore to perform fluorescence imaging with 1 nm accuracy (FIONA).(212) Such measurements require bright and stable emitters to allow collection of sufficient photons per molecule; oxygen-scavenging enzymes and reducing agents were used, increasing the number of detected photons per molecule by an order of magnitude, from 105 to 106. A typical measurement comprises on the order of 100 frames of 0.5 s, each collecting 104 photons. This concept has enabled numerous studies of molecular motors including myosin and kinesin, where step sizes of 1−100 nm must be resolved.
The use of GFP and spectrally distinct analogues such as yellow fluorescent protein (YFP) facilitates measurements in cells. Three-dimensional protein motion in the cellular environment complicates measurements; however, many proteins bind to larger cellular structures, restricting their motion. 15 shows measurements of bacterial actin MreB proteins labeled with YFP performed by Moerner and co-workers.(213) Xie and co-workers have also tracked the activity of membrane-bound YFP fusion proteins.(23)
Figure 15.

Diffraction-limited single-molecule imaging. Directed motion of motility protein MreB labeled with YFP is tracked in live cells. (a) Three YFP-labeled MreB proteins (arrows) in a bacterial cell (white outline). (b) Smoothed image. (c) Time-lapse trajectory of center fluorophore from (a). (d) Top and bottom fluorophores from (a) are stationary over the period of measurement and appear as bright spots in a time-averaged image. (e) Distribution of diffusion coefficients for MreB proteins shows the impact of adding A22, a small-molecule inhibitor of MreB function. Adapted from ref (213).
Although most measurements to date are based on a 2D Gaussian PSF that localizes emitters in the X−Y plane, it is also possible to incorporate nonstandard optics to create other types of PSF that yield additional spatial information. Moerner and co-workers have recently demonstrated single-fluorophore measurements using a double-helical PSF that provides a readout of the Z position of the emitter.(22)
Subdiffraction Microscopy: STED, SI, NSOM, FCS, PALM, STORM
Although centroid tracking and PSF analysis reduce the uncertainty in the location of a single emitter by compiling the locations of enough emitted photons, problems arise when target concentrations are high enough that the excitation volume includes multiple emitters. Two routes to circumvent this problem are to decrease the excitation volume or to decrease the number of emitters.
Limiting the excitation volume reduces the size of the PSF. Stimulated emission depletion (STED) microscopy, developed by Hell and Wichtman in 1994,(214) decreases the observed sample volume by first exciting a diffraction-limited spot, then using a second phase-modulated beam to deplete the excited states in a ring around the edge of the excited spot (16). Molecules in the center of the spot (diameter ca. 20 nm) remain excited and can be observed. STED imaging requires scanning of either beam or sample, with dwell times of 3−8 ms per 10 nm pixel.(215)16 shows a comparison of diffraction-limited confocal imaging and STED imaging of single Synaptotagmin I molecules on the surface of endosomes.(215)
Figure 16.

Examples of subdiffraction-limited single-molecule optical imaging. (a) Stimulated emission depletion (STED) imaging first excites fluorophores in a diffraction-limited spot (blue), then depletes the excited states in a ring (orange) around the edge of the spot, yielding an effective point spread function (PSF) on the order of 20 nm. The difference between the 200 nm diffraction-limited spot size and 20 nm effective PSF is shown for Synaptotagmin I molecules on endosomes. (b) Stochastic optical reconstruction microscopy (STORM) photoactivates small numbers of probes at a time, allowing each probe to be localized to a spot on the order of 20 nm. Adapted from refs (215) and (225).
Another route to limiting the excitation volume is the structured illumination (SI) scheme developed by Gustafsson,(216) in which interference between two laser beams creates nonlinear illumination patterns on the sample with line widths below the diffraction limit. In contrast to STED, SI provides excitation across the entire sample, rather than in a single spot.
Finally, near-field illumination can be used, as in near-field scanning optical microscopy (NSOM or SNOM),(217) creating spot sizes of 10−100 nm using either a nanoscale aperture or evanescent waves scattered by a scanning probe.(218) The scanning probe illumination is both a limitation and an advantage since it limits photon throughput and confines analysis to surfaces but also enables simultaneous topographic measurements.(219)
If the excitation spot is held in place rather than rastered, the diffusion of single molecules across the excitation volume can be measured using fluorescence correlation spectroscopy (FCS). This principle has recently been used to quantify the diffusion of single phospholipids in a lipid bilayer. In particular, differences are observed in the single-molecule diffusion of different classes of lipids, suggesting that certain classes may be transiently trapped in small (∼20 nm) cholesterol-mediated complexes, or lipid rafts, for periods on the order of 10 ms.220,221
Another class of subdiffraction microscopy techniques relies on selective photoactivation of fluorescent labels (16). These methods include photoactivated localization microscopy (PALM), developed by Betzig, Hess, and their co-workers,222,223 and stochastic optical reconstruction microscopy (STORM), developed by Zhuang and co-workers.(224)
Iterative photoactivation allows multiple closely spaced emitters to be resolved. In both PALM and STORM, irradiation at one wavelength causes random activation of a small number of fluorescent labels, distributed broadly enough that their emission spots are unlikely to overlap. Activated fluorophores are then irradiated at a second wavelength, and enough emitted photons are collected to localize each fluorophore to a subdiffraction spot, typically 20 nm or smaller. Further irradiation causes photobleaching of active fluorophores, and finally, irradiation at the first wavelength activates another set of fluorophores. The ability to photoactivate the fluorophore is key: two classes of emitters used to date are photoactivatable GFP or other proteins222,223 and dye pairs such as Cy3/Cy5.(225) The ability to resolve two closely spaced emitters can be calibrated by functionalizing a DNA double helix with multiple emitters at known spacings, based on the 0.34 nm/base DNA helix structure, as demonstrated by Zhuang and co-workers.(224) The technique is sufficiently nondestructive to study nanoscopic structures in live cells, for instance, cellular adhesion complexes imaged by Betzig and co-workers(226) and clathrin-coated pits imaged by Zhuang and co-workers.(227)
Due to the iterative nature of the activation and bleaching process, building up an image that reflects the locations of many emitters with high precision can take several minutes. However, it is also possible to study dynamic processes by activating a small set of emitters, tracking their motion, and then activating new emitters. This approach has recently been used by Lippincott-Schwartz and co-workers to map trajectories and calculate diffusion coefficients of proteins in a lipid bilayer for up to 50 molecules per μm2.(228)
Photonic Measurement of Motion
Conformational Changes: FRET
While subdiffraction microscopy methods allow localization of fluorescent emitters to spots with diameters on the order of tens of nanometers, much smaller length scales can be probed by measuring the coupling between two closely spaced emitters or scatterers. Again, complementary approaches exist, one based on coupling between (usually small-molecule) fluorophores9,24 the other on plasmon coupling between noble metal nanoparticles with diameters greater than 20 nm.229,230 For comparison, electron tunneling operates up to a few nanometers,(231) fluorophore coupling (Förster resonant energy transfer, FRET) operates from 1−10 nm,(11) and plasmon coupling up to a few tens of nanometers.(232)
Measurements of FRET efficiency have long been used at the ensemble level to monitor conformational changes of molecules in solution.(233) The target molecule is functionalized with both donor and acceptor fluorophores, such that the emission peak of the donor and the excitation peak of the acceptor overlap. The sample is irradiated at the absorption wavelength of the donor, and the emission wavelengths of both donor and acceptor are monitored to quantify the efficiency of energy transfer to the acceptor and hence the donor−acceptor distance. Quantitative measurements of distance based on FRET are complicated by a variety of experimental factors, including different excitation and detection efficiencies for the donor and acceptor dyes and differences in transfer efficiency based on fluorophore orientation and chemical environment. However, FRET provides a useful and straightforward measurement for cases in which the main objective is to distinguish between two molecular states with different donor−acceptor distances.
The same principles can provide even more information when applied at the single-molecule level since it is also possible to observe the dynamics of switching between two molecular states.10,24,37 For example, Weiss and co-workers have used single-molecule FRET to observe dynamics of single proteins on millisecond time scales, using an alternating laser excitation (ALEX) instrumental scheme that allows singly labeled (donor-only and acceptor-only) molecules to be distinguished from the two double-labeled states (17). Protein targets observed include chymotrypsin inhibitor II (CI2),(235) cold shock protein (CSP),(236) RNase H,(237) and LacY.(238)
Figure 17.

FRET between two fluorophores on a single molecule can act as a ruler for the distance between the fluorophores. (a) Emission intensities vs time for target molecules irradiated at the donor wavelength: in-range donor−acceptor, out-of-range donor−acceptor, donor-only, and acceptor-only. (b) Emission intensities for same molecules irradiated at acceptor wavelength. (c) Switching between irradiation at donor and acceptor wavelengths at short time scales allows binning of four populations of molecules in a two-dimensional histogram based on FRET efficiency (E) and donor−acceptor stoichiometry (S), where S(D-only) = 1, S(A-only) = 0, S(D−A) = 0.5. The three histograms at the right show the shift in the D−A peak of double-labeled DNA molecules, as the distance between the fluorophores is increased. Adapted from ref (234).
Conformational Changes: Plasmon Shift
While FRET can provide a ruler for distance changes up to about 10 nm, other biological processes of interest occur with dynamics on length scales greater than 10 nm but smaller than can routinely be measured by super-resolution microscopy. Plasmon coupling between noble metal nanoparticles can act as a ruler for conformational changes in such cases, up to approximately the diameter of the nanoparticle (>20 nm). Plasmon resonance is a collective oscillation of conduction band electrons that occurs with peak wavelengths that depend on the size, shape, and material composition of the nanoparticle. The moving electrons create an oscillating dipole that can couple with dipoles in other nearby nanoparticles. 18 shows spectral shifts to longer wavelengths characteristic of coupling between pairs of Au and Ag nanoparticles 40 nm in diameter;(229) much larger shifts are observed for Ag, but experimentally, Au is often used because it is easier to functionalize and to work with in solution. Plasmon coupling has been used to measure the bending and cleavage of a single DNA molecule by EcoRV on a millisecond time scale (18),(230) as well as single-peptide cleavage events in living cells.(239)
Figure 18.

(a) Plasmon coupling between individual pairs of Au and Ag nanoparticles causes a spectral shift visible by dark-field microscopy. (b) Plasmon coupling can be used as a ruler for distance changes above 10 nm; here, it is used to measure the bending and cleavage of single DNA molecules by the enzyme EcoRV. (c) Intensity trace vs time shows the initial straight configuration, the high-intensity bent state, and the low-intensity cleaved state. (d) Bending kinetics are measured by pooling data from many events. Adapted from refs (229) and (230).
Rotation: Fluorescence Polarization and Other Methods
Two primary optical strategies have been used to quantify rotation at the single-molecule level. In one, a single fluorophore is attached rigidly to the molecule of interest, and changes in fluorescence polarization are measured to track rotation of the target. In the other, a large (>100 nm), fluorescently labeled object is attached, and the rotation of the larger object is observed using traditional optical microscopy. Such measurements have primarily been used to study the motion of molecular rotors such as F1-ATPase, DNA enzymes, and motor proteins such as myosin and kinesin.
Fluorescence polarization measurements can be used to quantify the rotational orientation of a single molecule for rotations that occur on the millisecond time scale.44,240−242 In such measurements, the polarization of the illuminating beam is controlled, and the corresponding intensity of emission is monitored. Since the probability of photon absorption is greatest when its excitation dipole moment is aligned with the electric field vector of the illuminating beam, this can be used as a readout of the orientation of the fluorophore. To ensure that the orientation of the dye does not fluctuate independently of the target, bifunctional dyes that attach to the target at two points may be used.
Single-molecule fluorescence polarization has been used to measure rocking motions in both kinesin(243) and myosin(244) molecular motors. Goldstein, Moerner, and co-workers examined the rocking mechanism of kinesin bound to microtubules in the presence of ADP and AMP (19).(243)19 shows fluorescence polarization measurements of microtubules bound to large numbers of fluorescently labeled kinesin molecules. In the presence of AMP, kinesin is held rigidly against the microtubule, resulting in differences in the observed fluorescence when the sample is illuminated with light polarized in the two directions shown. In the presence of ADP, kinesin rocks, resulting in similar fluorescence under both polarizations. At the single-molecule level (19), this effect is evident as large differences in the fluorescence of a single AMP-bound kinesin molecule when the polarization angle is varied from 0 to 135°. Combining large numbers of such measurements enables relative immobilities to be calculated for AMP- and ADP-bound kinesin.
Figure 19.

Fluorescence polarization measurements of kinesin rocking motion when bound to a microtubule. (b) Microtubules decorated with many fluorescently labeled kinesin fragments exhibit fluorescence anisotropy when kinesin is bound to AMP, but not when bound to ADP. (c) Single-molecule measurements show fluorescence anisotropy of AMP-bound kinesin taken at four different polarization angles. These measurements can be translated into immobility factors, showing that AMP-bound kinesin molecules are held rigid, while ADP-bound kinesin has high rotational mobility. Adapted from ref (243).
Another strategy for measuring molecular rotation using fluorescence involves tagging with an anisotropic optical probe large enough to be observed using traditional optical microscopy. Kinosita and co-workers observed the rotation of F1-ATPase, a key protein in cellular energy storage and release, by attaching a fluorescent actin filament to the γ subunit of the motor.(245) Rotation was found to occur in a series of 120° steps, and the hydrodynamic drag on actin filaments of varying lengths (from 1 to 4 μm) was correlated with the protein rotation rate to calculate the work done by the motor during rotation; the calculated value of 80 pN·nm is close to the free energy of hydrolysis of ATP.(135) Similar stepping behavior was also observed in the absence of the frictional load using a single-fluorophore assay.(246) Large anisotropic optical probes have also been used by Block and co-workers to track rotations in the stepping of kinesin, as shown in 20.(247) In the kinesin assay, a 1.3 μm polystyrene bead functionalized with two smaller fluorescent beads was attached to an individual kinesin motor through an antibody linker (20). When kinesin molecules modified in this way were allowed to bind surface-bound microtubules, different rotational behavior was observed in a kinesin variant in which only one head was bound to the microtubule in comparison with a variant in which both heads could bind (20).
Figure 20.

(a) Large optical probe measures rotation of kinesin proteins bound to microtubules. A 1.3 μm polystyrene bead bound to two smaller fluorescent beads is attached to the kinesin protein via a linker. Optical microscopy can distinguish changes in orientation of the two fluorescent beads. (b) Tracking angular rotation over time shows differences between two kinesin variants. (c) Variance in each single-molecule trace can be compiled to assess population behavior; the K351 variant exhibits a linear increase in variance, while the K448 variance can be fit asymptotically. Adapted from ref (247).
Photonic Spectroscopic Measurements
Molecular Vibrations: SM-SERS
Raman spectroscopy measures vibrational and other low-energy transitions in molecules.(248) The sample is illuminated at a known wavelength, and the wavelengths of inelastically scattered photons are measured; the Raman shift in photon energy correlates with molecular transition energies. Since Raman scattering is weak relative to elastic Rayleigh scattering, high-sensitivity measurements rely on experimental conditions under which scattering is enhanced. Surface-enhanced Raman spectroscopy (SERS) is performed when the molecule is on a rough noble metal surface or nanoparticle,249,250 while tip-enhanced Raman spectroscopy (TERS)(251) uses a noble metal scanning probe tip to increase field-based scattering at the target molecule.
The mechanism for Raman scattering enhancement has been widely discussed and is believed to arise from both electric field enhancements of up to 1011 due to local plasmon resonance in the metal and chemical enhancements due to electrostatic interactions between the molecule and the surface.(252) Field enhancements sufficient for single-molecule detection on nanocrystals are generally agreed to occur at “hot spots” on the order of 1 nm between two or more nanoparticles,253,254 placing restrictions on sample preparation. Detection is further complicated by the fact that the magnitude and the frequency of the spectral peaks can vary substantially for a single molecule.
Enhanced Raman scattering is remarkable for its ability to provide chemical information with single-molecule sensitivity at room temperature. Single-molecule SERS measurements were first reported by Nie(255) and Kneipp(256) in 1997 for the dye molecules rhodamine 6G (R6G) and crystal violet on Ag nanocrystals. Later, van Duyne and co-workers were able to distinguish spectral differences between individual molecules of R6G and a deuterated analogue R6G-d4.(257) A variety of other small molecules have also been explored by SM-SERS.(252) Single-molecule TERS typically produces smaller scattering enhancement factors (106−107), but has the advantage of allowing specific molecules to be targeted.(251) This is particularly advantageous for larger molecules such as proteins since it allows specific parts of the molecule to be analyzed, although in most cases, interpreting spectra remains a challenge. Initial targets have included single RNA molecules(258) and cytochrome c proteins.(259)
Chemical Environment: Responsive Fluorophores
The fluorescence of small-molecule, protein, and nanoparticle fluorophores can be modulated by the local chemical environment, including pH, halide and other ion concentrations, redox potential, and voltage.43,200,260 These properties can be leveraged for single-molecule environmental sensing. For instance, cameleon constructs have been designed based on two GFP protein variants linked by a Ca2+ binding peptide. When Ca2+ binds to the linker, the two fluorescent proteins are drawn closer together, and the FRET efficiency between them increases; measuring the ratio of donor and acceptor emission provides a metric for Ca2+ binding.(261) Conformational changes at shorter (0.1 nm) length scales have also been monitored in single molecules using electron-transfer-based quenching of fluorophores.262,263
Electronic and Nuclear Spin: Nitrogen Vacancies in Diamond
Certain types of single spins can be detected optically, a property that may ultimately be used to understand single-molecule structures. Early optical single-spin detection was performed at cryogenic temperatures using single pentacene molecules embedded in p-terphenyl host crystals.264,265 More recently, nitrogen vacancy (NV) defects in diamond have enabled optical single-spin detection at room temperature,(266) which is being investigated for both quantum computing and as a detection method for single-molecule structure determination.
Nitrogen vacancy defects in diamond have photon scattering cross sections that differ by approximately 30% based on their spin state.(266) A confocal microscope can be used to locate a single defect in either bulk diamond or a diamond nanocrystal and track its photon scattering over time, providing a readout of the spin state. Such systems are good quantum computing candidates since it is possible to pump spins to a known state optically and because the spins can be manipulated quickly (∼10 ns) and have relatively long coherence times (up to 0.3 ms), making it possible to perform relatively large numbers of operations (∼104).(267)
As with NMR, the NV spin can couple with local magnetic fields from surrounding 13C nuclei,(268) which split its degenerate spin states ms = ±1, decreasing spin coherence times. However, such coupling can also be used to advantage since nuclear spins have longer coherence times. For instance, coupling with nuclear spins has been used both to allow multiple reads of the electron spin state(269) and to read out nuclear spins.(270)
More broadly, the ability of the nitrogen electron spin to make sensitive measurements of local magnetic fields opens the possibility of performing single-molecule structure measurements similar to NMR.34,271 Fields as small as 3 nT can be detected in this way by using long averaging times (100 s) and spin echo pulsing tailored to decouple the NV spin from nearby 13C nuclei;(34) this is roughly equivalent to the field produced by a nuclear spin at a distance of 10 nm. Magnetic scanning probes can also be incorporated to localize the single spin in space with nanometer-scale resolution.(271)
Force-Based Measurements
Many single molecules generate or respond to force in a way that illuminates important physical properties (21). At the most basic level, attractive or repulsive interactions between a molecule on a surface and an AFM tip can be used to measure molecular shape.(272) More complex examples include measuring the stiffness of a DNA double helix, the amount of force required to induce protein unfolding,(273) or the force generated by each step of kinesin, F1-ATPase, or other molecular motors.(45)
Figure 21.

Force-based measurements of single molecules. In atomic force microscopy (AFM), a scanning probe can be used to image surface topography, motion of single molecules, and surface functionality. In another class of measurements, the force probe is instead bound to the target molecule; in such measurements, both molecular motion and the associated forces can be quantified.
Force-Based Imaging: Position and Structure
Topography: Amplitude- and Frequency-Shift Atomic Force Microscopy
Atomic force microscopy, another variant of scanning probe microscopy, is often used to measure the topography of surfaces. In standard AFM measurements, a cantilever ending in a pointed tip with a radius of curvature on the order of 10 nm is rastered across a surface. In contact mode, the cantilever touches the surface, while in noncontact mode, the tip is vibrated near the surface, and changes in the resonance amplitude are used to detect the proximity of the surface. The relatively blunt tip restricts the applications of standard-usage AFMs in single-molecule imaging: although vertical resolutions on the order of 0.1 nm are common, lateral resolutions are generally on the order of a few nanometers.
However, much higher resolution can be achieved by performing measurements in noncontact mode and quantifying frequency shifts in the resonance damping signal of the oscillating cantilever due to repulsive or attractive forces between the tip and the surface. This property has been exploited in a number of contexts.
For instance, Sugimoto and Custance were able to identify individual surface atoms of Sn, Pb, and Si in a thin layer of alloy with a complex structure.(274) Spectroscopic information can also be derived: Wiesendanger and co-workers have measured molecular vibrations in single metallofullerenes inside carbon nanotubes,(275) similar to the IETS measurements discussed in the section on electron-based measurements.
Combining frequency shift detection with tip modification techniques enables even higher resolution. Using a tip modified with a CO molecule, Gross and co-workers have resolved the placement of each atom in a single planar aromatic pentacene molecule on a surface (22) in ultrahigh vacuum at 5 K.(28)
Figure 22.

(a) Ball-and-stick model of pentacene molecule. (b) Frequency-shift AFM measurement of pentacene on Cu{111} with a single CO molecule adsorbed to the tip. Adapted from ref (28).
Chemical Functionality: Topographic and Recognition Atomic Force Microscopy
Other tip modification and nonstandard data acquisition strategies have been used at room temperature in solution to map biomolecular recognition at the single-molecule level. Tip modification has been used to measure recognition events including DNA hybridization, antibody−antigen, ligand−receptor, and lectin−carbohydrate interactions.276,277 Dynamic recognition imaging creates simultaneous topography and recognition images based on the minima and maxima of an oscillating low-Q (∼1) cantilever functionalized with ligands (23).(278) Interactions between ligands on the cantilever and receptors on the surface restrict the maximum deflection, creating an apparent depression at the recognition site.
Figure 23.

(a) Schematic for simultaneous topographic and recognition imaging using TREC-AFM. (b) Topographic image of avidin electrostatically adsorbed to mica and imaged with a biotin-functionalized tip. (c) Simultaneously acquired recognition image, with areas of low intensity corresponding to locations of avidin molecules (examples circled). Adapted from ref (278).
Force-Based Measurements of Motion
Translation: Optical Trapping and Clamping
Force-based probes may be used to measure translational motion, either quantifying the forces required for motion or improving the precision of distance measurements by increasing molecular stiffness. Such experiments span the range of subnanometer manipulation of single atoms on surfaces under vacuum at cryogenic temperatures to measurements of multimicrometer biomolecules in solution at room temperature.
Optical tweezers26,279,280 can be used to measure and to control the position of a molecule tethered to the trapped particle, applying forces up to 100 pN and achieving spatial resolution better than 1 nm. In this technique, a laser is focused through a high numerical aperture (NA) objective lens, creating a strong gradient in the intensity of the light around the focal point. Dielectric particles in the focused beam experience a force directed toward the focal point, acting to trap the particle near this region. The force is proportional to their distance from the focus and the magnitude of the optical gradient, which depends upon both NA and laser power. For particles much smaller than the wavelength of the trapping light, the restoring force arises due to the polarization of the dielectric material by the optical beam’s electric field. The dielectric particles are drawn to areas of high field strength, which are found along the central axis of the laser beam and the focal point. Particles larger than the wavelength of the trapping light refract the light and experience a “recoil” force associated with redirecting the momentum of the photons, which pushes them toward the focus. To avoid photodamage to biological samples at high irradiation intensities, a laser in the near-IR (800−1000 nm) is usually chosen. The position of the bead can be measured with resolution better than 1 nm, at 10−100 kHz bandwidths, by monitoring diffraction between photons scattered by the bead and unscattered photons. This technique has been applied to a wide variety of problems, ranging from trapping micrometer-scale beads to studying nanometer-scale motion of biomolecules, to trapping individual atoms at cryogenic temperatures.
For instance, an optical force clamp system developed by Block and co-workers(281) has been used to study the motion of kinesin motor proteins as they walk along microtubules (24). A large (500 nm) light-scattering bead is first attached to the target kinesin protein, which is then allowed to bind to a microtubule; finally, the bead is engaged in an optical trap. Since the force on the bead (and therefore the target) is proportional to its displacement from the center of the trap, a constant load can be maintained by using a feedback loop to maintain a constant bead displacement within the trap. This method can provide subnanometer positional accuracy with the feedback loop operating at rates on the order of 10 kHz and can be combined with single-molecule fluorescence with appropriate laser and other instrumental choices.282,283 The ability to acquire large numbers of high-precision step-length measurements under load results in sufficient resolution to distinguish between two hypothesized mechanisms of kinesin stepping that would result in either all 8 nm or alternating 7 and 9 nm steps; hundreds of pooled step measurements show a single peak at 8 nm (24). Similar strategies have been used to examine other systems with small load-associated translational motions, such as the unzipping of a DNA double helix,(283) and dual-trap systems (see below) have been used to quantify translational motion as small as a single RNA base pair (0.34 nm).(284)
Figure 24.

(a) Kinesin motor proteins have two heads that bind to a microtubule repeatedly as the kinesin walks down the microtubule. Different walking mechanisms are possible, resulting in either all 8 nm steps or alternating 7 and 9 nm steps as shown. (b,c) Measuring a large number of individual steps using an optical force clamp makes it possible to distinguish that kinesin takes all 8 nm steps rather than alternating 7 and 9 nm steps. Adapted from refs (281) and (285).
Optical trapping may also be used to confine objects as small as atoms and to create trap arrays. For instance, Weiss and co-workers have demonstrated the ability to trap hundreds of individual cesium atoms in a 3D optical lattice.(286) Using three pairs of overlapping laser beams, crossing at a shallow angle, a 3D array of interference maxima and minima was constructed, forming a simple cubic lattice with each site separated by several micrometers. Individual atoms may be trapped in such an arrangement by turning on the optical lattice around a cold, magneto-optically trapped gas. The atoms are drawn toward areas of low potential and are thus located near interference minima. The large separation distances between adjacent lattice sites enable optical addressing of individual atoms using a shallow depth of focus lens such that only a single plane of atoms is in focus at a time. Trapped atoms could act as bits in a quantum computer; more broadly, the 3D optical lattice could be used to introduce parallelism into trapping experiments with larger particles.
Translation: Electric-Field-Based Translation through a Nanopore
Properties of single molecules can also be inferred by causing them to pass through a nanometer-scale pore in a membrane small enough to allow passage of only one molecule at a time. Such measurements originated in the 1970s with patch clamp experiments on ion channel proteins in cell membranes. In these experiments, a glass micropipet was used to isolate a micrometer patch of the cell membrane, ideally containing a single ion channel. Ionic currents on the order of picoamperes could then be recorded at kilohertz frequencies to measure on/off switching of the ion channel at millisecond time scales.16,287
More recently, this concept has been extended to include other types of membrane-embedded nanopores,(17) including natural pores such as α-hemolysin proteins,288−290 synthetically fabricated solid-state pores,291,292 and carbon nanotubes.(293) Such experiments predominantly use pores a few nanometers in diameter and use a small electrical potential (∼0.1 V) to drive single DNA molecules through the pore based on their negative charge. This approach has been used to discriminate DNA length and in some cases even the type of DNA bases based on transit time and is beginning to be explored as a single-molecule DNA sequencing tool.(294) Experiments using varying voltage have also been used as a way to apply controlled forces to a DNA hairpin structure to quantify unzipping forces (25)(295) and to control and measure the activity of single DNA polymerases.(290)
Figure 25.

(a,b) DNA passing through an α-hemolysin nanopore. A self-complementary hairpin in the DNA prevents it from passing completely through the pore until sufficient voltage is applied. (c,d) Current readout showing ionic current drop when DNA blocks nanopore, and voltage (force) required to unzip the hairpin and complete the transit. Adapted from ref (295).
Conformational Changes: Atomic Force Microscopy and Magnetic and Optical Traps
Force-based probes provide the ability to measure simultaneously both nanometer-scale position changes in the probe and the magnitude of forces being exerted on or by the probe.(296) This tandem capability is important in measuring the energetics of nanoscale motion, again ranging from subnanometer shifts of single atoms on surfaces to conformational changes of multimicrometer biomolecules.
Forces required to manipulate atoms and molecules on a surface can be measured using frequency-shift AFM measurements, as by Heinrich and co-workers, who found that tip-induced motion of CO on Cu{111} requires over 150 pN lateral force, an order of magnitude greater than the force required to manipulate a Co atom on the same surface;(297) in contrast, both CO and Co on Cu(211) can be manipulated under comparable tunneling conductance conditions in the STM.(298)
Measurements of conformational changes in biomolecules typically require that the molecule be tethered to two different objects, at least one of which can be moved controllably. Examples of mobile probes include AFM tips, microscopic beads that can be engaged in optical traps, and microscopic magnetic beads that can be controlled by external magnetic fields. Such mechanical measurements provide important insights for a variety of biomolecular machines and structural proteins, which must either pull or resist pulling.
Early demonstrations included AFM- and optical-trap-based measurements (26) of forces required to unfold subunits of titin muscular proteins (unfolding begins at 20−30 pN and finishes at 150−300 pN for each subunit)15,299 and cytoskeletal spectrin proteins (completing at ∼25−35 pN).(300) More recently, other measurements have included dual optical trap measurements of the forces (∼14 pN) required to unfold a single RNA hairpin (27).(301)
Figure 26.

(a) AFM pulling on single titin Ig proteins. (b) Each peak in the force−distance curve corresponds to unfolding of a single titin repeat unit. Adapted from ref (15).
Figure 27.

Reversible unfolding of single RNA hairpins pulled between two light-scattering 2 μm beads. (a) RNA hairpins are attached to beads through 500 bp hybridized RNA/DNA handles. (b) Force vs extension curves show differences in extension behavior for RNA/DNA handles with (black) and without (red) a hairpin loop sequence. (c) Average unfolding force calculated based on 36 sequential unfolding/refolding events in a single molecule. (d) Length vs time traces at constant forces show hopping between folded and unfolded states at forces from 14.0−14.6 pN. (e) Calculation of unfolding equilibrium constant based on applied force. Adapted from ref (301).
A number of factors are critical in measuring such forces correctly.(276) The chemistry (nonspecific vs thiol or other covalent attachment) used to tether the biomolecule to the probe and the surface can be key to ensuring reproducible measurements. Nonspecific adsorption is more straightforward in terms of sample preparation but may require screening of measured force curves to reject curves with unsuitable binding. The rate at which the pulling force is varied also impacts measurements—for instance, in the titin measurements above, measured unfolding forces varied from 130 pN at 0.01 μm/s to 190 pN at 1 μm/s.(15)
Conformational changes can also be measured using optical traps.26,279,302 Optical traps typically apply forces <100 pN. This makes them most suitable for measuring conformational changes in biomolecules such as nucleic acids since protein unfolding often requires forces >100 pN.(45)
In some cases, a dual-trap formation is used, in which the target molecule is tethered to two beads rather than a bead and the surface. This configuration eliminates problems with surface drift and can increase measurement precision since the two beads are tethered together and thus experience correlated Brownian fluctuations.(46) For example, Liphard and Bustamante measured the energetics of unfolding of single RNA hairpins tethered by DNA handles to two trapped beads (27).(301) Equilibrium constants were calculated based on applied forces required for repeated unfolding and refolding (27); in addition, the single-molecule nature of the experiment allowed observation of “hopping” between folded and unfolded states at a static force near the unfolding force (∼14 pN) (27). More recent examples of the resolution that can be achieved using this technique include the measurement of single-base precession (0.34 nm) in an RNA polymerase(284) by Block and co-workers and studies of intersubunit coordination in ring ATPases by Bustamante and co-workers, in which high loading forces (40 pN) allow 2.5 bp substeps (0.85 nm) to be resolved.(303)
External forces such as solvent flow fields and electric fields can also be applied, either alone or in combination with a force-generating tethered probe to extract even more information from the system.(304) Classic example includes the early work of Bustamante and co-workers(5) and Chu and co-workers,7,13 investigating the complex mechanical behavior of single DNA molecules.
To measure the elastic response of single DNA molecules to a range of forces from 0.1 to 100 pN, Bustamante and co-workers used single ∼30 μm DNA molecules bound at one end to a glass surface and at the other to a 3 μm magnetic bead.(5) The position of the bead was monitored optically as a magnetic force (<1 pN) was applied and an orthogonal hydrodynamic force (up to 30 pN) was applied by flowing solvent through the sample chamber (28). The small magnetic force was used to calibrate the larger hydrodynamic force, which would otherwise be difficult to measure near a surface due to shear effects.
Figure 28.

Both magnetic and flow forces are used to measure force vs extension curves for single DNA molecules. DNA tethered at one end to a glass slide and at the other to a 3 μm magnetic bead is subjected to both flowing solvent and a magnetic field in another direction to allow more precise force calibration. Adapted from ref (5).
Studying the relaxation of DNA in solution, Chu and co-workers used DNA (up to 50 μm) bound at one end to a polymer bead and labeled with fluorescent dyes along the length of the helix. An optical trap immobilized the bead while flowing solvent stretched the DNA, and an optical microscope was used to observe the DNA relaxation process at video rates.(13)
Many biomolecules, including DNA, are charged and can be manipulated by electric fields, a fact that is exploited in electrophoretic separation. Large DNA molecules have been optically trapped and manipulated directly (i.e., without polymer bead labels) by Zare and co-workers.(305) The application of external electric fields can also be combined with other single-molecule techniques to increase control. For instance, in the work of Washizu and co-workers, DNA tethered at one end to a surface was stretched using an electric field, which exerted force on the negatively charged phosphate groups found along the DNA helix.(306) Enzymes connected to optically trapped polymer beads could then be manipulated precisely with respect to the DNA molecule and used to cut the DNA in well-defined locations.(307)
Rotation
Magnetic nanoparticles are especially useful as force-applying probes since they can be controllably rotated by an external field to change the orientation of the target. Torques exerted by typical particles (>0.5 μm) are on the order of nN·m, much larger than relevant forces in most biological processes. Thus, to date, the rotational capability has largely been exploited to create a fixed “winding” state as a starting point for force vs extension experiments. In a classic example, a ∼20 μm DNA double helix was bound at one end to a glass slide and at the other to an anisotropic magnetic nanoparticle; the nanoparticle was rotated using an external magnetic field, and force vs extension curves were measured for the helix across a range of over- and underwound states up to 500 rotations (29).(6) Similar measurements have been performed on other biological systems including DNA interacting with enzymes such as topoisomerase(308) and the rotational motor F1-ATPase.(309)
Figure 29.

(a) Magnetic bead winding measures force vs extension curves for single 17 μm DNA molecules based on fraction of supercoiling (σ). (b) Positively supercoiled DNA exhibits a transition to slower extension at forces greater than 3 pN, whereas (c) a similar transition occurs for negatively supercoiled DNA at 0.45 pN. Adapted from ref (6).
Recently, torque has also been applied in an optical trap, using polarized laser illumination and birefringent trapped particles.(310) Nanofabricated quartz cylinders can be used to apply pulling forces up to 100 pN and torques ranging from 10 to 3000 pN·m. The cylinders can also be selectively biofunctionalized; this capability has been exploited to study DNA phase transitions with supercoiling.311,312
Electronic and Nuclear Spins: MRFM
At the nanoscale, electronic and nuclear spins can be detected through force-based measurements using a variation on AFM.(33) In magnetic resonance force microscopy (MRFM), samples are mounted on an ultrasensitive silicon cantilever. The cantilever is positioned about 25 nm above a magnetic nanoparticle that produces a highly inhomogeneous magnetic field, with field gradients exceeding 106 T m−1 in the vicinity of the sample.(313) The spatially dependent magnetic field from the nanoparticle, combined with an additional uniform field of around 2.8 T,(314) creates a small resonance region of aligned spins within the sample. The local magnetic field strength inside this resonance region is such that the Larmor precession frequency of the aligned spins matches the frequency of an applied RF pulse. Measuring the resonant response of the cantilever to the RF pulse as it is scanned in a three-dimensional raster pattern through the resonance region enables 3D mapping of spins within the sample.
Although conceptually similar to conventional magnetic resonance imaging (MRI), MRFM has important differences. In both techniques, the applied magnetic field polarizes the spins within the sample and induces a net magnetic dipole moment with a magnitude dependent on the Boltzmann distribution. In MFRM, however, the resonance region may contain as few as ∼103 nuclear spins.33,313,314 With such a small number of spins probed, the resulting Boltzmann polarization is relatively weak at commonly employed field strengths. Instead, the signal is derived from the larger “spin noise” (√N) statistical polarization, enabling measurements of about nine orders of magnitude fewer spins than required for MRI.(33) MRFM measures the force experienced by these polarized spins in the inhomogeneous magnetic field. This force (typically on the order of 10−17 N) generates sub-Ångström oscillations of the cantilever, detected via interferometry, as the spins are resonantly inverted by the RF pulse.(313)
Detecting such weak signals requires careful measurement techniques and instrument design. Maximizing the magnetic field gradient is critical to single-spin detection since larger gradients result in both higher forces acting on the magnetic moments (causing greater cantilever deflections) and smaller resonance regions (increasing spatial resolution and reducing the number of spins probed). To improve signal-to-noise ratios, relatively long averaging times (1−10 min per pixel) are used. This necessitates an extremely stable environment, achieved by operating in high or ultrahigh vacuum and at low temperatures (10−1 K).(33)
Rugar, Mamin, and co-workers have already demonstrated the ability to detect single electron spins with a spatial resolution of 25 nm in one dimension using MRFM.(315) Nuclear spin detection poses a greater challenge due to the much smaller magnitudes of nuclear magnetic moments (μelectron ≈ 650 μproton). Currently, detection limits are still 2 to 3 orders of magnitude above those required for the detection of a single nuclear spin. However, spatial resolutions of <10 nm have been achieved, enabling imaging of large biological macromolecules such as tobacco mosaic virus (30).(313)
Figure 30.

(a) Single-molecule detection based on spin using magnetic resonance force microscopy. (b) Cross section of a single tobacco mosaic virus. (c) Image of tobacco mosaic virus. Adapted from ref (313).
Conclusions and Prospects
In the past two decades, single-molecule experiments have progressed from the first reports of single-molecule optical detection in a solid at liquid helium temperatures,(3) and early reports of scanning probe molecular measurements, to the strikingly diverse array of measurement techniques discussed here. Single-molecule technologies, including high-throughput methods for single-molecule DNA sequencing,316−318 are being commercialized, and early outreach efforts are bringing single-molecule magnetic bead experiments to high school classrooms.
While phenomenal progress has been made across all techniques, much remains to be done. In the limit, it may be possible to understand the chemical structure, dynamics, and interactions of an arbitrary target molecule or molecular assembly. Such a capability would depend upon the native strengths of many of the methods described here, as well as the combined creative efforts of scientists in disciplines ranging from physics to chemistry to materials science and biology. Some future directions for these efforts are clear; others will no doubt surprise us.
Instrumentation and analysis advances in electron-based techniques are increasing time resolution(319) and making more chemical information available from scanning tunneling microscopy.31,52 These will expand the range of both structural and dynamic problems that can be investigated using STM. Molecular devices will benefit from advances in multiprobe instrumentation.320,321 Likewise, increasing resolution in TEM combined with advanced image analyses are beginning to provide routine methods for detailed biological structure analysis at the molecular scale,(68) including DNA sequencing.(322) As liquid(118) and in situ TEM(115) become more broadly available, the types of dynamic processes that can be observed should also grow to include the motion of single molecules, possibly with labeling strategies(323) similar to those employed in fluorescence measurements. Advances in electrode fabrication will likely make single-molecule conductance and electrochemical measurements feasible even on complex molecules including enzymes.324,325
Photonic experiments will benefit both from advances in instrumentation and in labeling techniques. New instrumentation is improving 3D measurement capabilities(22) and measurements in inhomogeneous biological environments.(326) Careful design of both instruments and probes can also maximize the utilization of photons, minimizing photodamage.(327) Development of small, high-brightness, slow-bleaching probes will be critical,(328) as will near-IR probes that facilitate imaging in tissue,(329) discrete plasmonic probes,(330) and labeling strategies that minimize uncertainty in the placement and orientation of the probe relative to the target. Single-molecule FRET measurements will also continue to gain traction as a means of quantifying the behavior of biological molecules at length scales below 10 nm.(10) The recent emergence of nonfluorescence-based optical detection strategies201−203 and the development of next-generation X-ray sources, such as X-ray free-electron lasers,331,332 also promise to open new experimental avenues.
Single-molecule force experiments are becoming increasingly important as there is greater understanding of the interplay between force and structure at these length scales. In addition to the high-precision spatial measurements offered by frequency-shift AFM, a wide variety of other AFM measurement modalities are emerging, quantifying not only electrostatic and magnetic forces but also piezoelectric responses,(333) spin polarization,(334) and mass.(335) Experiments in which the target molecule is bound to the probe will benefit from specific attachment strategies that increase reproducibility, as well as discrete labeling strategies that ensure a single molecule is bound to the probe particle. Novel methods for applying force will continue to emerge,(336) as will strategies for probing subsurface features using force-based scanning probes.(337)
Finally, since each measurement has native strengths and limitations, a complete understanding of the structure and function of a single molecule as it interacts with its environment may ultimately arise from the ability to combine modalities. Optical trapping has led to a natural overlap between optical and force-based measurements of forces as they relate to motion on the nanoscale in biological systems. Recently, AFM measurements have also been combined with both STM(338) and TEM,(115) opening the possibility of direct, label-free measurement of subnanometer structural changes in response to force. The ability to perform optical and electronic single-molecule measurements simultaneously could help bridge the native length scales of each experiment. Ultimately, such combinations may provide the key elements for understanding molecular structure and function: subnanometer spatial resolution, millisecond or better temporal resolution, a high degree of chemical information, and flexibility to operate in complex biological environments under ambient conditions.
Acknowledgments
We gratefully acknowledge support from DoE (DE-SC00-05161), NSF (NSF-CHE-1041943), NIH (NRSA postdoctoral fellowship, S.A.C.), and the Kavli Foundation (P.S.W.). The authors thank Hong Zhou for helpful discussions.
Funding Statement
National Institutes of Health, United States
References
- Müller E. W. Das Feldionenmikroskop. Z. Angew. Phys. 1951, 131, 136–142. [Google Scholar]
- Melmed A. J.; Müller E. W. Study of Molecular Patterns in the Field Emission Microscope. J. Chem. Phys. 1958, 29, 1037–1041. [Google Scholar]
- Moerner W. E.; Kador L. Optical-Detection and Spectroscopy of Single Molecules in a Solid. Phys. Rev. Lett. 1989, 62, 2535–2538. [DOI] [PubMed] [Google Scholar]
- Binnig G.; Rohrer H. Scanning Tunneling Microscopy. Helv. Phys. Acta 1982, 55, 726–735. [Google Scholar]
- Smith S. B.; Finzi L.; Bustamante C. Direct Mechanical Measurements of the Elasticity of Single DNA-Molecules by Using Magnetic Beads. Science 1992, 258, 1122–1126. [DOI] [PubMed] [Google Scholar]
- Strick T. R.; Allemand J. F.; Bensimon D.; Bensimon A.; Croquette V. The Elasticity of a Single Supercoiled DNA Molecule. Science 1996, 271, 1835–1837. [DOI] [PubMed] [Google Scholar]
- Perkins T. T.; Smith D. E.; Chu S. Single Polymer Dynamics in an Elongational Flow. Science 1997, 276, 2016–2021. [DOI] [PubMed] [Google Scholar]
- Moerner W. E. A Dozen Years of Single-Molecule Spectroscopy in Physics, Chemistry, and Biophysics. J. Phys. Chem. B 2002, 106, 910–927. [Google Scholar]
- Weiss S. Fluorescence Spectroscopy of Single Biomolecules. Science 1999, 283, 1676–1683. [DOI] [PubMed] [Google Scholar]
- Roy R.; Hohng S.; Ha T. A Practical Guide to Single-Molecule FRET. Nat. Methods 2008, 5, 507–516. [DOI] [PMC free article] [PubMed] [Google Scholar]
- Greenleaf W. J.; Woodside M. T.; Block S. M. High-Resolution, Single-Molecule Measurements of Biomolecular Motion. Annu. Rev. Biophys. Biomol. Struct. 2007, 36, 171–190. [DOI] [PMC free article] [PubMed] [Google Scholar]
- Bustamante C.; Bryant Z.; Smith S. B. Ten Years of Tension: Single-Molecule DNA Mechanics. Nature 2003, 421, 423–427. [DOI] [PubMed] [Google Scholar]
- Perkins T. T.; Quake S. R.; Smith D. E.; Chu S. Relaxation of a Single DNA Molecule Observed by Optical Microscopy. Science 1994, 264, 822–826. [DOI] [PubMed] [Google Scholar]
- Smith D. E.; Babcock H. P.; Chu S. Single-Polymer Dynamics in Steady Shear Flow. Science 1999, 283, 1724–1727. [DOI] [PubMed] [Google Scholar]
- Rief M.; Gautel M.; Oesterhelt F.; Fernandez J. M.; Gaub H. E. Reversible Unfolding of Individual Titin Immunoglobulin Domains by AFM. Science 1997, 276, 1109–1112. [DOI] [PubMed] [Google Scholar]
- Hamill O. P.; Marty A.; Neher E.; Sakmann B.; Sigworth F. J. Improved Patch-Clamp Techniques for High-Resolution Current Recording from Cells and Cell-Free Membrane Patches. Pfluegers Arch. 1981, 391, 85–100. [DOI] [PubMed] [Google Scholar]
- Lemay S. G. Nanopore-Based Biosensors: The Interface between Ionics and Electronics. ACS Nano 2009, 3, 775–779. [DOI] [PubMed] [Google Scholar]
- Gimzewski J. K.; Joachim C. Nanoscale Science of Single Molecules Using Local Probes. Science 1999, 283, 1683–1688. [DOI] [PubMed] [Google Scholar]
- Joachim C.; Gimzewski J. K.; Aviram A. Electronics Using Hybrid-Molecular and Mono-Molecular Devices. Nature 2000, 408, 541–548. [DOI] [PubMed] [Google Scholar]
- Weiss P. S. Functional Molecules and Assemblies in Controlled Environments: Formation and Measurements. Acc. Chem. Res. 2008, 41, 1772–1781. [DOI] [PubMed] [Google Scholar]
- De Feyter S.; De Schryver F. C. Two-Dimensional Supramolecular Self-Assembly Probed by Scanning Tunneling Microscopy. Chem. Soc. Rev. 2003, 32, 139–150. [DOI] [PubMed] [Google Scholar]
- Pavani S. R. P.; Thompson M. A.; Biteen J. S.; Lord S. J.; Liu N.; Twieg R. J.; Piestun R.; Moerner W. E. Three-Dimensional, Single-Molecule Fluorescence Imaging Beyond the Diffraction Limit by Using a Double-Helix Point Spread Function. Proc. Natl. Acad. Sci. U.S.A. 2009, 106, 2995–2999. [DOI] [PMC free article] [PubMed] [Google Scholar]
- Yu J.; Xiao J.; Ren X. J.; Lao K. Q.; Xie X. S. Probing Gene Expression in Live Cells, One Protein Molecule at a Time. Science 2006, 311, 1600–1603. [DOI] [PubMed] [Google Scholar]
- Michalet X.; Weiss S.; Jager M. Single-Molecule Fluorescence Studies of Protein Folding and Conformational Dynamics. Chem. Rev. 2006, 106, 1785–1813. [DOI] [PMC free article] [PubMed] [Google Scholar]
- Joo C.; Balci H.; Ishitsuka Y.; Buranachai C.; Ha T. Advances in Single-Molecule Fluorescence Methods for Molecular Biology. Annu. Rev. Biochem. 2008, 77, 51–76. [DOI] [PubMed] [Google Scholar]
- Moffitt J. R.; Chemla Y. R.; Smith S. B.; Bustamante C. Recent Advances in Optical Tweezers. Annu. Rev. Biochem. 2008, 77, 205–228. [DOI] [PubMed] [Google Scholar]
- Muller D. J.; Dufrene Y. F. Atomic Force Microscopy as a Multifunctional Molecular Toolbox in Nanobiotechnology. Nat. Nanotechnol. 2008, 3, 261–269. [DOI] [PubMed] [Google Scholar]
- Gross L.; Mohn F.; Moll N.; Liljeroth P.; Meyer G. The Chemical Structure of a Molecule Resolved by Atomic Force Microscopy. Science 2009, 325, 1110–1114. [DOI] [PubMed] [Google Scholar]
- Michl J.; Sykes E. C. H. Molecular Rotors and Motors: Recent Advances and Future Challenges. ACS Nano 2009, 3, 1042–1048. [DOI] [PubMed] [Google Scholar]
- Bustamante C.; Chemla Y. R.; Forde N. R.; Izhaky D. Mechanical Processes in Biochemistry. Annu. Rev. Biochem. 2004, 73, 705–748. [DOI] [PubMed] [Google Scholar]
- Zandvliet H. J. W.; van Houselt A. Scanning Tunneling Spectroscopy. Annu. Rev. Anal. Chem. 2009, 2, 37–55. [DOI] [PubMed] [Google Scholar]
- Chen F.; Hihath J.; Huang Z. F.; Li X. L.; Tao N. J. Measurement of Single-Molecule Conductance. Annu. Rev. Phys. Chem. 2007, 58, 535–564. [DOI] [PubMed] [Google Scholar]
- Poggio M.; Degen C. L. Force-Detected Nuclear Magnetic Resonance: Recent Advances and Future Challenges. Nanotechnology 2010, 21, 342001−1–13. [DOI] [PubMed] [Google Scholar]
- Maze J. R.; Stanwix P. L.; Hodges J. S.; Hong S.; Taylor J. M.; Cappellaro P.; Jiang L.; Dutt M. V. G.; Togan E.; Zibrov A. S.; et al. Nanoscale Magnetic Sensing with an Individual Electronic Spin in Diamond. Nature 2008, 455, 644–648. [DOI] [PubMed] [Google Scholar]
- Xue Q. F.; Yeung E. S. Differences in the Chemical-Reactivity of Individual Molecules of an Enzyme. Nature 1995, 373, 681–683. [DOI] [PubMed] [Google Scholar]
- Lu H. P.; Xun L. Y.; Xie X. S. Single-Molecule Enzymatic Dynamics. Science 1998, 282, 1877–1882. [DOI] [PubMed] [Google Scholar]
- Weiss S. Measuring Conformational Dynamics of Biomolecules by Single Molecule Fluorescence Spectroscopy. Nat. Struct. Mol. Biol. 2000, 7, 724–729. [DOI] [PubMed] [Google Scholar]
- Jaklevic R. C.; Lambe J. Molecular Vibration Spectra by Electron Tunneling. Phys. Rev. Lett. 1966, 17, 1139–1140. [Google Scholar]
- Lambe J.; Jaklevic R. C. Molecular Vibration Spectra by Inelastic Electron Tunneling. Phys. Rev. 1968, 165, 821–832. [Google Scholar]
- Smith D. J. The Realization of Atomic Resolution with the Electron Microscope. Rep. Prog. Phys. 1997, 60, 1513–1580. [Google Scholar]
- Donhauser Z. J.; Mantooth B. A.; Kelly K. F.; Bumm L. A.; Monnell J. D.; Stapleton J. J.; Price D. W.; Rawlett A. M.; Allara D. L.; Tour J. M.; et al. Conductance Switching in Single Molecules through Conformational Changes. Science 2001, 292, 2303–2307. [DOI] [PubMed] [Google Scholar]
- Moerner W. E.; Orrit M. Illuminating Single Molecules in Condensed Matter. Science 1999, 283, 1670–1676. [DOI] [PubMed] [Google Scholar]
- Giepmans B. N. G.; Adams S. R.; Ellisman M. H.; Tsien R. Y. The Fluorescent Toolbox for Assessing Protein Location and Function. Science 2006, 312, 217–224. [DOI] [PubMed] [Google Scholar]
- Ha T.; Enderle T.; Chemla D. S.; Selvin P. R.; Weiss S. Single Molecule Dynamics Studied by Polarization Modulation. Phys. Rev. Lett. 1996, 77, 3979–3982. [DOI] [PubMed] [Google Scholar]
- Neuman K. C.; Nagy A. Single-Molecule Force Spectroscopy: Optical Tweezers, Magnetic Tweezers and Atomic Force Microscopy. Nat. Methods 2008, 5, 491–505. [DOI] [PMC free article] [PubMed] [Google Scholar]
- Moffitt J. R.; Chemla Y. R.; Izhaky D.; Bustamante C. Differential Detection of Dual Traps Improves the Spatial Resolution of Optical Tweezers. Proc. Natl. Acad. Sci. U.S.A. 2006, 103, 9006–9011. [DOI] [PMC free article] [PubMed] [Google Scholar]
- Danilowicz C.; Lee C. H.; Kim K.; Hatch K.; Coljee V. W.; Kleckner N.; Prentiss M. Single Molecule Detection of Direct, Homologous, DNA/DNA Pairing. Proc. Natl. Acad. Sci. U.S.A. 2009, 106, 19824–19829. [DOI] [PMC free article] [PubMed] [Google Scholar]
- Weiss P. S.; Eigler D. M. Site Dependence of the Apparent Shape of a Molecule in Scanning Tunneling Microscope Images—Benzene on Pt(111). Phys. Rev. Lett. 1993, 71, 3139–3142. [DOI] [PubMed] [Google Scholar]
- Hansma P. K.; Tersoff J. Scanning Tunneling Microscopy. J. Appl. Phys. 1987, 61, R1–R23. [Google Scholar]
- Urban K. W. Studying Atomic Structures by Aberration-Corrected Transmission Electron Microscopy. Science 2008, 321, 506–510. [DOI] [PubMed] [Google Scholar]
- Eigler D. M.; Weiss P. S.; Schweizer E. K.; Lang N. D. Imaging Xe with a Low-Temperature Scanning Tunneling Microscope. Phys. Rev. Lett. 1991, 66, 1189–1192. [DOI] [PubMed] [Google Scholar]
- Moore A. M.; Weiss P. S. Functional and Spectroscopic Measurements with Scanning Tunneling Microscopy. Annu. Rev. Anal. Chem. 2008, 1, 857–882. [DOI] [PubMed] [Google Scholar]
- Ertl G. Reactions at Well-Defined Surfaces. Surf. Sci. 1994, 299, 742–754. [Google Scholar]
- Somorjai G. A. Modern Surface Science and Surface Technologies: An Introduction. Chem. Rev. 1996, 96, 1223–1235. [DOI] [PubMed] [Google Scholar]
- Poirier G. E. Characterization of Organosulfur Molecular Monolayers on Au(111) Using Scanning Tunneling Microscopy. Chem. Rev. 1997, 97, 1117–1127. [DOI] [PubMed] [Google Scholar]
- McKie D.; McKie C.. Essentials of Crystallography; Blackwell Scientific Publications: Oxford, 1986. [Google Scholar]
- Wong K.; Kwon K. Y.; Rao B. V.; Liu A. W.; Bartels L. Effect of Halo Substitution on the Geometry of Arenethiol Films on Cu(111). J. Am. Chem. Soc. 2004, 126, 7762–7763. [DOI] [PubMed] [Google Scholar]
- Wong K. L.; Lin X.; Kwon K. Y.; Pawin G.; Rao B. V.; Liu A.; Bartels L.; Stolbov S.; Rahman T. S. Halogen-Substituted Thiophenol Molecules on Cu(111). Langmuir 2004, 20, 10928–10934. [DOI] [PubMed] [Google Scholar]
- Shevchenko E. V.; Talapin D. V.; Kotov N. A.; O’Brien S.; Murray C. B. Structural Diversity in Binary Nanoparticle Superlattices. Nature 2006, 439, 55–59. [DOI] [PubMed] [Google Scholar]
- Schreiber F. Structure and Growth of Self-Assembling Monolayers. Prog. Surf. Sci. 2000, 65, 151–256. [Google Scholar]
- Chidsey C. E. D.; Loiacono D. N. Chemical Functionality in Self-Assembled Monolayers—Structural and Electrochemical Properties. Langmuir 1990, 6, 682–691. [Google Scholar]
- Weigelt S.; Busse C.; Petersen L.; Rauls E.; Hammer B.; Gothelf K. V.; Besenbacher F.; Linderoth T. R. Chiral Switching by Spontaneous Conformational Change in Adsorbed Organic Molecules. Nat. Mater. 2006, 5, 112–117. [DOI] [PubMed] [Google Scholar]
- Monnell J. D.; Stapleton J. J.; Jackiw J. J.; Dunbar T.; Reinerth W. A.; Dirk S. M.; Tour J. M.; Allara D. L.; Weiss P. S. Ordered Local Domain Structures of Decaneselenolate and Dodecaneselenolate Monolayers on Au{111}. J. Phys. Chem. B 2004, 108, 9834–9841. [Google Scholar]
- Shevchenko E. V.; Talapin D. V.; Murray C. B.; O’Brien S. Structural Characterization of Self-Assembled Multifunctional Binary Nanoparticle Superlattices. J. Am. Chem. Soc. 2006, 128, 3620–3637. [DOI] [PubMed] [Google Scholar]
- Smith B. W.; Monthioux M.; Luzzi D. E. Carbon Nanotube Encapsulated Fullerenes: A Unique Class of Hybrid Materials. Chem. Phys. Lett. 1999, 315, 31–36. [Google Scholar]
- Smith B. W.; Luzzi D. E.; Achiba Y. Tumbling Atoms and Evidence for Charge Transfer in La2@C80@SWNT. Chem. Phys. Lett. 2000, 331, 137–142. [Google Scholar]
- Yu X. K.; Jin L.; Zhou Z. H. 3.88 Å Structure of Cytoplasmic Polyhedrosis Virus by Cryo-Electron Microscopy. Nature 2008, 453, 415–420. [DOI] [PMC free article] [PubMed] [Google Scholar]
- Zhang X.; Jin L.; Fang Q.; Hui W. H.; Zhou Z. H. 3.3 Å Cryo-EM Structure of a Nonenveloped Virus Reveals a Priming Mechanism for Cell Entry. Cell 2010, 141, 472–482. [DOI] [PMC free article] [PubMed] [Google Scholar]
- Huang C. S.; Sadre-Bazzaz K.; Shen Y.; Deng B. B.; Zhou Z. H.; Tong L. A. Crystal Structure of the α6β6 Holoenzyme of Propionyl-Coenzyme A Carboxylase. Nature 2010, 466, 1001–1006. [DOI] [PMC free article] [PubMed] [Google Scholar]
- Poirier G. E.; Tarlov M. J. Molecular Ordering and Gold Migration Observed in Butanethiol Self-Assembled Monolayers Using Scanning-Tunneling-Microscopy. J. Phys. Chem. 1995, 99, 10966–10970. [Google Scholar]
- Xiao X. D.; Wang B.; Zhang C.; Yang Z.; Loy M. M. T. Thermal Annealing Effect of Alkanethiol Monolayers on Au(111) in Air. Surf. Sci. 2001, 472, 41–50. [Google Scholar]
- Li X. L.; Xu B. Q.; Xiao X. Y.; Yang X. M.; Zang L.; Tao N. J. Controlling Charge Transport in Single Molecules Using an Electrochemical Gate. Faraday Discuss. 2006, 131, 111–120. [DOI] [PubMed] [Google Scholar]
- Cyganik P.; Buck M.; Strunskus T.; Shaporenko A.; Witte G.; Zharnikov M.; Woll C. Influence of Molecular Structure on Phase Transitions: A Study of Self-Assembled Monolayers of 2-(Aryl)-Ethane Thiols. J. Phys. Chem. C 2007, 111, 16909–16919. [Google Scholar]
- Lussem B.; Muller-Meskamp L.; Karthauser S.; Waser R.; Homberger M.; Simon U. STM Study of Mixed Alkanethiol/Biphenylthiol Self-Assembled Monolayers on Au(111). Langmuir 2006, 22, 3021–3027. [DOI] [PubMed] [Google Scholar]
- Lewis P. A.; Smith R. K.; Kelly K. F.; Bumm L. A.; Reed S. M.; Clegg R. S.; Gunderson J. D.; Hutchison J. E.; Weiss P. S. The Role of Buried Hydrogen Bonds in Self-Assembled Mixed Composition Thiols on Au{111}. J. Phys. Chem. B 2001, 105, 10630–10636. [Google Scholar]
- Poirier G. E.; Tarlov M. J. The c(4 × 2) Superlattice of n-Alkanethiol Monolayers Self-Assembled on Au(111). Langmuir 1994, 10, 2853–2856. [Google Scholar]
- Shuster M. J.; Vaish A.; Szapacs M. E.; Anderson M. E.; Weiss P. S.; Andrews A. M. Biospecific Recognition of Tethered Small Molecules Diluted in Self-Assembled Monolayers. Adv. Mater. 2008, 20, 164–167. [Google Scholar]
- Lewis P. A.; Inman C. E.; Yao Y. X.; Tour J. M.; Hutchison J. E.; Weiss P. S. Mediating Stochastic Switching of Single Molecules Using Chemical Functionality. J. Am. Chem. Soc. 2004, 126, 12214–12215. [DOI] [PubMed] [Google Scholar]
- Donhauser Z. J.; Price D. W.; Tour J. M.; Weiss P. S. Control of Alkanethiolate Monolayer Structure Using Vapor-Phase Annealing. J. Am. Chem. Soc. 2003, 125, 11462–11463. [DOI] [PubMed] [Google Scholar]
- Dameron A. A.; Charles L. F.; Weiss P. S. Structures and Displacement of 1-Adamantanethiol Self-Assembled Monolayers on Au{111}. J. Am. Chem. Soc. 2005, 127, 8697–8704. [DOI] [PubMed] [Google Scholar]
- Moore A. M.; Mantooth B. A.; Donhauser Z. J.; Maya F.; Price D. W.; Yao Y. X.; Tour J. M.; Weiss P. S. Cross-Step Place-Exchange of Oligo(phenylene-ethynylene) Molecules. Nano Lett. 2005, 5, 2292–2297. [DOI] [PubMed] [Google Scholar]
- Mullen T. J.; Dameron A. A.; Andrews A. M.; Weiss P. S. Selecting and Driving Monolayer Structures through Tailored Intermolecular Interactions. Aldrichimica Acta 2007, 40, 21–31. [Google Scholar]
- Hohman J. N.; Zhang P. P.; Morin E. I.; Han P.; Kim M.; Kurland A. R.; McClanahan P. D.; Balema V. P.; Weiss P. S. Self-Assembly of Carboranethiol Isomers on Au{111}: Intermolecular Interactions Determined by Molecular Dipole Orientations. ACS Nano 2009, 3, 527–536. [DOI] [PubMed] [Google Scholar]
- Kim M.; Hohman J. N.; Morin E. I.; Daniel T. A.; Weiss P. S. Self-Assembled Monolayers of 2-Adamantanethiol on Au{111}: Control of Structure and Displacement. J. Phys. Chem. A 2009, 113, 3895–3903. [DOI] [PubMed] [Google Scholar]
- Hohman J. N.; Claridge S. A.; Kim M.; Weiss P. S. Cage Molecules for Self-Assembly. Mater. Sci. Eng. Rep. 2010, 70, 188–208. [Google Scholar]
- Repp J.; Moresco F.; Meyer G.; Rieder K. H.; Hyldgaard P.; Persson M. Substrate Mediated Long-Range Oscillatory Interaction between Adatoms: Cu/Cu(111). Phys. Rev. Lett. 2000, 85, 2981–2984. [DOI] [PubMed] [Google Scholar]
- Knorr N.; Brune H.; Epple M.; Hirstein A.; Schneider M. A.; Kern K. Long-Range Adsorbate Interactions Mediated by a Two-Dimensional Electron Gas. Phys. Rev. B 2002, 65, 115420-1-5. [Google Scholar]
- Silly F.; Pivetta M.; Ternes M.; Patthey F.; Pelz J. P.; Schneider W. D. Creation of an Atomic Superlattice by Immersing Metallic Adatoms in a Two-Dimensional Electron Sea. Phys. Rev. Lett. 2004, 92, 016101-1-5. [DOI] [PubMed] [Google Scholar]
- Pawin G.; Wong K. L.; Kwon K. Y.; Bartels L. A Homomolecular Porous Network at a Cu(111) Surface. Science 2006, 313, 961–962. [DOI] [PubMed] [Google Scholar]
- Dougherty D. B.; Maksymovych P.; Lee J.; Yates J. T. Local Spectroscopy of Image-Potential-Derived States: From Single Molecules to Monolayers of Benzene on Cu(111). Phys. Rev. Lett. 2006, 97, 236806-1-4. [DOI] [PubMed] [Google Scholar]
- Nanayakkara S. U.; Sykes E. C. H.; Fernandez-Torres L. C.; Blake M. M.; Weiss P. S. Long-Range Electronic Interactions at a High Temperature: Bromine Adatom Islands on Cu(111). Phys. Rev. Lett. 2007, 98, 206108-1-4. [DOI] [PubMed] [Google Scholar]
- Han P.; Kurland A. R.; Giordano A. N.; Nanayakkara S. U.; Blake M. M.; Pochas C. M.; Weiss P. S. Heads and Tails: Simultaneous Exposed and Buried Interface Imaging of Monolayers. ACS Nano 2009, 3, 3115–3121. [DOI] [PubMed] [Google Scholar]
- Kim Y.; Long E. C.; Barton J. K.; Lieber C. M. Imaging of Oligonucleotide Metal-Complexes by Scanning Tunneling Microscopy. Langmuir 1992, 8, 496–500. [Google Scholar]
- Tanaka H.; Kawai T. Visualization of Detailed Structures within DNA. Surf. Sci. 2003, 539, L531–L536. [Google Scholar]
- Otero R.; Xu W.; Lukas M.; Kelly R. E. A.; Laegsgaard E.; Stensgaard I.; Kjems J.; Kantorovich L. N.; Besenbacher F. Specificity of Watson−Crick Base Pairing on a Solid Surface Studied at the Atomic Scale. Angew. Chem., Int. Ed. 2008, 47, 9673–9676. [DOI] [PubMed] [Google Scholar]
- Feldkamp U.; Niemeyer C. M. Rational Design of DNA Nanoarchitectures. Angew. Chem., Int. Ed. 2006, 45, 1856–1876. [DOI] [PubMed] [Google Scholar]
- Giljohann D. A.; Seferos D. S.; Daniel W. L.; Massich M. D.; Patel P. C.; Mirkin C. A. Gold Nanoparticles for Biology and Medicine. Angew. Chem., Int. Ed. 2010, 49, 3280–3294. [DOI] [PMC free article] [PubMed] [Google Scholar]
- Claridge S. A.; Goh S. L.; Frechet J. M. J.; Williams S. C.; Micheel C. M.; Alivisatos A. P. Directed Assembly of Discrete Gold Nanoparticle Groupings Using Branched DNA Scaffolds. Chem. Mater. 2005, 17, 1628–1635. [Google Scholar]
- Fu A. H.; Micheel C. M.; Cha J.; Chang H.; Yang H.; Alivisatos A. P. Discrete Nanostructures of Quantum Dots/Au with DNA. J. Am. Chem. Soc. 2004, 126, 10832–10833. [DOI] [PubMed] [Google Scholar]
- Micheel C. M.; Zanchet D.; Alivisatos A. P. Correlation Analysis of TEM Images of Nanocrystal Molecules. Langmuir 2008, 24, 10084–10088. [DOI] [PubMed] [Google Scholar]
- Choi C. L.; Claridge S. A.; Garner E. C.; Alivisatos A. P.; Mullins R. D. Protein−Nanocrystal Conjugates Support a Single Filament Polymerization Model in R1 Plasmid Segregation. J. Biol. Chem. 2008, 283, 28081–28086. [DOI] [PMC free article] [PubMed] [Google Scholar]
- Binnig G.; Fuchs H.; Stoll E. Surface-Diffusion of Oxygen-Atoms Individually Observed by STM. Surf. Sci. 1986, 169, L295–L300. [Google Scholar]
- Shirai Y.; Osgood A. J.; Zhao Y. M.; Yao Y. X.; Saudan L.; Yang H. B.; Chiu Y. H.; Alemany L. B.; Sasaki T.; Morin J. F.; et al. Surface-Rolling Molecules. J. Am. Chem. Soc. 2006, 128, 4854–4864. [DOI] [PubMed] [Google Scholar]
- Kwon K. Y.; Wong K. L.; Pawin G.; Bartels L.; Stolbov S.; Rahman T. S. Unidirectional Adsorbate Motion on a High-Symmetry Surface: “Walking” Molecules Can Stay the Course. Phys. Rev. Lett. 2005, 95, 166101-1-5. [DOI] [PubMed] [Google Scholar]
- Wong K. L.; Rao B. V.; Pawin G.; Ulin-Avila E.; Bartels L. Coverage and Nearest-Neighbor Dependence of Adsorbate Diffusion. J. Chem. Phys. 2005, 123, 201102-1-4. [DOI] [PubMed] [Google Scholar]
- Wong K. L.; Kwon K. Y.; Bartels L. Surface Dynamics of Benzenethiol Molecules on Cu(111). Appl. Phys. Lett. 2006, 88, 183106-1-3. [Google Scholar]
- Pawin G.; Solanki U.; Kwon K. Y.; Wong K. L.; Lin X.; Jiao T.; Bartels L. A Quantitative Approach to Hydrogen Bonding at a Metal Surface. J. Am. Chem. Soc. 2007, 129, 12056–12057. [DOI] [PubMed] [Google Scholar]
- Pawin G.; Wong K. L.; Kwon K. Y.; Frisbee R. J.; Rahman T. S.; Bartels L. Surface Diffusive Motion in a Periodic and Asymmetric Potential. J. Am. Chem. Soc. 2008, 130, 15244–15245. [DOI] [PubMed] [Google Scholar]
- Wong K. L.; Pawin G.; Kwon K. Y.; Lin X.; Jiao T.; Solanki U.; Fawcett R. H. J.; Bartels L.; Stolbov S.; Rahman T. S. A Molecule Carrier. Science 2007, 315, 1391–1393. [DOI] [PubMed] [Google Scholar]
- Mantooth B. A.; Sykes E. C. H.; Han P.; Moore A. M.; Donhauser Z. J.; Crespi V. H.; Weiss P. S. Analyzing the Motion of Benzene on Au{111}: Single Molecule Statistics from Scanning Probe Images. J. Phys. Chem. C 2007, 111, 6167–6182. [Google Scholar]
- Sykes E. C. H.; Mantooth B. A.; Han P.; Donhauser Z. J.; Weiss P. S. Substrate-Mediated Intermolecular Interactions: A Quantitative Single Molecule Analysis. J. Am. Chem. Soc. 2005, 127, 7255–7260. [DOI] [PubMed] [Google Scholar]
- Taranovskyy A.; Tansel T.; Magnussen O. M. Quantitative Measurements of Adsorbate-Adsorbate Interactions at Solid-Liquid Interfaces. Phys. Rev. Lett. 2010, 104, 106101-1-4. [DOI] [PubMed] [Google Scholar]
- Rost M. J.; van Baarle G. J. C.; Katan A. J.; van Spengen W. M.; Schakel R.; van Loo W. A.; Oosterkamp T. H.; Frenken J. W. M. Video-Rate Scanning Probe Control Challenges: Setting the Stage for a Microscopy Revolution. Asian J. Control 2009, 11, 110–129. [Google Scholar]
- Disseldorp E. C. M.; Tabak F. C.; Katan A. J.; Hesselberth M. B. S.; Oosterkamp T. H.; Frenken J. W. M.; van Spengen W. M. MEMS-Based High Speed Scanning Probe Microscopy. Rev. Sci. Instrum. 2010, 81, 043702-1-7. [DOI] [PubMed] [Google Scholar]
- Howe J. M.; Mori H.; Wang Z. L. In Situ High-Resolution Transmission Electron Microscopy in the Study of Nanomaterials and Properties. MRS Bull. 2008, 33, 115–121. [Google Scholar]
- Williamson M. J.; Tromp R. M.; Vereecken P. M.; Hull R.; Ross F. M. Dynamic Microscopy of Nanoscale Cluster Growth at the Solid−Liquid Interface. Nat. Mater. 2003, 2, 532–536. [DOI] [PubMed] [Google Scholar]
- Zheng H. M.; Claridge S. A.; Minor A. M.; Alivisatos A. P.; Dahmen U. Nanocrystal Diffusion in a Liquid Thin Film Observed by In Situ Transmission Electron Microscopy. Nano Lett. 2009, 9, 2460–2465. [DOI] [PubMed] [Google Scholar]
- Zheng H. M.; Smith R. K.; Jun Y. W.; Kisielowski C.; Dahmen U.; Alivisatos A. P. Observation of Single Colloidal Platinum Nanocrystal Growth Trajectories. Science 2009, 324, 1309–1312. [DOI] [PubMed] [Google Scholar]
- Balzani V.; Gomez-Lopez M.; Stoddart J. F. Molecular Machines. Acc. Chem. Res. 1998, 31, 405–414. [Google Scholar]
- Feringa B. L.; van Delden R. A.; Koumura N.; Geertsema E. M. Chiroptical Molecular Switches. Chem. Rev. 2000, 100, 1789–1816. [DOI] [PubMed] [Google Scholar]
- Kay E. R.; Leigh D. A.; Zerbetto F. Synthetic Molecular Motors and Mechanical Machines. Angew. Chem., Int. Ed. 2007, 46, 72–191. [DOI] [PubMed] [Google Scholar]
- van der Molen S. J.; Liljeroth P. Charge Transport through Molecular Switches. J. Phys.: Condens. Matter 2010, 22, 1–30. [DOI] [PubMed] [Google Scholar]
- Mantooth B. A.; Weiss P. S. Fabrication, Assembly, and Characterization of Molecular Electronic Components. Proc. IEEE 2003, 91, 1785–1802. [Google Scholar]
- Moore A. M.; Dameron A. A.; Mantooth B. A.; Smith R. K.; Fuchs D. J.; Ciszek J. W.; Maya F.; Yao Y. X.; Tour J. M.; Weiss P. S. Molecular Engineering and Measurements to Test Hypothesized Mechanisms in Single Molecule Conductance Switching. J. Am. Chem. Soc. 2006, 128, 1959–1967. [DOI] [PubMed] [Google Scholar]
- Moore A. M.; Mantooth B. A.; Donhauser Z. J.; Yao Y. X.; Tour J. M.; Weiss P. S. Real-Time Measurements of Conductance Switching and Motion of Single Oligo(phenylene ethynylene) Molecules. J. Am. Chem. Soc. 2007, 129, 10352–10353. [DOI] [PubMed] [Google Scholar]
- Moresco F.; Meyer G.; Rieder K. H.; Tang H.; Gourdon A.; Joachim C. Conformational Changes of Single Molecules Induced by Scanning Tunneling Microscopy Manipulation: A Route to Molecular Switching. Phys. Rev. Lett. 2001, 86, 672–675. [DOI] [PubMed] [Google Scholar]
- Loppacher C.; Guggisberg M.; Pfeiffer O.; Meyer E.; Bammerlin M.; Luthi R.; Schlittler R.; Gimzewski J. K.; Tang H.; Joachim C. Direct Determination of the Energy Required to Operate a Single Molecule Switch. Phys. Rev. Lett. 2003, 90, 066107-1-4. [DOI] [PubMed] [Google Scholar]
- Alemani M.; Peters M. V.; Hecht S.; Rieder K. H.; Moresco F.; Grill L. Electric Field-Induced Isomerization of Azobenzene by STM. J. Am. Chem. Soc. 2006, 128, 14446–14447. [DOI] [PubMed] [Google Scholar]
- Liljeroth P.; Repp J.; Meyer G. Current-Induced Hydrogen Tautomerization and Conductance Switching of Naphthalocyanine Molecules. Science 2007, 317, 1203–1206. [DOI] [PubMed] [Google Scholar]
- Ye T.; Kumar A. S.; Saha S.; Takami T.; Huang T. J.; Stoddart J. F.; Weiss P. S. Changing Stations in Single Bistable Rotaxane Molecules under Electrochemical Control. ACS Nano 2010, 4, 3697–3701. [DOI] [PubMed] [Google Scholar]
- Choi B. Y.; Kahng S. J.; Kim S.; Kim H.; Kim H. W.; Song Y. J.; Ihm J.; Kuk Y. Conformational Molecular Switch of the Azobenzene Molecule: A Scanning Tunneling Microscopy Study. Phys. Rev. Lett. 2006, 96, 156106-1-4. [DOI] [PubMed] [Google Scholar]
- Comstock M. J.; Levy N.; Kirakosian A.; Cho J. W.; Lauterwasser F.; Harvey J. H.; Strubbe D. A.; Frechet J. M. J.; Trauner D.; Louie S. G. Reversible Photomechanical Switching of Individual Engineered Molecules at a Metallic Surface. Phys. Rev. Lett. 2007, 99, 038301. [DOI] [PubMed] [Google Scholar]
- Comstock M. J.; Levy N.; Cho J.; Berbil-Bautista L.; Crommie M. F.; Poulsen D. A.; Frechet J. M. J. Measuring Reversible Photomechanical Switching Rates for a Molecule at a Surface. Appl. Phys. Lett. 2008, 92, 123107-1-3. [Google Scholar]
- Kumar A. S.; Ye T.; Takami T.; Yu B. C.; Flatt A. K.; Tour J. M.; Weiss P. S. Reversible Photo-Switching of Single Azobenzene Molecules in Controlled Nanoscale Environments. Nano Lett. 2008, 8, 1644–1648. [DOI] [PubMed] [Google Scholar]
- Yasuda R.; Noji H.; Kinosita K.; Yoshida M. F-1-ATPase Is a Highly Efficient Molecular Motor that Rotates with Discrete 120° Steps. Cell 1998, 93, 1117–1124. [DOI] [PubMed] [Google Scholar]
- Kottas G. S.; Clarke L. I.; Horinek D.; Michl J. Artificial Molecular Rotors. Chem. Rev. 2005, 105, 1281–1376. [DOI] [PubMed] [Google Scholar]
- Seldenthuis J. S.; Prins F.; Thijssen J. M.; van der Zant H. S. J. An All-Electric Single-Molecule Motor. ACS Nano 2010, 4, 6681–6686. [DOI] [PubMed] [Google Scholar]
- van Delden R. A.; ter Wiel M. K. J.; Pollard M. M.; Vicario J.; Koumura N.; Feringa B. L. Unidirectional Molecular Motor on a Gold Surface. Nature 2005, 437, 1337–1340. [DOI] [PubMed] [Google Scholar]
- Zheng X. L.; Mulcahy M. E.; Horinek D.; Galeotti F.; Magnera T. F.; Michl J. Dipolar and Nonpolar Altitudinal Molecular Rotors Mounted on an Au(111) Surface. J. Am. Chem. Soc. 2004, 126, 4540–4542. [DOI] [PubMed] [Google Scholar]
- Mulcahy M. E.; Magnera T. F.; Michl J. Molecular Rotors on Au(111): Rotator Orientation from IR Spectroscopy. J. Phys. Chem. C 2009, 113, 20698–20704. [Google Scholar]
- Gimzewski J. K.; Joachim C.; Schlittler R. R.; Langlais V.; Tang H.; Johannsen I. Rotation of a Single Molecule within a Supramolecular Bearing. Science 1998, 281, 531–533. [DOI] [PubMed] [Google Scholar]
- Stipe B. C.; Rezaei M. A.; Ho W. Inducing and Viewing the Rotational Motion of a Single Molecule. Science 1998, 279, 1907–1909. [DOI] [PubMed] [Google Scholar]
- Baber A. E.; Tierney H. L.; Sykes E. C. H. A Quantitative Single-Molecule Study of Thioether Molecular Rotors. ACS Nano 2008, 2, 2385–2391. [DOI] [PubMed] [Google Scholar]
- Jewell A. D.; Tierney H. L.; Baber A. E.; Iski E. V.; Laha M. M.; Sykes E. C. H. Time-Resolved Studies of Individual Molecular Rotors. J. Phys.: Condens. Matter 2010, 22, 264006-1-11. [DOI] [PubMed] [Google Scholar]
- Chiaravalloti F.; Gross L.; Rieder K. H.; Stojkovic S. M.; Gourdon A.; Joachim C.; Moresco F. A Rack-and-Pinion Device at the Molecular Scale. Nat. Mater. 2007, 6, 30–33. [DOI] [PubMed] [Google Scholar]
- Manzano C.; Soe W. H.; Wong H. S.; Ample F.; Gourdon A.; Chandrasekhar N.; Joachim C. Step-by-Step Rotation of a Molecule-Gear Mounted on an Atomic-Scale Axis. Nat. Mater. 2009, 8, 576–579. [DOI] [PubMed] [Google Scholar]
- Stipe B. C.; Rezaei M. A.; Ho W. Coupling of Vibrational Excitation to the Rotational Motion of a Single Adsorbed Molecule. Phys. Rev. Lett. 1998, 81, 1263–1266. [Google Scholar]
- Sainoo Y.; Kim Y.; Okawa T.; Komeda T.; Shigekawa H.; Kawai M. Excitation of Molecular Vibrational Modes with Inelastic Scanning Tunneling Microscopy Processes: Examination through Action Spectra of cis-2-Butene on Pd(110). Phys. Rev. Lett. 2005, 95, 246102-1-4. [DOI] [PubMed] [Google Scholar]
- Hliwa M.; Ami S.; Joachim C. A 3-Terminal Single Molecule Nanoscale Amperometer. Chem. Phys. Lett. 2006, 425, 356–360. [Google Scholar]
- Scott G. D.; Natelson D. Kondo Resonances in Molecular Devices. ACS Nano 2010, 4, 3560–3579. [DOI] [PubMed] [Google Scholar]
- Joachim C.; Gimzewski J. K.; Schlittler R. R.; Chavy C. Electronic Transparency of a Single C60 Molecule. Phys. Rev. Lett. 1995, 74, 2102–2105. [DOI] [PubMed] [Google Scholar]
- Nitzan A.; Ratner M. A. Electron Transport in Molecular Wire Junctions. Science 2003, 300, 1384–1389. [DOI] [PubMed] [Google Scholar]
- Ulgut B.; Abruna H. D. Electron Transfer through Molecules and Assemblies at Electrode Surfaces. Chem. Rev. 2008, 108, 2721–2736. [DOI] [PubMed] [Google Scholar]
- Su W. P.; Schrieffer J. R.; Heeger A. J. Solitons in Polyacetylene. Phys. Rev. Lett. 1979, 42, 1698–1701. [Google Scholar]
- Aviram A.; Ratner M. A. Molecular Rectifiers. Chem. Phys. Lett. 1974, 29, 277–283. [Google Scholar]
- Park H.; Park J.; Lim A. K. L.; Anderson E. H.; Alivisatos A. P.; McEuen P. L. Nanomechanical Oscillations in a Single-C60 Transistor. Nature 2000, 407, 57–60. [DOI] [PubMed] [Google Scholar]
- Lu W.; Lieber C. M. Nanoelectronics from the Bottom Up. Nat. Mater. 2007, 6, 841–850. [DOI] [PubMed] [Google Scholar]
- Feldman A. K.; Steigerwald M. L.; Guo X. F.; Nuckolls C. Molecular Electronic Devices Based on Single-Walled Carbon Nanotube Electrodes. Acc. Chem. Res. 2008, 41, 1731–1741. [DOI] [PubMed] [Google Scholar]
- Haick H.; Cahen D. Making Contact: Connecting Molecules Electrically to the Macroscopic World. Prog. Surf. Sci. 2008, 83, 217–261. [Google Scholar]
- Chen F.; Tao N. J. Electron Transport in Single Molecules: From Benzene to Graphene. Acc. Chem. Res. 2009, 42, 429–438. [DOI] [PubMed] [Google Scholar]
- Xiao X. Y.; Xu B. Q.; Tao N. J. Measurement of Single Molecule Conductance: Benzenedithiol and Benzenedimethanethiol. Nano Lett. 2004, 4, 267–271. [Google Scholar]
- Chen F.; Li X. L.; Hihath J.; Huang Z. F.; Tao N. J. Effect of Anchoring Groups on Single-Molecule Conductance: Comparative Study of Thiol-, Amine-, and Carboxylic-Acid-Terminated Molecules. J. Am. Chem. Soc. 2006, 128, 15874–15881. [DOI] [PubMed] [Google Scholar]
- Brandbyge M.; Schiotz J.; Sorensen M. R.; Stoltze P.; Jacobsen K. W.; Norskov J. K.; Olesen L.; Laegsgaard E.; Stensgaard I.; Besenbacher F. Quantized Conductance in Atom-Sized Wires between Two Metals. Phys. Rev. B 1995, 52, 8499–8514. [DOI] [PubMed] [Google Scholar]
- Xu B. Q.; Tao N. J. J. Measurement of Single-Molecule Resistance by Repeated Formation of Molecular Junctions. Science 2003, 301, 1221–1223. [DOI] [PubMed] [Google Scholar]
- Pascual J. I.; Mendez J.; Gomezherrero J.; Baro A. M.; Garcia N.; Binh V. T. Quantum Contact in Gold Nanostructures by Scanning-Tunneling-Microscopy. Phys. Rev. Lett. 1993, 71, 1852–1855. [DOI] [PubMed] [Google Scholar]
- Krans J. M.; Vanruitenbeek J. M.; Fisun V. V.; Yanson I. K.; Dejongh L. J. The Signature of Conductance Quantization in Metallic Point Contacts. Nature 1995, 375, 767–769. [Google Scholar]
- Li X. L.; He J.; Hihath J.; Xu B. Q.; Lindsay S. M.; Tao N. J. Conductance of Single Alkanedithiols: Conduction Mechanism and Effect of Molecule−Electrode Contacts. J. Am. Chem. Soc. 2006, 128, 2135–2141. [DOI] [PubMed] [Google Scholar]
- Kamenetska M.; Koentopp M.; Whalley A. C.; Park Y. S.; Steigerwald M. L.; Nuckolls C.; Hybertsen M. S.; Venkataraman L. Formation and Evolution of Single-Molecule Junctions. Phys. Rev. Lett. 2009, 102, 126803-1-4. [DOI] [PubMed] [Google Scholar]
- Zhou C.; Muller C. J.; Deshpande M. R.; Sleight J. W.; Reed M. A. Microfabrication of a Mechanically Controllable Break Junction in Silicon. Appl. Phys. Lett. 1995, 67, 1160–1162. [Google Scholar]
- Park H.; Lim A. K. L.; Alivisatos A. P.; Park J.; McEuen P. L. Fabrication of Metallic Electrodes with Nanometer Separation by Electromigration. Appl. Phys. Lett. 1999, 75, 301–303. [Google Scholar]
- Park J.; Pasupathy A. N.; Goldsmith J. I.; Chang C.; Yaish Y.; Petta J. R.; Rinkoski M.; Sethna J. P.; Abruna H. D.; McEuen P. L.; et al. Coulomb Blockade and the Kondo Effect in Single-Atom Transistors. Nature 2002, 417, 722–725. [DOI] [PubMed] [Google Scholar]
- Liang W. J.; Shores M. P.; Bockrath M.; Long J. R.; Park H. Kondo Resonance in a Single-Molecule Transistor. Nature 2002, 417, 725–729. [DOI] [PubMed] [Google Scholar]
- Joachim C.; Martrou D.; Rezeq M.; Troadec C.; Jie D.; Chandrasekhar N.; Gauthier S. Multiple Atomic Scale Solid Surface Interconnects for Atom Circuits and Molecule Logic Gates. J. Phys.: Condens. Matter 2010, 22, 084025-1-18. [DOI] [PubMed] [Google Scholar]
- Wang W. Y.; Lee T.; Kretzschmar I.; Reed M. A. Inelastic Electron Tunneling Spectroscopy of an Alkanedithiol Self-Assembled Monolayer. Nano Lett. 2004, 4, 643–646. [Google Scholar]
- Kushmerick J. G.; Holt D. B.; Yang J. C.; Naciri J.; Moore M. H.; Shashidhar R. Metal-Molecule Contacts and Charge Transport across Monomolecular Layers: Measurement and Theory. Phys. Rev. Lett. 2002, 89, 086802-1-4. [DOI] [PubMed] [Google Scholar]
- Kushmerick J. G.; Lazorcik J.; Patterson C. H.; Shashidhar R.; Seferos D. S.; Bazan G. C. Vibronic Contributions to Charge Transport across Molecular Junctions. Nano Lett. 2004, 4, 639–642. [Google Scholar]
- Hansma P. K. Inelastic Electron-Tunneling. Phys. Rep. 1977, 30, 145–206. [Google Scholar]
- Lauhon L. J.; Ho W. Single-Molecule Vibrational Spectroscopy and Microscopy: Co on Cu(001) and Cu(110). Phys. Rev. B 1999, 60, R8525–R8528. [Google Scholar]
- Lorente N.; Persson M.; Lauhon L. J.; Ho W. Symmetry Selection Rules for Vibrationally Inelastic Tunneling. Phys. Rev. Lett. 2001, 86, 2593–2596. [DOI] [PubMed] [Google Scholar]
- Blake M. M.; Nanayakkara S. U.; Claridge S. A.; Fernandez-Torres L. C.; Sykes E. C. H.; Weiss P. S. Identifying Reactive Intermediates in the Ullmann Coupling Reaction by Scanning Tunneling Microscopy and Spectroscopy. J. Phys. Chem. A 2009, 113, 13167–13172. [DOI] [PubMed] [Google Scholar]
- Pascual J. I.; Jackiw J. J.; Song Z.; Weiss P. S.; Conrad H.; Rust H. P. Adsorbate−Substrate Vibrational Modes of Benzene on Ag(110) Resolved with Scanning Tunneling Spectroscopy. Phys. Rev. Lett. 2001, 86, 1050–1053. [DOI] [PubMed] [Google Scholar]
- Kim Y.; Komeda T.; Kawai M. Single-Molecule Reaction and Characterization by Vibrational Excitation. Phys. Rev. Lett. 2002, 89, 126104-1-4. [DOI] [PubMed] [Google Scholar]
- Berndt R.; Gimzewski J. K.; Johansson P. Inelastic Tunneling Excitation of Tip-Induced Plasmon Modes on Noble-Metal Surfaces. Phys. Rev. Lett. 1991, 67, 3796–3799. [DOI] [PubMed] [Google Scholar]
- Berndt R.; Schlittler R. R.; Gimzewski J. K. Photon-Emission Scanning Tunneling Microscope. J. Vac. Sci. Technol., B 1991, 9, 573–577. [Google Scholar]
- McCarty G. S.; Weiss P. S. Scanning Probe Studies of Single Nanostructures. Chem. Rev. 1999, 99, 1983–1990. [DOI] [PubMed] [Google Scholar]
- Cyr D. M.; Venkataraman B.; Flynn G. W.; Black A.; Whitesides G. M. Functional Group Identification in Scanning Tunneling Microscopy of Molecular Adsorbates. J. Phys. Chem. 1996, 100, 13747–13759. [Google Scholar]
- Moore A. M.; Yeganah S.; Yao Y.; Claridge S. A.; Tour J. M.; Ratner M. A.; Weiss P. S. Polarizabilities of Adsorbed and Assembled Molecules: Measuring the Conductance through Buried Contacts. ACS Nano 2010, 4, 7630–7636. [DOI] [PMC free article] [PubMed] [Google Scholar]
- Hirai M.; Yamanaka C.; Ikeya M. Some Trials on a New Method of ESR Detection Using Tunneling Current. Appl. Radiat. Isot. 1993, 44, 385–389. [Google Scholar]
- Manassen Y.; Hamers R. J.; Demuth J. E.; Castellano A. J. Direct Observation of the Precession of Individual Paramagnetic Spins on Oxidized Silicon Surfaces. Phys. Rev. Lett. 1989, 62, 2531–2534. [DOI] [PubMed] [Google Scholar]
- Manassen Y. Real-Time Response and Phase-Sensitive Detection to Demonstrate the Validity of ESR-STM Results. J. Magn. Reson. 1997, 126, 133–137. [DOI] [PubMed] [Google Scholar]
- Durkan C.; Welland M. E. Electronic Spin Detection in Molecules Using Scanning-Tunneling-Microscopy-Assisted Electron-Spin Resonance. Appl. Phys. Lett. 2002, 80, 458–460. [Google Scholar]
- Messina P.; Mannini M.; Caneschi A.; Gatteschi D.; Sorace L.; Sigalotti P.; Sandrin C.; Prato S.; Pittana P.; Manassen Y. Spin Noise Fluctuations from Paramagnetic Molecular Adsorbates on Surfaces. J. Appl. Phys. 2007, 101, 053916-1-14. [Google Scholar]
- Mugnaini V.; Fabrizioli M.; Ratera I.; Mannini M.; Caneschi A.; Gatteschi D.; Manassen Y.; Veciana J. Towards the Detection of Single Polychlorotriphenylmethyl Radical Derivatives by Means of Electron Spin Noise STM. Solid State Sci. 2009, 11, 956–960. [Google Scholar]
- Gorini L.; Fabrizioli M.; Mannini M.; Sorace L.; Yakovenko A. Addressing Single Molecules of a Thin Magnetic Film. Inorg. Chim. Acta 2008, 361, 4089–4093. [Google Scholar]
- Wiesendanger R. Spin Mapping at the Nanoscale and Atomic Scale. Rev. Mod. Phys. 2009, 81, 1495–1550. [Google Scholar]
- Loth S.; Etzkorn M.; Lutz C. P.; Eigler D. M.; Heinrich A. J. Measurement of Fast Electron Spin Relaxation Times with Atomic Resolution. Science 2010, 329, 1628–1630. [DOI] [PubMed] [Google Scholar]
- Brede J.; Atodiresei N.; Kuck S.; Lazic P.; Caciuc V.; Morikawa Y.; Hoffmann G.; Blugel S.; Wiesendanger R. Spin- and Energy-Dependent Tunneling through a Single Molecule with Intramolecular Spatial Resolution. Phys. Rev. Lett. 2010, 105, 047204-1-4. [DOI] [PubMed] [Google Scholar]
- Atodiresei N.; Brede J.; Lazic P.; Caciuc V.; Hoffmann G.; Wiesendanger R.; Blugel S. Design of the Local Spin Polarization at the Organic-Ferromagnetic Interface. Phys. Rev. Lett. 2010, 105, 066601-1-4. [DOI] [PubMed] [Google Scholar]
- Tinnefeld P.; Sauer M. Branching out of Single-Molecule Fluorescence Spectroscopy: Challenges for Chemistry and Influence on Biology. Angew. Chem., Int. Ed. 2005, 44, 2642–2671. [DOI] [PubMed] [Google Scholar]
- Alivisatos P. The Use of Nanocrystals in Biological Detection. Nat. Biotechnol. 2004, 22, 47–52. [DOI] [PubMed] [Google Scholar]
- Gaiduk A.; Yorulmaz M.; Ruijgrok P. V.; Orrit M. Room-Temperature Detection of a Single Molecule’s Absorption by Photothermal Contrast. Science 2010, 330, 353–356. [DOI] [PubMed] [Google Scholar]
- Chong S. S.; Min W.; Xie X. S. Ground-State Depletion Microscopy: Detection Sensitivity of Single-Molecule Optical Absorption at Room Temperature. J. Phys. Chem. Lett. 2010, 1, 3316–3322. [Google Scholar]
- Kukura P.; Celebrano M.; Renn A.; Sandoghdar V. Single-Molecule Sensitivity in Optical Absorption at Room Temperature. J. Phys. Chem. Lett. 2010, 1, 3323–3327. [Google Scholar]
- Lu Z. J.; Lu J. Z.; Wu Y. Q.; Chen L. Y. Introduction to Theories of Several Super-Resolution Fluorescence Microscopy Methods and Recent Advance in the Field. Prog. Biochem. Biophys. 2009, 36, 1626–1634. [Google Scholar]
- Mujumdar R. B.; Ernst L. A.; Mujumdar S. R.; Lewis C. J.; Waggoner A. S. Cyanine Dye Labeling Reagents—Sulfoindocyanine Succinimidyl Esters. Bioconjugate Chem. 1993, 4, 105–111. [DOI] [PubMed] [Google Scholar]
- Kubin R. F.; Fletcher A. N. Fluorescence Quantum Yields of Some Rhodamine Dyes. J. Luminesc. 1982, 27, 455–462. [Google Scholar]
- Periasamy A., Ed. Methods in Cellular Imaging; Oxford University Press: Oxford, 2001. [Google Scholar]
- Andersen F. F.; Stougaard M.; Jorgensen H. L.; Bendsen S.; Juul S.; Hald K.; Andersen A. H.; Koch J.; Knudsen B. R. Multiplexed Detection of Site Specific Recombinase and DNA Topoisomerase Activities at the Single Molecule Level. ACS Nano 2009, 3, 4043–4054. [DOI] [PubMed] [Google Scholar]
- Gelles J.; Schnapp B. J.; Sheetz M. P. Tracking Kinesin-Driven Movements with Nanometre-Scale Precision. Nature 1988, 331, 450–453. [DOI] [PubMed] [Google Scholar]
- Sheetz M. P.; Turney S.; Qian H.; Elson E. L. Nanometer-Level Analysis Demonstrates That Lipid Flow Does Not Drive Membrane Glycoprotein Movements. Nature 1989, 340, 284–288. [DOI] [PubMed] [Google Scholar]
- Kusumi A.; Nakada C.; Ritchie K.; Murase K.; Suzuki K.; Murakoshi H.; Kasai R. S.; Kondo J.; Fujiwara T. Paradigm Shift of the Plasma Membrane Concept from the Two-Dimensional Continuum Fluid to the Partitioned Fluid: High-Speed Single-Molecule Tracking of Membrane Molecules. Annu. Rev. Biophys. Biomol. Struct. 2005, 34, 351–378. [DOI] [PubMed] [Google Scholar]
- Yildiz A.; Selvin P. R. Fluorescence Imaging with One Nanometer Accuracy: Application to Molecular Motors. Acc. Chem. Res. 2005, 38, 574–582. [DOI] [PubMed] [Google Scholar]
- Kim S. Y.; Gitai Z.; Kinkhabwala A.; Shapiro L.; Moerner W. E. Single Molecules of the Bacterial Actin MreB Undergo Directed Treadmilling Motion in Caulobacter Crescentus. Proc. Natl. Acad. Sci. U.S.A. 2006, 103, 10929–10934. [DOI] [PMC free article] [PubMed] [Google Scholar]
- Hell S. W.; Wichmann J. Breaking the Diffraction Resolution Limit by Stimulated-Emission—Stimulated-Emission-Depletion Fluorescence Microscopy. Opt. Lett. 1994, 19, 780–782. [DOI] [PubMed] [Google Scholar]
- Donnert G.; Keller J.; Medda R.; Andrei M. A.; Rizzoli S. O.; Lurmann R.; Jahn R.; Eggeling C.; Hell S. W. Macromolecular-Scale Resolution in Biological Fluorescence Microscopy. Proc. Natl. Acad. Sci. U.S.A. 2006, 103, 11440–11445. [DOI] [PMC free article] [PubMed] [Google Scholar]
- Gustafsson M. G. L. Nonlinear Structured-Illumination Microscopy: Wide-Field Fluorescence Imaging with Theoretically Unlimited Resolution. Proc. Natl. Acad. Sci. U.S.A. 2005, 102, 13081–13086. [DOI] [PMC free article] [PubMed] [Google Scholar]
- Betzig E.; Chichester R. J. Single Molecules Observed by Near-Field Scanning Optical Microscopy. Science 1993, 262, 1422–1425. [DOI] [PubMed] [Google Scholar]
- Kim J.; Song K. B. Recent Progress of Nano-Technology with NSOM. Micron 2007, 38, 409–426. [DOI] [PubMed] [Google Scholar]
- Dickenson N. E.; Armendariz K. P.; Huckabay H. A.; Livanec P. W.; Dunn R. C. Near-Field Scanning Optical Microscopy: A Tool for Nanometric Exploration of Biological Membranes. Anal. Bioanal. Chem. 2010, 396, 31–43. [DOI] [PubMed] [Google Scholar]
- Eggeling C.; Ringemann C.; Medda R.; Schwarzmann G.; Sandhoff K.; Polyakova S.; Belov V. N.; Hein B.; von Middendorff C.; Schonle A.; et al. Direct Observation of the Nanoscale Dynamics of Membrane Lipids in a Living Cell. Nature 2009, 457, 1159–1163. [DOI] [PubMed] [Google Scholar]
- Sahl S. J.; Leutenegger M.; Hilbert M.; Hell S. W.; Eggeling C. Fast Molecular Tracking Maps Nanoscale Dynamics of Plasma Membrane Lipids. Proc. Natl. Acad. Sci. U.S.A. 2010, 107, 6829–6834. [DOI] [PMC free article] [PubMed] [Google Scholar]
- Betzig E.; Patterson G. H.; Sougrat R.; Lindwasser O. W.; Olenych S.; Bonifacino J. S.; Davidson M. W.; Lippincott-Schwartz J.; Hess H. F. Imaging Intracellular Fluorescent Proteins at Nanometer Resolution. Science 2006, 313, 1642–1645. [DOI] [PubMed] [Google Scholar]
- Hess S. T.; Girirajan T. P. K.; Mason M. D. Ultra-High Resolution Imaging by Fluorescence Photoactivation Localization Microscopy. Biophys. J. 2006, 91, 4258–4272. [DOI] [PMC free article] [PubMed] [Google Scholar]
- Rust M. J.; Bates M.; Zhuang X. W. Sub-Diffraction-Limit Imaging by Stochastic Optical Reconstruction Microscopy (STORM). Nat. Methods 2006, 3, 793–795. [DOI] [PMC free article] [PubMed] [Google Scholar]
- Bates M.; Huang B.; Dempsey G. T.; Zhuang X. W. Multicolor Super-Resolution Imaging with Photo-Switchable Fluorescent Probes. Science 2007, 317, 1749–1753. [DOI] [PMC free article] [PubMed] [Google Scholar]
- Shroff H.; Galbraith C. G.; Galbraith J. A.; Betzig E. Live-Cell Photoactivated Localization Microscopy of Nanoscale Adhesion Dynamics. Nat. Methods 2008, 5, 417–423. [DOI] [PMC free article] [PubMed] [Google Scholar]
- Huang B.; Wang W. Q.; Bates M.; Zhuang X. W. Three-Dimensional Super-Resolution Imaging by Stochastic Optical Reconstruction Microscopy. Science 2008, 319, 810–813. [DOI] [PMC free article] [PubMed] [Google Scholar]
- Manley S.; Gillette J. M.; Patterson G. H.; Shroff H.; Hess H. F.; Betzig E.; Lippincott-Schwartz J. High-Density Mapping of Single-Molecule Trajectories with Photoactivated Localization Microscopy. Nat. Methods 2008, 5, 155–157. [DOI] [PubMed] [Google Scholar]
- Sonnichsen C.; Reinhard B. M.; Liphardt J.; Alivisatos A. P. A Molecular Ruler Based on Plasmon Coupling of Single Gold and Silver Nanoparticles. Nat. Biotechnol. 2005, 23, 741–745. [DOI] [PubMed] [Google Scholar]
- Reinhard B. M.; Sheikholeslami S.; Mastroianni A.; Alivisatos A. P.; Liphardt J. Use of Plasmon Coupling to Reveal the Dynamics of DNA Bending and Cleavage by Single EcoRV Restriction Enzymes. Proc. Natl. Acad. Sci. U.S.A. 2007, 104, 2667–2672. [DOI] [PMC free article] [PubMed] [Google Scholar]
- Bonnell D. A.Scanning Probe Microscopy and Spectroscopy: Theory, Techniques, and Applications; Wiley: New York, 2001. [Google Scholar]
- Reinhard B. M.; Siu M.; Agarwal H.; Alivisatos A. P.; Liphardt J. Calibration of a Dynamic Molecular Ruler Based on Plasmon Coupling between Gold Nanoparticles. Nano Lett. 2005, 5, 2246–2252. [DOI] [PubMed] [Google Scholar]
- Stryer L.; Haugland R. P. Energy Transfer—A Spectroscopic Ruler. Proc. Natl. Acad. Sci. U.S.A. 1967, 58, 719–726. [DOI] [PMC free article] [PubMed] [Google Scholar]
- Kapanidis A. N.; Lee N. K.; Laurence T. A.; Doose S.; Margeat E.; Weiss S. Fluorescence-Aided Molecule Sorting: Analysis of Structure and Interactions by Alternating-Laser Excitation of Single Molecules. Proc. Natl. Acad. Sci. U.S.A. 2004, 101, 8936–8941. [DOI] [PMC free article] [PubMed] [Google Scholar]
- Deniz A. A.; Laurence T. A.; Beligere G. S.; Dahan M.; Martin A. B.; Chemla D. S.; Dawson P. E.; Schultz P. G.; Weiss S. Single-Molecule Protein Folding: Diffusion Fluorescence Resonance Energy Transfer Studies of the Denaturation of Chymotrypsin Inhibitor 2. Proc. Natl. Acad. Sci. U.S.A. 2000, 97, 5179–5184. [DOI] [PMC free article] [PubMed] [Google Scholar]
- Schuler B.; Lipman E. A.; Eaton W. A. Probing the Free-Energy Surface for Protein Folding with Single-Molecule Fluorescence Spectroscopy. Nature 2002, 419, 743–747. [DOI] [PubMed] [Google Scholar]
- Kuzmenkina E. V.; Heyes C. D.; Nienhaus G. U. Single-Molecule Forster Resonance Energy Transfer Study of Protein Dynamics under Denaturing Conditions. Proc. Natl. Acad. Sci. U.S.A. 2005, 102, 15471–15476. [DOI] [PMC free article] [PubMed] [Google Scholar]
- Majumdar D. S.; Smirnova I.; Kasho V.; Nir E.; Kong X. X.; Weiss S.; Kaback H. R. Single-Molecule FRET Reveals Sugar-Induced Conformational Dynamics in LacY. Proc. Natl. Acad. Sci. U.S.A. 2007, 104, 12640–12645. [DOI] [PMC free article] [PubMed] [Google Scholar]
- Jun Y. W.; Sheikholeslami S.; Hostetter D. R.; Tajon C.; Craik C. S.; Alivisatos A. P. Continuous Imaging of Plasmon Rulers in Live Cells Reveals Early-Stage Caspase-3 Activation at the Single-Molecule Level. Proc. Natl. Acad. Sci. U.S.A. 2009, 106, 17735–17740. [DOI] [PMC free article] [PubMed] [Google Scholar]
- Gradinaru C. C.; Marushchak D. O.; Samim M.; Krull U. J. Fluorescence Anisotropy: From Single Molecules to Live Cells. Analyst 2010, 135, 452–459. [DOI] [PubMed] [Google Scholar]
- Moerner W. E.; Fromm D. P. Methods of Single-Molecule Fluorescence Spectroscopy and Microscopy. Rev. Sci. Instrum. 2003, 74, 3597–3619. [Google Scholar]
- Ruiter A. G. T.; Veerman J. A.; Garcia Parajo M. F.; van Hulst N. F. Single Molecule Rotational and Translational Diffusion Observed by Near-Field Scanning Optical Microscopy. J. Phys. Chem. A 1997, 101, 7318–7323. [Google Scholar]
- Sosa H.; Peterman E. J. G.; Moerner W. E.; Goldstein L. S. B. ADP-Induced Rocking of the Kinesin Motor Domain Revealed by Single-Molecule Fluorescence Polarization Microscopy. Nat. Struct. Mol. Biol. 2001, 8, 540–544. [DOI] [PubMed] [Google Scholar]
- Forkey J. N.; Quinlan M. E.; Shaw M. A.; Corrie J. E. T.; Goldman Y. E. Three-Dimensional Structural Dynamics of Myosin V by Single-Molecule Fluorescence Polarization. Nature 2003, 422, 399–404. [DOI] [PubMed] [Google Scholar]
- Noji H.; Yasuda R.; Yoshida M.; Kinosita K. Direct Observation of the Rotation of F-1-ATPase. Nature 1997, 386, 299–302. [DOI] [PubMed] [Google Scholar]
- Adachi K.; Yasuda R.; Noji H.; Itoh H.; Harada Y.; Yoshida M.; Kinosita K. Stepping Rotation of F-1-ATPase Visualized through Angle-Resolved Single-Fluorophore Imaging. Proc. Natl. Acad. Sci. U.S.A. 2000, 97, 7243–7247. [DOI] [PMC free article] [PubMed] [Google Scholar]
- Gutierrez-Medina B.; Fehr A. N.; Block S. M. Direct Measurements of Kinesin Torsional Properties Reveal Flexible Domains and Occasional Stalk Reversals During Stepping. Proc. Natl. Acad. Sci. U.S.A. 2009, 106, 17007–17012. [DOI] [PMC free article] [PubMed] [Google Scholar]
- Ferraro J. R.Introductory Raman Spectroscopy; Academic Press: New York, 1994. [Google Scholar]
- Kneipp K.; Kneipp H.; Itzkan I.; Dasari R. R.; Feld M. S. Ultrasensitive Chemical Analysis by Raman Spectroscopy. Chem. Rev. 1999, 99, 2957–2975. [DOI] [PubMed] [Google Scholar]
- Moskovits M. Surface-Enhanced Spectroscopy. Rev. Mod. Phys. 1985, 57, 783–826. [Google Scholar]
- Bailo E.; Deckert V. Tip-Enhanced Raman Scattering. Chem. Soc. Rev. 2008, 37, 921–930. [DOI] [PubMed] [Google Scholar]
- Qian X. M.; Nie S. M. Single-Molecule and Single-Nanoparticle SERS: From Fundamental Mechanisms to Biomedical Applications. Chem. Soc. Rev. 2008, 37, 912–920. [DOI] [PubMed] [Google Scholar]
- Michaels A. M.; Jiang J.; Brus L. Ag Nanocrystal Junctions as the Site for Surface-Enhanced Raman Scattering of Single Rhodamine 6G Molecules. J. Phys. Chem. B 2000, 104, 11965–11971. [Google Scholar]
- Brus L. Noble Metal Nanocrystals: Plasmon Electron Transfer Photochemistry and Single-Molecule Raman Spectroscopy. Acc. Chem. Res. 2008, 41, 1742–1749. [DOI] [PubMed] [Google Scholar]
- Nie S. M.; Emery S. R. Probing Single Molecules and Single Nanoparticles by Surface-Enhanced Raman Scattering. Science 1997, 275, 1102–1106. [DOI] [PubMed] [Google Scholar]
- Kneipp K.; Wang Y.; Kneipp H.; Perelman L. T.; Itzkan I.; Dasari R.; Feld M. S. Single Molecule Detection Using Surface-Enhanced Raman Scattering (SERS). Phys. Rev. Lett. 1997, 78, 1667–1670. [Google Scholar]
- Dieringer J. A.; Lettan R. B.; Scheidt K. A.; Van Duyne R. P. A Frequency Domain Existence Proof of Single-Molecule Surface-Enhanced Raman Spectroscopy. J. Am. Chem. Soc. 2007, 129, 16249–16256. [DOI] [PubMed] [Google Scholar]
- Bailo E.; Deckert V. Tip-Enhanced Raman Spectroscopy of Single RNA Strands: Towards a Novel Direct-Sequencing Method. Angew. Chem., Int. Ed. 2008, 47, 1658–1661. [DOI] [PubMed] [Google Scholar]
- Yeo B. S.; Madler S.; Schmid T.; Zhang W. H.; Zenobi R. Tip-Enhanced Raman Spectroscopy Can See More: The Case of Cytochrome c. J. Phys. Chem. C 2008, 112, 4867–4873. [Google Scholar]
- Zhang J.; Campbell R. E.; Ting A. Y.; Tsien R. Y. Creating New Fluorescent Probes for Cell Biology. Nat. Rev. Mol. Cell Biol. 2002, 3, 906–918. [DOI] [PubMed] [Google Scholar]
- Brasselet S.; Peterman E. J. G.; Miyawaki A.; Moerner W. E. Single-Molecule Fluorescence Resonant Energy Transfer in Calcium Concentration Dependent Cameleon. J. Phys. Chem. B 2000, 104, 3676–3682. [Google Scholar]
- Yang H.; Luo G. B.; Karnchanaphanurach P.; Louie T. M.; Rech I.; Cova S.; Xun L. Y.; Xie X. S. Protein Conformational Dynamics Probed by Single-Molecule Electron Transfer. Science 2003, 302, 262–266. [DOI] [PubMed] [Google Scholar]
- Kou S. C.; Xie X. S. Generalized Langevin Equation with Fractional Gaussian Noise: Subdiffusion within a Single Protein Molecule. Phys. Rev. Lett. 2004, 93, 180603-1-4. [DOI] [PubMed] [Google Scholar]
- Kohler J.; Disselhorst J.; Donckers M.; Groenen E. J. J.; Schmidt J.; Moerner W. E. Magnetic-Resonance of a Single Molecular Spin. Nature 1993, 363, 242–244. [Google Scholar]
- Wrachtrup J.; Vonborczyskowski C.; Bernard J.; Orrit M.; Brown R. Optical-Detection of Magnetic-Resonance in a Single Molecule. Nature 1993, 363, 244–245. [Google Scholar]
- Gruber A.; Drabenstedt A.; Tietz C.; Fleury L.; Wrachtrup J.; von Borczyskowski C. Scanning Confocal Optical Microscopy and Magnetic Resonance on Single Defect Centers. Science 1997, 276, 2012–2014. [Google Scholar]
- Prawer S.; Greentree A. D. Diamond for Quantum Computing. Science 2008, 320, 1601–1602. [DOI] [PubMed] [Google Scholar]
- Childress L.; Dutt M. V. G.; Taylor J. M.; Zibrov A. S.; Jelezko F.; Wrachtrup J.; Hemmer P. R.; Lukin M. D. Coherent Dynamics of Coupled Electron and Nuclear Spin Qubits in Diamond. Science 2006, 314, 281–285. [DOI] [PubMed] [Google Scholar]
- Jiang L.; Hodges J. S.; Maze J. R.; Maurer P.; Taylor J. M.; Cory D. G.; Hemmer P. R.; Walsworth R. L.; Yacoby A.; Zibrov A. S.; et al. Repetitive Readout of a Single Electronic Spin via Quantum Logic with Nuclear Spin Ancillae. Science 2009, 326, 267–272. [DOI] [PubMed] [Google Scholar]
- Neumann P.; Beck J.; Steiner M.; Rempp F.; Fedder H.; Hemmer P. R.; Wrachtrup J.; Jelezko F. Single-Shot Readout of a Single Nuclear Spin. Science 2010, 329, 542–544. [DOI] [PubMed] [Google Scholar]
- Balasubramanian G.; Chan I. Y.; Kolesov R.; Al-Hmoud M.; Tisler J.; Shin C.; Kim C.; Wojcik A.; Hemmer P. R.; Krueger A.; et al. Nanoscale Imaging Magnetometry with Diamond Spins under Ambient Conditions. Nature 2008, 455, 648–652. [DOI] [PubMed] [Google Scholar]
- Giessibl F. J. Advances in Atomic Force Microscopy. Rev. Mod. Phys. 2003, 75, 949–983. [Google Scholar]
- Crampton N.; Brockwell D. J. Unravelling the Design Principles for Single Protein Mechanical Strength. Curr. Opin. Struct. Biol. 2010, 20, 508–517. [DOI] [PubMed] [Google Scholar]
- Sugimoto Y.; Pou P.; Abe M.; Jelinek P.; Perez R.; Morita S.; Custance O. Chemical Identification of Individual Surface Atoms by Atomic Force Microscopy. Nature 2007, 446, 64–67. [DOI] [PubMed] [Google Scholar]
- Ashino M.; Wiesendanger R.; Khlobystov A. N.; Berber S.; Tomanek D. Revealing Subsurface Vibrational Modes by Atom-Resolved Damping Force Spectroscopy. Phys. Rev. Lett. 2009, 102, 195503-1-4. [DOI] [PubMed] [Google Scholar]
- Hinterdorfer P.; Dufrene Y. F. Detection and Localization of Single Molecular Recognition Events Using Atomic Force Microscopy. Nat. Methods 2006, 3, 347–355. [DOI] [PubMed] [Google Scholar]
- Francius G.; Lebeer S.; Alsteens D.; Wildling L.; Gruber H. J.; Hols P.; De Keersmaecker S.; Vanderleyden J.; Dufrene Y. F. Detection, Localization, and Conformational Analysis of Single Polysaccharide Molecules on Live Bacteria. ACS Nano 2008, 2, 1921–1929. [DOI] [PubMed] [Google Scholar]
- Ebner A.; Kienberger F.; Kada G.; Stroh C. M.; Geretschlager M.; Kamruzzahan A. S. M.; Wildling L.; Johnson W. T.; Ashcroft B.; Nelson J.; et al. Localization of Single Avidin−Biotin Interactions Using Simultaneous Topography and Molecular Recognition Imaging. ChemPhysChem 2005, 6, 897–900. [DOI] [PubMed] [Google Scholar]
- Ashkin A.; Dziedzic J. M.; Bjorkholm J. E.; Chu S. Observation of a Single-Beam Gradient Force Optical Trap for Dielectric Particles. Opt. Lett. 1986, 11, 288–290. [DOI] [PubMed] [Google Scholar]
- Grier D. G. A Revolution in Optical Manipulation. Nature 2003, 424, 810–816. [DOI] [PubMed] [Google Scholar]
- Visscher K.; Schnitzer M. J.; Block S. M. Single Kinesin Molecules Studied with a Molecular Force Clamp. Nature 1999, 400, 184–189. [DOI] [PubMed] [Google Scholar]
- Lang M. J.; Asbury C. L.; Shaevitz J. W.; Block S. M. An Automated Two-Dimensional Optical Force Clamp for Single Molecule Studies. Biophys. J. 2002, 83, 491–501. [DOI] [PMC free article] [PubMed] [Google Scholar]
- Lang M. J.; Fordyce P. M.; Engh A. M.; Neuman K. C.; Block S. M. Simultaneous, Coincident Optical Trapping and Single-Molecule Fluorescence. Nat. Methods 2004, 1, 133–139. [DOI] [PMC free article] [PubMed] [Google Scholar]
- Abbondanzieri E. A.; Greenleaf W. J.; Shaevitz J. W.; Landick R.; Block S. M. Direct Observation of Base-Pair Stepping by RNA Polymerase. Nature 2005, 438, 460–465. [DOI] [PMC free article] [PubMed] [Google Scholar]
- Fehr A. N.; Gutierrez-Medina B.; Asbury C. L.; Block S. M. On the Origin of Kinesin Limping. Biophys. J. 2009, 97, 1663–1670. [DOI] [PMC free article] [PubMed] [Google Scholar]
- Nelson K. D.; Li X.; Weiss D. S. Imaging Single Atoms in a Three-Dimensional Array. Nat. Phys. 2007, 3, 556–560. [Google Scholar]
- Neher E.; Sakmann B. Single-Channel Currents Recorded from Membrane of Denervated Frog Muscle-Fibers. Nature 1976, 260, 799–802. [DOI] [PubMed] [Google Scholar]
- Meller A.; Nivon L.; Brandin E.; Golovchenko J.; Branton D. Rapid Nanopore Discrimination between Single Polynucleotide Molecules. Proc. Natl. Acad. Sci. U.S.A. 2000, 97, 1079–1084. [DOI] [PMC free article] [PubMed] [Google Scholar]
- Meller A. Dynamics of Polynucleotide Transport through Nanometre-Scale Pores. J. Phys.: Condens. Matter 2003, 15, R581–R607. [Google Scholar]
- Wilson N. A.; Abu-Shumays R.; Gyarfas B.; Wang H.; Lieberman K. R.; Akeson M.; Dunbar W. B. Electronic Control of DNA Polymerase Binding and Unbinding to Single DNA Molecules. ACS Nano 2009, 3, 995–1003. [DOI] [PMC free article] [PubMed] [Google Scholar]
- Li J. L.; Gershow M.; Stein D.; Brandin E.; Golovchenko J. A. DNA Molecules and Configurations in a Solid-State Nanopore Microscope. Nat. Mater. 2003, 2, 611–615. [DOI] [PubMed] [Google Scholar]
- Dekker C. Solid-State Nanopores. Nat. Nanotechnol. 2007, 2, 209–215. [DOI] [PubMed] [Google Scholar]
- Liu H. T.; He J.; Tang J. Y.; Liu H.; Pang P.; Cao D.; Krstic P.; Joseph S.; Lindsay S.; Nuckolls C. Translocation of Single-Stranded DNA through Single-Walled Carbon Nanotubes. Science 2010, 327, 64–67. [DOI] [PMC free article] [PubMed] [Google Scholar]
- Branton D.; Deamer D. W.; Marziali A.; Bayley H.; Benner S. A.; Butler T.; Di Ventra M.; Garaj S.; Hibbs A.; Huang X. H.; et al. The Potential and Challenges of Nanopore Sequencing. Nat. Biotechnol. 2008, 26, 1146–1153. [DOI] [PMC free article] [PubMed] [Google Scholar]
- Dudko O. K.; Mathe J.; Szabo A.; Meller A.; Hummer G. Extracting Kinetics from Single-Molecule Force Spectroscopy: Nanopore Unzipping of DNA Hairpins. Biophys. J. 2007, 92, 4188–4195. [DOI] [PMC free article] [PubMed] [Google Scholar]
- Liang J.; Fernandez J. M. Mechanochemistry: One Bond at a Time. ACS Nano 2009, 3, 1628–1645. [DOI] [PMC free article] [PubMed] [Google Scholar]
- Ternes M.; Lutz C. P.; Hirjibehedin C. F.; Giessibl F. J.; Heinrich A. J. The Force Needed To Move an Atom on a Surface. Science 2008, 319, 1066–1069. [DOI] [PubMed] [Google Scholar]
- Bartels L.; Meyer G.; Rieder K. H. Basic Steps of Lateral Manipulation of Single Atoms and Diatomic Clusters with a Scanning Tunneling Microscope Tip. Phys. Rev. Lett. 1997, 79, 697–700. [Google Scholar]
- Kellermayer M. S. Z.; Smith S. B.; Granzier H. L.; Bustamante C. Folding−Unfolding Transitions in Single Titin Molecules Characterized with Laser Tweezers. Science 1997, 276, 1112–1116. [DOI] [PubMed] [Google Scholar]
- Rief M.; Pascual J.; Saraste M.; Gaub H. E. Single Molecule Force Spectroscopy of Spectrin Repeats: Low Unfolding Forces in Helix Bundles. J. Mol. Biol. 1999, 286, 553–561. [DOI] [PubMed] [Google Scholar]
- Liphardt J.; Onoa B.; Smith S. B.; Tinoco I.; Bustamante C. Reversible Unfolding of Single RNA Molecules by Mechanical Force. Science 2001, 292, 733–737. [DOI] [PubMed] [Google Scholar]
- Neuman K. C.; Block S. M. Optical Trapping. Rev. Sci. Instrum. 2004, 75, 2787–2809. [DOI] [PMC free article] [PubMed] [Google Scholar]
- Moffitt J. R.; Chemla Y. R.; Aathavan K.; Grimes S.; Jardine P. J.; Anderson D. L.; Bustamante C. Intersubunit Coordination in a Homomeric Ring ATPase. Nature 2009, 457, 446–451. [DOI] [PMC free article] [PubMed] [Google Scholar]
- Bustamante C.; Macosko J. C.; Wuite G. J. L. Grabbing the Cat by the Tail: Manipulating Molecules One by One. Nat. Rev. Mol. Cell Biol. 2000, 1, 130–136. [DOI] [PubMed] [Google Scholar]
- Chiu D. T.; Zare R. N. Biased Diffusion, Optical Trapping, and Manipulation of Single Molecules in Solution. J. Am. Chem. Soc. 1996, 118, 6512–6513. [Google Scholar]
- Kabata H.; Kurosawa O.; Arai I.; Washizu M.; Margarson S. A.; Glass R. E.; Shimamoto N. Visualization of Single Molecules of RNA-Polymerase Sliding along DNA. Science 1993, 262, 1561–1563. [DOI] [PubMed] [Google Scholar]
- Yamamoto T.; Kurosawa O.; Kabata H.; Shimamoto N.; Washizu M. Molecular Surgery of DNA Based on Electrostatic Micromanipulation. IEEE Trans. Ind. Appl. 2000, 36, 1010–1017. [Google Scholar]
- Neuman K. C. Single-Molecule Measurements of DNA Topology and Topoisomerases. J. Biol. Chem. 2010, 285, 18967–18971. [DOI] [PMC free article] [PubMed] [Google Scholar]
- Sielaff H.; Rennekamp H.; Wachter A.; Xie H.; Hilbers F.; Feldbauer K.; Dunn S. D.; Engelbrecht S.; Junge W. Domain Compliance and Elastic Power Transmission in Rotary F0F1-ATPase. Proc. Natl. Acad. Sci. U.S.A. 2008, 105, 17760–17765. [DOI] [PMC free article] [PubMed] [Google Scholar]
- La Porta A.; Wang M. D. Optical Torque Wrench: Angular Trapping, Rotation, and Torque Detection of Quartz Microparticles. Phys. Rev. Lett. 2004, 92, 190801-1-4. [DOI] [PubMed] [Google Scholar]
- Deufel C.; Forth S.; Simmons C. R.; Dejgosha S.; Wang M. D. Nanofabricated Quartz Cylinders for Angular Trapping: DNA Supercoiling Torque Detection. Nat. Methods 2007, 4, 223–225. [DOI] [PubMed] [Google Scholar]
- Forth S.; Deufel C.; Sheinin M. Y.; Daniels B.; Sethna J. P.; Wang M. D. Abrupt Buckling Transition Observed during the Plectoneme Formation of Individual DNA Molecules. Phys. Rev. Lett. 2008, 100, 148301-1-4. [DOI] [PMC free article] [PubMed] [Google Scholar]
- Degen C. L.; Poggio M.; Mamin H. J.; Rettner C. T.; Rugar D. Nanoscale Magnetic Resonance Imaging. Proc. Natl. Acad. Sci. U.S.A. 2009, 106, 1313–1317. [DOI] [PMC free article] [PubMed] [Google Scholar]
- Mamin H. J.; Poggio M.; Degen C. L.; Rugar D. Nuclear Magnetic Resonance Imaging with 90-nm Resolution. Nat. Nanotechnol. 2007, 2, 301–306. [DOI] [PubMed] [Google Scholar]
- Rugar D.; Budakian R.; Mamin H. J.; Chui B. W. Single Spin Detection by Magnetic Resonance Force Microscopy. Nature 2004, 430, 329–332. [DOI] [PubMed] [Google Scholar]
- Eid J.; Fehr A.; Gray J.; Luong K.; Lyle J.; Otto G.; Peluso P.; Rank D.; Baybayan P.; Bettman B.; et al. Real-Time DNA Sequencing from Single Polymerase Molecules. Science 2009, 323, 133–138. [DOI] [PubMed] [Google Scholar]
- Pushkarev D.; Neff N. F.; Quake S. R. Single-Molecule Sequencing of an Individual Human Genome. Nat. Biotechnol. 2009, 27, 847–852. [DOI] [PMC free article] [PubMed] [Google Scholar]
- Chin C. S.; Sorenseon J.; Harris J. B.; Robins W. P.; Charles R. C.; Jean-Charles R. R.; Bullard J.; Webster D. R.; Kasarskis A.; Peluso P.; et al. The Origin of the Haitian Cholera Outbreak Strain. N. Engl. J Med. 2011, 364, 33–42. [DOI] [PMC free article] [PubMed] [Google Scholar]
- van Houselt A.; Zandvliet H. J. W. Time-Resolved Scanning Tunneling Microscopy. Rev. Mod. Phys. 2010, 82, 1593–1605. [Google Scholar]
- Kim T. H.; Wang Z. H.; Wendelken J. F.; Weitering H. H.; Li W. Z.; Li A. P. A Cryogenic Quadraprobe Scanning Tunneling Microscope System with Fabrication Capability for Nanotransport Research. Rev. Sci. Instrum. 2007, 78, 7. [DOI] [PubMed] [Google Scholar]
- Higuchi S.; Kuramochi H.; Laurent O.; Komatsubara T.; Machida S.; Aono M.; Obori K.; Nakayama T. Multiple-Scanning-Probe Tunneling Microscope with Nanoscale Positional Recognition Function. Rev. Sci. Instrum. 2010, 81, 073706. [DOI] [PubMed] [Google Scholar]
- Xu M. S.; Fujita D.; Hanagata N. Perspectives and Challenges of Emerging Single-Molecule DNA Sequencing Technologies. Small 2009, 5, 2638–2649. [DOI] [PubMed] [Google Scholar]
- de Jonge N.; Peckys D. B.; Kremers G. J.; Piston D. W. Electron Microscopy of Whole Cells in Liquid with Nanometer Resolution. Proc. Natl. Acad. Sci. U.S.A. 2009, 106, 2159–2164. [DOI] [PMC free article] [PubMed] [Google Scholar]
- Bard A. J. Toward Single Enzyme Molecule Electrochemistry. ACS Nano 2008, 2, 2437–2440. [DOI] [PubMed] [Google Scholar]
- Hoeben F. J. M.; Meijer F. S.; Dekker C.; Albracht S. P. J.; Heering H. A.; Lemay S. G. Toward Single-Enzyme Molecule Electrochemistry: NiFe -Hydrogenase Protein Film Voltammetry at Nanoelectrodes. ACS Nano 2008, 2, 2497–2504. [DOI] [PubMed] [Google Scholar]
- Ji N.; Milkie D. E.; Betzig E. Adaptive Optics via Pupil Segmentation for High-Resolution Imaging in Biological Tissues. Nat. Methods 2010, 7, 141–150. [DOI] [PubMed] [Google Scholar]
- Ji N.; Magee J. C.; Betzig E. High-Speed, Low-Photodamage Nonlinear Imaging Using Passive Pulse Splitters. Nat. Methods 2008, 5, 197–202. [DOI] [PubMed] [Google Scholar]
- Liu W.; Howarth M.; Greytak A. B.; Zheng Y.; Nocera D. G.; Ting A. Y.; Bawendi M. G. Compact Biocompatible Quantum Dots Functionalized for Cellular Imaging. J. Am. Chem. Soc. 2008, 130, 1274–1284. [DOI] [PMC free article] [PubMed] [Google Scholar]
- Allen P. M.; Liu W. H.; Chauhan V. P.; Lee J.; Ting A. Y.; Fukumura D.; Jain R. K.; Bawendi M. G. InAs(ZnCdS) Quantum Dots Optimized for Biological Imaging in the Near-Infrared. J. Am. Chem. Soc. 2010, 132, 470–471. [DOI] [PMC free article] [PubMed] [Google Scholar]
- Claridge S. A.; Liang H. Y. W.; Basu S. R.; Frechet J. M. J.; Alivisatos A. P. Isolation of Discrete Nanoparticle−DNA Conjugates for Plasmonic Applications. Nano Lett. 2008, 8, 1202–1206. [DOI] [PubMed] [Google Scholar]
- Fung R.; Shneerson V.; Saldin D. K.; Ourmazd A. Structure from Fleeting Illumination of Faint Spinning Objects in Flight. Nat. Phys. 2009, 5, 64–67. [Google Scholar]
- Caleman C.; Huldt G.; Maia F. R. N. C.; Ortiz C.; Parak F. G.; Hajdu J.; van der Spoel D.; Chapman H. N.; Timneanu N.. On the Feasibility of Nanocrystal Imaging Using Intense and Ultrashort X-ray Pulses. ACS Nano 20115139−146 [DOI] [PubMed] [Google Scholar]
- Kalinin S. V.; Rodriguez B. J.; Jesse S.; Karapetian E.; Mirman B.; Eliseev E. A.; Morozovska A. N. Nanoscale Electromechanics of Ferroelectric and Biological Systems: A New Dimension in Scanning Probe Microscopy. Annu. Rev. Mater. Res. 2007, 37, 189–238. [Google Scholar]
- Degen C. L.; Poggio M.; Mamin H. J.; Rugar D. Nuclear Spin Relaxation Induced by a Mechanical Resonator. Phys. Rev. Lett. 2008, 100, 1313–1317. [DOI] [PubMed] [Google Scholar]
- Lee J.; Shen W. J.; Payer K.; Burg T. P.; Manalis S. R. Toward Attogram Mass Measurements in Solution with Suspended Nanochannel Resonators. Nano Lett. 2010, 10, 2537–2542. [DOI] [PubMed] [Google Scholar]
- Halvorsen K.; Wong W. P. Massively Parallel Single-Molecule Manipulation Using Centrifugal Force. Biophys. J. 2010, 98, L53–L55. [DOI] [PMC free article] [PubMed] [Google Scholar]
- Dupres V.; Dufrene Y. F.; Heinisch J. J. Measuring Cell Wall Thickness in Living Yeast Cells Using Single Molecular Rulers. ACS Nano 2010, 4, 5498–5504. [DOI] [PubMed] [Google Scholar]
- Giessibl F. J. Atomic Resolution on Si(111)-(7 × 7) by Noncontact Atomic Force Microscopy with a Force Sensor Based on a Quartz Tuning Fork. Appl. Phys. Lett. 2000, 76, 1470–1472. [Google Scholar]