Abstract
Film digitizers are used to transfer hardcopy x-ray transmission films into a PACS environment. Variability between digitizers is primarily due to a lack of an acquisition standard. By utilizing the Digital Imaging and Communications in Medicine (DICOM) Part 14 Grayscale Standard Display Function (GSDF) as basis from which to judge and modify digitizer output, a methodology using Just Noticeable Differences (JND) can be established that will create custom lookup tables for film digitizers. These modified images can then be judged against the original films using the GSDF to determine if the original films' contrast is preserved. Results based on JND indicated that relative contrast of the original image is preserved.
Key words: Digitizer, GSDF, JND, DICOM14
Background
Film digitizers are undergoing an evolution in regard to their intended uses. Originally, digitizers were used in teleradiology applications, or for scientific purposes where a digital image was required.
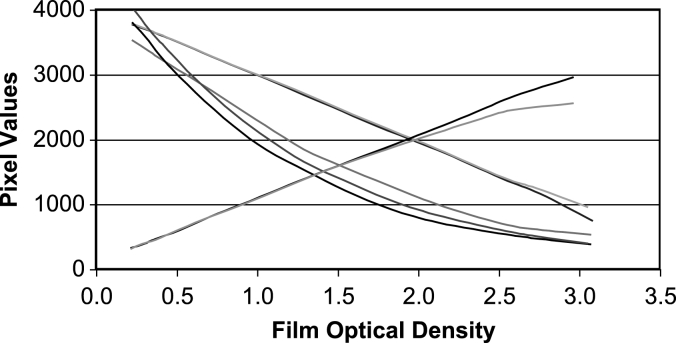
Today, film digitizers are being used to fill the gap in facilities making the transition to a filmless environment. Complete conversion is difficult when the institution has a very large archive and/or a large number of low volume sites that have difficulty justifying the expense of implementing digital acquisition using Computed Radiography (CR) or Digital Radiography (DR) units. Digitizers play a significant role in this migration by supplying the film file rooms with the means of providing comparison films on a demand basis and providing a low-cost alternative for digital images to low-volume facilities. However, inherent issues with film digitizers often cause problems. Vendors have taken a variety of approaches to quantifying optical density values as seen on Figure 1. Currently, most commercially available units provide a default lookup table for digitized images to represent original film optical density (OD) to a linear scale of pixel values (log scale to transmitted luminance). A loss of contrast in the mid region often referred to as a “washed out” appearance by radiologists, occurs when these images are displayed on the institution's PACS workstations.
Fig. 1.
Significant variability in responses is observed from seven different digitizers that is each operating within “design tolerances.” The linear response is typical of modern units.
In contrast, directly acquired images using CR or DR are acquired and stored using methods that maximize the inherent subject contrast. The resulting stored image is then displayed using the Digital Imaging and Communications in Medicine (DICOM) Part 14 Grayscale Standard Display Function (GSDF)1 to preserve the inherent contrast. Implementation of GSDF has provided radiologists with a consistent image display from all digital modalities except film digitizers. This is because the linear quantifying of the OD does not preserve the inherent contrast of the image as it would be viewed under hardcopy conditions. In addition, it is worthy to note that the hardcopy image, as seen on the viewbox, is the intended image as designed by the film manufacturer.
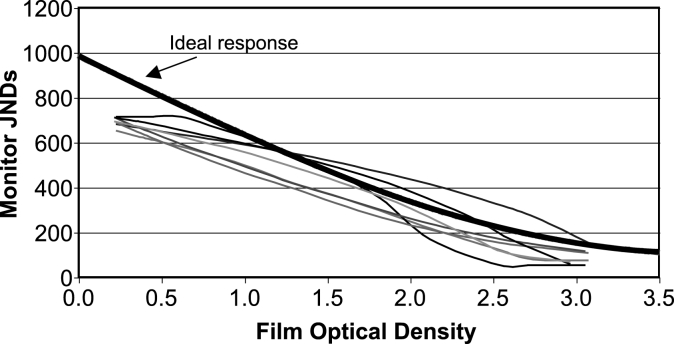
Digitizer vendors have been reluctant to modify original image data and hold to the theory that the “true” image is represented by optical density of the film. This is obviously true, but as long as digitized images are lumped into the Secondary Capture DICOM classification, the PACS vendors will not properly map the optical density values to realistic display values. The effect of this approach is observed by comparing the variety of digitizer responses in respect to the observed Just Noticeable Differences (JND) values and is demonstrated in Figure 2. These responses can also be compared to the ideal response as defined by the GSDF implementation of the Barten visual response model.2
Fig. 2.
Each curve represents digitized films from seven different digitizers as displayed on DICOM Part 14 compliant monitors in terms of Just Noticeable Differences (JND). The “Ideal” curve represents the Barten visual response model from which the DICOM GSDF is based.
A number of published works have proposed quality control programs for film digitizers, concentrating on a number of parameters including spatial resolution, contrast curve, geometric distortion, and noise.3–7 Other works attempt to calibrate film digitizers with respect to gray scale monitors, but did not have an accepted standard to base their results on.8,9 The goal of this work is not to establish a quality control parameter, but to present a methodology to provide lookup tables (LUT) to individual images. These LUTs will transform the pixel values of the image data sets so that the luminance of displayed images will be equivalent to the original films as observed on a viewbox as defined by the GSDF. Retaining absolute luminance measurements is not the goal, but rather the retention of relative contrast of the images through the entire luminance range. These lookup tables will be applied upon digitization of the original film.
Methods
Although the DICOM Part 14 Grayscale Standard Display Function is not intended for use with film digitizers, it does provide a standard by which all images, softcopy or hardcopy, are displayed. One of the basic assumptions of Part 14 is that the stored pixel values (either raw or through a LUT) are linear to visual perception. Accordingly, workstations that are compliant with Part 14 will display the pixel values in a fashion to retain this linear perception.
By using simple assumptions and transforms, one is able to modify the original image data so that a digitized image displayed on any Part 14 compliant workstation will appear to match that same image as if viewed on a viewbox. The viewbox image is assumed to be the optimal presentation of the acquired image for purpose of this evaluation.
The initial step in the evaluation is to digitize a film consisting of a known optical density pattern. For this purpose, an SMPTE (Society of Motion Picture and Television Engineers) pattern stored within a CR image processing workstation is printed using a commercial laser printer. Absolute fidelity of the relative gray levels is not required, so quality assurance of the image chain is not required. Once the SMPTE pattern is printed, the 13 relative gray zones are measured in terms of optical density. The SMPTE pattern is then digitized using the standard protocols of the scanner (2905 Laser Film Digitizer; Array Corporation, Hampton, NH, USA).
The pixel values of the digitized image must then be observed. This is ideally accomplished on the digitizer workstation. However, provided that the image chain is verified, analysis on a remote workstation is acceptable. For this process, the image is reviewed on the institutional PACS workstation (Centricity PACS; GE, Milwaukee, WI, USA).
Regions-of-interests (ROI) were observed in each of the 13 relative gray zones of the SMPTE pattern. Mean pixel values, Pi, were collected for each ROI. The associated luminance of each ROI was then measured using a luminance meter (371 Optical Power Meter; UDT Instruments, Baltimore, MD, USA). As discussed later, this step can be skipped by using theoretical values. The luminance values of each ROI is then converted to JND by means of the Barten visual response model as described in DICOM Part 14.1 The Barten model creates the numeric JND scale that is a function of observed luminance and is linear to human visual perception.
For comparison, the luminance measurements are also calculated for the film, Lfilm,i, for each ROI. For this purpose, the maximum viewbox luminance, Lvb, is assumed to remain constant at 3,000 cd/m2. Reflected luminance, Lamb, is a function of ambient illuminance and diffuse reflection coefficient,10 but is assumed to be 1 cd/m2. From these assumptions, the luminance due to known ROI optical density, ODi, can be calculated by  . As done with the luminance measurements on the monitor, the film luminance measurements are converted to JND values. Using the observed film JND values, pixel values are determined that yield the same JND result on a monitor. Because the displayed image is DICOM Part 14 compliant, the JND and pixel values will be linear. Accordingly, the only other information required is the available JND and pixel range. The JND range is determined empirically from available equipment. For purpose of this work, a maximum JND (Jmax) and minimum JND (Jmin) value of 700 and 60 are assumed. These values correspond to 480 and 0.95 cd/m2, respectively. The pixel range is 4,095 (12 bit). This range is reduced to provide additional range beyond the maximum and minimum OD range of the original test film. The minimum pixel value, Pmin′, is set to 128 and the maximum value, Pmax′, is 4,031 (4,095 − 64). Using the above variables, the equation for determining ideal pixel value, Pi′, from a given JND value, Ji, is Pi′ = Pmin′ + (Pmax′ − Pmin′) (Ji − Jmin) / (Jmax − Jmin).
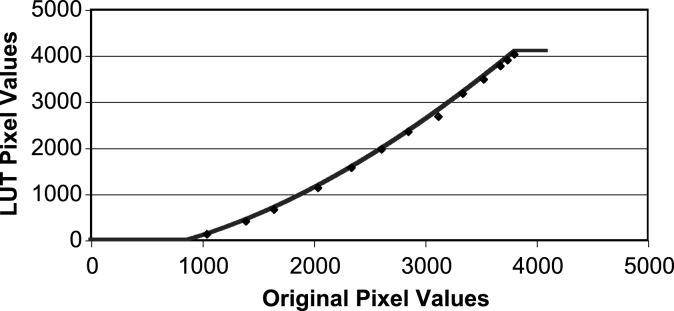
The ideal pixel values, Pi′, are then compared to the original pixel values, Pi. The next step is to determine a function that will yield ideal pixel values for any measured pixel value. A third-order polynomial regression is performed without forcing a zero intercept. The results of this regression are then used to create a 4,095-element LUT. This LUT will be referred to as the GSDF LUT. The regression output is modified in order to retain integer values and clip the output to within the 12-bit range. As a result, all original pixel values below 883 yield a value of 0, and all values above 3,816 yield 4,095. Both of these original pixel values are outside the useful range of the digitizer as defined by the original film utilizing maximum and minimum optical density values. Therefore, no loss of data is predicted. The final LUT is shown in Figure 3.
Fig. 3.
The GSDF LUT curve is presented superimposed upon the individual pixel data points that formed the basis of the regression.
The GSDF LUT is installed into the digitizer workstation as the default LUT. The original film with SMPTE optical density pattern is digitized and transferred to a PACS workstation for analysis. The pixel, luminance, and JND values of the resulting image are recorded for evaluation in the same manner as the original image.
Results
Evaluation of the GSDF LUT is best accomplished by comparing the original film image as displayed on the viewbox with the images created with the digitizer, both with and without the GSDF LUT. Comparison is best achieved by evaluating the JND response of each image. In addition, physician observers are requested to compare clinical films with the resulting digitized image, with and without the GSDF LUT applied.
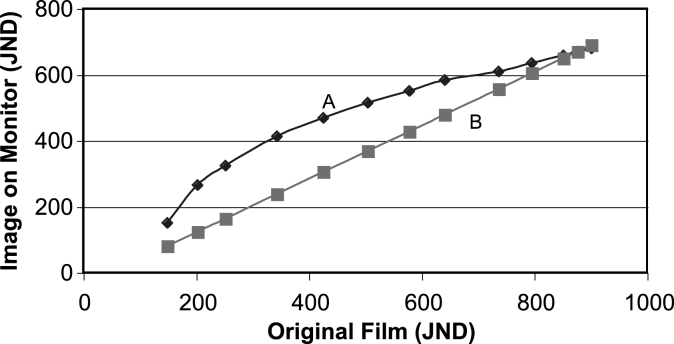
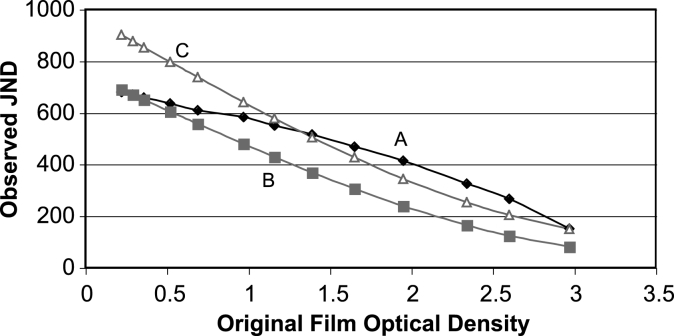
Figure 4 illustrates the difference between the JND response of the modified and original digitized image. The nonlinear response of the unmodified digitized image demonstrates the loss of contrast in some parts of the image. The greater slope in the low JND regions causes an increase in contrast in the darker regions of the film, whereas the mid and high JND regions have a marked decrease in contrast. This effect is the most likely cause of the observed “washed out” appearance in digitized images using a linear OD response. In comparison, the JND response of the image utilizing the GSDF LUT is linear. Contrast response is constant. In addition, the modified image has greater total available contrast. This comparison is valid in judging relative contrast only. The image overall appearance will also be subject to the total luminance available on a given monitor. Figure 5 demonstrates this by comparing the JND response of original film with both digitized images against the film optical density. The greater maximum luminance of the film is observed. The lower available maximum luminance of the monitor biases both digitized images. However, the shape of the curve demonstrates the relative response of the digitized images.
Fig. 4.
Relative contrast response is judged in terms of Just Noticeable Differences (JND). The two curves represent the unmodified image (A) and image modified with the GSDF LUT (B) compared to the JND of the original film as displayed on a viewbox.
Fig. 5.
Image contrast response can be observed using Just Noticeable Differences. Curve A is the unmodified digitized image viewed on a workstation. Curve B is the digitized image modified with the GSDF LUT. Curve C is the JND response of the original film viewed on a viewbox.
Four board-certified radiologists were queried regarding the quality of the digitized clinical images. The sampled clinical images consisted of a PA chest, AP abdomen, and hand. The original film was placed on a viewbox, and the corresponding digitized images were displayed on a PACS diagnostic workstation, all under typical reading conditions. The radiologists were asked two questions. Which digitized image better represents the original film image? Which digitized image has better diagnostic value? All four radiologists answered definitively that the modified images better represented the original film image. With one exception, all of the radiologists also believed the modified images had better diagnostic value in each clinical case. The one exception consisted of a radiologist indicating that he preferred the unmodified PA chest due to the lower contrast and “flat” appearance.
Discussion
Various forms of regression were attempted in creating the LUTs above. Of particular note was the attempted use of a zero intercept. All attempts at forcing a zero intercept yielded extremely artificial responses at the low pixel value end of the range, including negative slopes, or significant departures from the regression fit in the mid portion of the data. In final analysis, it was determined that the low pixel value range was not operationally valid. The maximum optical density measured, which was beyond diagnostic usability, yielded pixel values that are at the edge of clinical significance. Pixel values below this level, inversely proportional to optical density, would be both unexpected and operationally insignificant. Causing a reduction in the regression fit at the operation levels to include nonoperational pixel values was not considered warranted. Simply clipping the LUT output beyond the range of clinical significance was determined a suitable alternative.
The LUT creation methodology described above can be used for any digitizer for which a LUT can be applied. However, a more simplistic approach can be utilized for digitizers that provide output linear to the optical density measurements. This type of response is most prevalent with most major vendors on recent models. Provided the pixel output is linear to film optical density, the initial step of scanning and measuring a known optical density pattern can be omitted. All that is needed is the lower and upper optical density range and corresponding pixel values. The intermediate pixel values can be predicted mathematically. Likewise, digitizers from the same vendor should exhibit similar optical density response and would not require unique LUTs, rather a digitizer “class” LUT would be suitable.
This whole process depends on one assumption. All workstations are DICOM Part 14 compliant. A workstation that does not utilize the Part 14 calibration methodology will not display images in a predictable manner. Any modification, or lack thereof, will have unknown effects on the displayed image, and most likely vary from one workstation monitor to another.
The indication that one out of four radiologists preferred the unmodified PA chest image rather then the image created with the GSDF is not construed as a limitation of the proposed methodology. The radiologist was imposing his own bias concerning optimal image contrast. The methodology was not proposed to create images with optimal image contrast, rather to retain original film image contrast. Likewise, the same method could be slightly altered to enhance certain density regions of films in a predictable manner. However, this should be considered a future work's topic.
The described evaluation and results utilized laser film digitizers. However, the approach should be equally valid for charged-coupled device (CCD) digitizers as long as the output is consistent and reproducible with original optical density. Linearity of digitized output is not required. The author does not have enough familiarity with video camera digitizers to speculate on applicability with this type of equipment.
Conclusion
DICOM Part 14 GSDF provides an adequate means to uniformly display all radiology images, provided that these images are acquired using a consistent methodology. By use of this simple methodology, images brought into a predominantly filmless department by means of a film digitizer can be regarded as equivalent images. Image comparison can be accomplished without regard to source of original images or loss of inherent film contrast. Selected vendors already have the ability to implement this methodology using existing software. It is presumed that other vendors will be able to make simple changes to their products to allow for these changes to occur.
The alternative to the solution presented above is to create another DICOM-defined information object definition exclusively for digitized images, as opposed to being included with the Secondary Capture Object definition. At this point, PACS vendors could implement a unique display function to better represent the OD nature of the images. Although equally valid in approach, the cost and required cooperation from different entities would not result in a timely completion date.
Acknowledgments
The author would like to thank Array Corporation for their assistance.
References
- 1.Digital Imaging and Communications in Medicine (DICOM) Part 14: Grayscale Standard Display Function. Rosslyn, VA: National Electrical Manufacturers Association; 2000. [Google Scholar]
- 2.Barten P. Contrast Sensitivity of the Human Eye and Its Effects on Image Quality. Bellingham, WA: SPIE Press; 1999. [Google Scholar]
- 3.Efstathopoulos E, Costaridou L, Kocsis O, Panayiotakis G. A protocol-based evaluation of medical image digitizers. Br J Radiol. 2001;885:841–846. doi: 10.1259/bjr.74.885.740841. [DOI] [PubMed] [Google Scholar]
- 4.Teslow T. The laser film digitizer: density, contrast, and resolution. J Digit Imaging. 1997;3(Suppl 1):128–132. doi: 10.1007/BF03168675. [DOI] [PMC free article] [PubMed] [Google Scholar]
- 5.Doler W, Rassow S, Jager A, Vosshenrich R. Investigation of the imaging properties of an x-ray film scanner. Phys Med Biol. 1994;39:917–922. doi: 10.1088/0031-9155/39/5/010. [DOI] [PubMed] [Google Scholar]
- 6.Yin F, Giger M, Doi K, Yoshimura H, Xu X. Evaluation of imaging properties of a laser film digitizer. Phys Med Biol. 1992;1:273–280. doi: 10.1088/0031-9155/37/1/020. [DOI] [PubMed] [Google Scholar]
- 7.Esser P, Halpern E, Amis E. Quality Assurance of picture archiving communications systems with laser film digitizers. J Digit Imaging. 1991;4:248–250. doi: 10.1007/BF03173907. [DOI] [PubMed] [Google Scholar]
- 8.Siegel E, Templeton A, Cook L, Eckard D, Harrison L, Dwyer S. Image calibration of laser digitizers, printers, and gray scale displays. Radiographics. 1992;12:329–335. doi: 10.1148/radiographics.12.2.1561421. [DOI] [PubMed] [Google Scholar]
- 9.Lo S, Gaskill J, Mun S, Krasner B. Contrast information of digital imaging in laser film digitizer and display monitor. J Digit Imaging. 1990;2:119–123. doi: 10.1007/BF03170571. [DOI] [PubMed] [Google Scholar]
- 10.Samei E, Badano A, Chakraborty D, Compton K, Cornelius C, Corrigan K, Flynn MJ, Hemminger B, Hangiandreou N, Johnson J, Moxley D, Pavlicek W, Roehrig H, Rutz L, Shepard J, Uzenoff R, Wang J, Willis C. Report of the American Association of Physicists in Medicine (AAPM) Task Group 18. Madison, WI: Medical Physics Publishing; 2005. [DOI] [PubMed] [Google Scholar]


