

Abstract
We have recently completed systematic molecular dynamics simulations of 807 different proteins representing 95% of the known autonomous protein folds in an effort we refer to as Dynameomics. Here we focus on the analysis of side chain conformations and dynamics to create a dynamic rotamer library. Overall this library is derived from 31,000 occurrences of each of 86,217 different residues, or 2.7 × 10⁹ rotamers. This dynamic library has 74% overlap of rotamer distributions with rotamer libraries derived from static high-resolution crystal structures. Seventy-five percent of the residues had an assignable primary conformation, and 68% of the residues had at least one significant alternate conformation. The average correlation time for switching between rotamers ranged from 22 ps for Met to over 8 ns for Cys; this time decreased 20-fold on the surface of the protein and modestly for dihedral angles further from the main chain. Side chain S2 axis order parameters were calculated and they correlated well with those derived from NMR relaxation experiments (R = 0.9). Relationships relating the S2 axis order parameters to rotamer occupancy were derived. Overall the Dynameomics rotamer library offers a comprehensive depiction of side chain rotamer preferences and dynamics in solution, and more realistic distributions for dynamic proteins in solution at ambient temperature than libraries derived from crystal structures, in particular charged surface residues are better represented. Details of the rotamer library are presented here and the library itself can be downloaded at http://www.dynameomics.org.
Keywords: dynamic side chain distributions, rotamer transitions, model building, side chain dynamics
Introduction
Protein side chain conformations have been studied since the earliest crystal structures were solved.1 As further structures were determined, it was found that most side chains dihedral angles cluster in discrete bins and that residues prefer certain combinations of these bins. Each full and discrete side chain conformation is known as a rotamer. Rotamer libraries were created, detailing the frequency, angles, and variance of each conformation.2 These libraries are used to predict, build, design, and solve new protein structures.3 Currently, there are two major libraries: a side chain only library by the Richardson laboratory4 and a library including main chain conformation by the Dunbrack laboratory.5 Both groups selected sets of high quality X-ray crystal structures with low sequence similarity and then filtered for individual residues with low B-factors and low clash scores. This process reduced experimental ambiguity and prevented bias from the computational techniques involved, particularly the use of earlier rotamer libraries to solve structures.4
But these techniques are not without their own problems. The crystal structures themselves, and especially the filtering techniques employed, may yield an overly static view of protein structure. Flexible proteins that crystallize at lower resolution or inherently flexible amino acid conformations with high B-factors are excluded. The libraries use crystal structures instead of solution structures and may suffer from artifacts such as crystal contacts, effects of crystallization conditions, or changes from mutations or truncations necessary to improve crystallization quality. In addition, the number of structures determined under cryogenic conditions is increasing, which can also skew the distributions.
The flexibility and dynamics of amino acids—numbers of conformations visited by a residue and the frequencies of these conformational changes—are only beginning to be elucidated and are not captured in the libraries. One early study found that crystal structures of the same protein could have alternate conformations assigned for up to 13% of the residues.6 A more recent study found 3.3% of residues were multirotameric within a single crystal structure.7 S2 side chain order parameters derived from NMR relaxation experiments in solution reflect dynamics on the ps-ns time scale for the vector orientation of the terminal methyl groups of selected amino acids, but they have only been reported for a small number of proteins.8
We have undertaken a study of the side chain behavior of proteins using our Dynameomics protein simulation dataset. Dynameomics is an effort to simulate the native state and unfolding behavior of representatives of all autonomous protein folds.9,10 Here we have analyzed the native state molecular dynamics simulations (MD) of 807 proteins spanning essentially all known protein folds, each simulated at 298 K for at least 31 ns.9 The resulting Dynameomics rotamer library has 74% of the population shared with crystallographically derived rotamer libraries and a correlation coefficient of R = 0.90 with a collection of side chain S2 order parameters. Here we report the behavior of individual dihedral angles, the conformations of individual rotamers, correlation times for conformational changes, and the effect of burial on these properties.
Results
Conformational analyses
We analyzed side chain conformation and dynamics of the Dynameomics dataset.9,10 The simulation targets were chosen for maximal structural diversity11,12 and they each represent a different protein fold, covering 95% of all known autonomous protein domains. Here we make use of this new v2009 target set. This set is now complete and all protein metafold structures of sufficient quality have been simulated for at least 31 ns at 25°C. The set includes 807 proteins, totaling 86,217 residues, with at least 31,000 samples of each residue.
For conformational analyses, we compared the MD results against two experimentally derived datasets, one with more structures and one with higher confidence structures. First we created an Inclusive PDB dataset (Inc), which includes all structures from the Astral40 collection version 1.71.13 It consists of 30,835 proteins selected from the SCOP14 database having sequence similarity of ≤ 40%. From these we accepted any residue with all heavy atom assignments (1,164,170 total residues). Next we created a Filtered PDB dataset (Fil), which consists of the raw data used to generate the May 2002 revision of the Dunbrack backbone dependent rotamer library.5,15 The library was created from 850 high resolution protein structures and filtered to remove residues with high B-factors or steric clashes,4 yielding 133,798 residues. Both datasets alone are potentially subject to some problems, either experimental error for the former, or filter bias for the latter. In particular, we found these two sets differ significantly for Asp, Asn, Gln, and Glu, as discussed below. Statistics for amino acid composition of each dataset are available in Supporting Information Table I. Overall, Inclusive PDB (Inc) covers 1004 folds, Filtered PDB (Fil) covers 310 folds, and Dynameomics (Dyn) covers 807 folds.
Dihedral angle energy minima
We compared the free energy minima of each dihedral angle using population histograms (Figs. 1 and 2). In our Dynameomics simulation set, all tetrahedral-carbon angles have modes within 10° of their canonical minima. For the most part the minima (as reflected in the higher populations) are very similar in the three data sets, although there is broadening in the Dynameomics set due to dynamics.
Figure. 1.

Dihedral Angle Distributions. Histograms of dihedral angle populations are shown for Dynameomics, Inclusive PDB, and Filtered PDB datasets for 18 amino acids. Populations for trimeric χ-angles and χ-angles before aromatic rings correspond well between data sets. Asn, Asp, Gln, and Glu terminal χ-angles differed strongly between Filtered PDB and Dynameomics, with Inclusive PDB bridging the gap. Pro is approximated in our force field by a single peak bifurcating the puckered states. Several residues show more subtle shifts in modal location and areas under each minima. χ1: black; χ2: red; χ3: green; χ4: blue.
Figure. 2.

Polar Dihedrals and Dihedral Angle Bins. For each data set, amino acid, and dihedral angle, a polar plot of the dihedral angle histogram is displayed (as in Fig. 1), the division of that dihedral angle into rotameric bins, and the total population of each bin. The left-hand column shows the rotameric bin definitions used; the first definition additionally contains a graphical legend of the components of each plot. The notes column draws attention to dihedral angles with significant differences between Dynameomics and experimental datasets with an asterisk and specifies that bin definitions were used for each dihedral angle, which angles required a different definition for dynamic analyses, and which angles are symmetric.
The χ2 rings of Phe and Tyr are similar between all three datasets with single broad modes near 90° (taking into account the 180° symmetry of these angles). Hid and Hie (δ and ɛ protonated neutral His, respectively) χ2 rings peak at −80° and 70°, within 10° of the experimental sets. Trp χ2 is the most distinctive angle, having modes at ± 90° and −30° in all datasets. For Pro, our potential energy function employs a single χ1 dihedral angle at 0° to accommodate the ± 30° pucker. The pucker has little effect on main chain dihedral angles16 and there is less than 1 Å deviation in the Cγ atom of the ring between puckers. The Ser and Thr minima are similar in the different datasets although the peaks are broadened significantly and there is a slight shift towards 0° in the Dynameomics minima.
The carboxyl and carboxyamide dihedral angles of Asp/Asn χ2 and Glu/Gln χ3 show the most diversity between the three datasets (Figs. 1 and 2). In Dynameomics, Asn χ2 is either flat or has NH2 tilting away from the main chain, with peaks at −94° and 50°, whereas in Inclusive PDB and Filtered PDB the NH2 group points away from the main chain, peaking between −55° and −30°, respectively, with heavy shoulders out to −90° and 50°, that is, the two rotameric states of these residues fuse. In Dynameomics, Gln χ3 is almost unconstrained, slightly preferring 90° and −78°, putting the O and NH2 groups flat against the γ-hydrogens. Inclusive PDB has peaks at −60° and −55°; Filtered PDB has a plateau between modes at −60° and 50°, each causing a δ-atom to eclipse a γ-hydrogen. Again, the individual rotameric states aren't well resolved in Inclusive PDB and Filtered PDB.
Asp χ2 differs the most between simulation in solution and static crystal structures. Our results show a broad distribution peaking at 66°, such that one Oγ eclipses a β-hydrogen. In contrast, the Inclusive PDB and Filtered PDB peak at −20°: again perpendicular to the main chain. Finally, Glu χ3 contains two peaks, as expected, in Dynameomics, while the Filtered PDB peaks sharply at 0°, and the Inclusive PDB oscillates with little preference.
Dihedral angle populations
Based on the dihedral angle distributions, we found that the canonical bins used in construction of the Dunbrack rotamer library5 were appropriate for Dynameomics, with additional divisions for some dihedrals to improve resolution (Fig. 2 and Supporting Information Tables 2 and 3). Using these definitions, we investigated the populations of the individual bins. Experimentally, most χ1 angles (excepting Ile, Val, Ser, and Thr) follow a distribution of 0−20% g+, 30−40% t, and 50−60% g−. In Dynameomics, Cys, Hid, Hie, Leu, Phe, Trp, and Tyr agree to within 10% of the static experimental populations. Arg, Gln, Glu, Lys, and Met increase their χ1 g− populations to 75−85%. In contrast, Asp and Asn increase their t populations to 82−85%.
Ile and Val are β-branched and generally (>73%) found with γ-carbons flanking the small Hα (g− in Ile, t in Val) in the Filtered PDB and Inclusive PDB. In Dynameomics they are more evenly distributed between Hα-flanking and C-flanking populations. Thr is evenly split between g+ and g− in both simulation and experiment. Ser is relatively evenly distributed between its three conformations (24−47%) experimentally, but prefers g− in Dynameomics.
Dynameomics and experimental populations for χ2 generally follow a simple trend: avoid steric clashes with the main chain. The cyclic amino acids, His, Phe, Trp, and Tyr, populate a gauche rotamer (>80%), keeping the ring flat against the main chain. Residues with a single δ-carbon (Arg, Glu, Gln, Ile, Met, Lys) favor trans (60−85%). Leu keeps χ2 in either trans (65%) or g+ (33%), positioning at least one of its δ-carbon away from the main chain. γ-branched Asp and Asn, however, defies this trend. Experimentally, Asn keeps Nδ away from the backbone with 90% Og−, Nt, and Og+ and Asp prefers t by 60%. These trans conformations place an Oδ within 3 Å of the main chain NH or CO. In contrast, in Dynameomics, Asp and Asn χ2 avoid trans. Asn has a 30% lower population of Og− and Nt, instead favoring Ng+ and Og+. Asp moves 50% of the population from t to g+.
Glu and Gln χ3 angles are somewhat analogous to their Asp and Asn χ2 counterparts, though the differences between simulation and experiment are not as extreme and the Inclusive PDB is intermediate between the Filtered PDB and Dynameomics. Met χ3 populations split roughly into thirds in all three datasets, each slightly favoring g− (41−44%), but with a switch in the preferred secondary conformation from g+ in crystal structures to t in simulation. Arg χ3 and χ4 are split about 50% t and 25% each in g+ and g−, experimentally. χ3 is more evenly distributed (28−37%) in Dynameomics; χ4 retains experimental populations. Lys χ3 and χ4 favor trans (66−75%) in the static crystal structures. Dynameomics matched in χ3, but χ4 shifted to gauche conformations (g+: 38%; g−: 47%).
Major rotamer distributions
Having examined individual dihedral angles, we turned to the full conformation of the longer amino acids. Complete rotamer libraries are available in Supporting Information Table III. The most populated rotamer was generally a combination of the dominant dihedral angle conformations, discussed above (Supporting Information Table 4). Populations of other conformations are more difficult to predict. For brevity, for each amino acid, we present only the similarity of its rotamer population between datasets (Fig. 3) and a count of its significant conformations (Fig. 4 and Supporting Information Table 4).
Figure. 3.
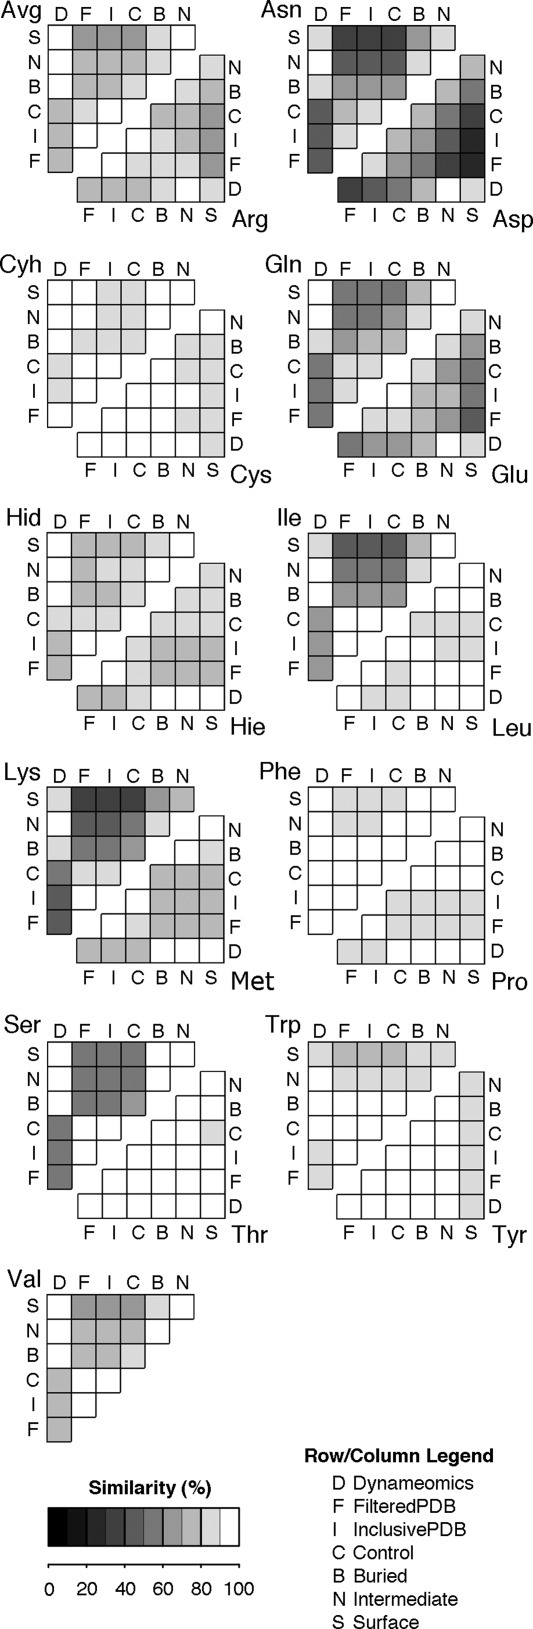
Data Set Similarity of Rotamer Libraries. The figure displays the similarity between rotamer libraries from each data set. The experimentally derived data sets [FilteredPDB (F), InclusivePDB (I), and Control (C)] are highly similar to each other. They are distinct from the Dynameomics derived data sets [Dynameomics (D), Buried (B), Intermediate (N), and Surface (S)].
Figure. 4.
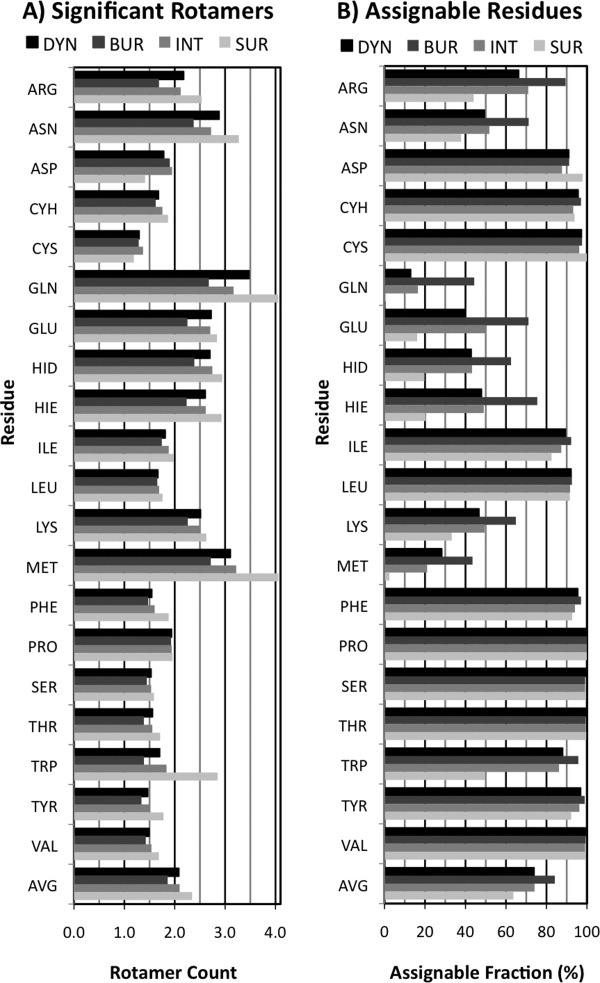
Rotamer Occupancy. A: Significant Rotamers. A typical residue in a protein has two rotamers at > 10% occupancy. Gln and Met occupy the most states while the short amino acids occupy only 1.5 rotamers. Classifying residues by SC-SASA shows residues occupy an extra ½ rotamer when on the surface of a protein compared to when buried. B: Assignable Residues. 75% of residues have a single, unambiguously assignable rotamer conformation (>50% occupancy). Asp, Cyh, Cys, Ile, Leu, Phe, Ser, Thr, Trp, Tyr, and Val are assignable more than 85% of the time. These residues, except for Trp, also show little response to burial. The longer residues, particularly Gln and Met, can be much more difficult to assign the full conformation to.
Similarity was measured as the fraction of the rotamer population that does not shift rotamers between datasets; alternatively, displacement or difference refers to this shifted population (precise calculation provided in Methods). The average similarity between Dynameomics and both Filtered PDB and Inclusive PDB was 74%. Filtered PDB and Inclusive PDB were themselves 94% similar and were ≥84% similar for all residues (for simplicity, we address them together as experimental data where they are >95% similar). A large shift in a single dihedral angle will also limit rotamer similarity, such as in Asn, Asp, and Lys (36−48% similarity between simulation and experiment). In longer residues, small differences in the populations of each rotamer can sum to a significant total difference (Gln at 59% and Glu at 60%). Most other residues are >75% similar between experiment and simulation (or crystal and solution).
The number of significant conformations—individual rotamers having >5% of the total population—varied by the length of the residue: for residues with 1−4 angles, the average counts were 2.4, 4.6, 5.3, and 4.6 significant rotamers (Supporting Information Table 4). The experimental datasets show similar, though slightly higher counts. There were a few conformations not observed in Dynameomics: two for Arg and four for Lys. These conformations all had steric clashes within the residue. This was similar for the Filtered PDB; all configurations were seen in Inclusive PDB.
Dynameomics control dataset: no bias from starting structures
As a control to check against bias introduced by our selection and preparation of proteins, we created a library from our starting structures. Targets were prepared for simulation by building in missing atoms and then briefly minimizing the structure in vacuo to remove clashes. This Dynameomics Control dataset is most similar to the Inclusive PDB (92%) and Filtered PDB (88%) datasets, and differs 25% from Dynameomics. For every amino acid, both rotamer and dihedral angle bin populations were at least as similar to the Inclusive PDB as to Dynameomics (Fig. 3). We conclude that the starting structures are representative of the Inclusive PDB dataset, as expected, and have not biased our results.
Buried and surface datasets: steric restriction and conformation
We investigated the relationships between conformation and solvent exposure in Dynameomics. Each residue in a protein was classified into Buried, Intermediate, or Surface datasets (Fig. 4) based on side chain solvent accessible surface area (ranges listed in Supporting Information Table 5). The Intermediate subset contains 50% of the residues and is on average only 3% displaced from the full Dynameomics dataset, and is in no case more than 8% different (for Cys), so we compare just the Buried and Surface datasets.
Populations from the Buried and Surface sets are different both from the Dynameomics superset (9%) and from each other (17%). Hydrophobic residues (Cys, Ile, Trp, Tyr) have smaller displacements from Dynameomics in the Buried set. Polar and charged residues (Asn, Asp, Gln, Glu) are more similar to Dynameomics in the Surface set. Other residues show little change (<5%).
Generally, Buried residues are 5% more similar to the Filtered PDB than to Dynameomics. Asp, Asn, Glu, and Gln are 9−18% closer and no residue is more than 1% further (Cyh, Hie). In contrast, Surface residues differ from experiment by an additional 7% over Dynameomics. Arg, Asn, Asp, Cys, Glu, Ile, Lys, Trp, and Tyr are >10% further. These increases were apparent across almost every dihedral angle as well.
Dynamic behavior
The dynamic behavior of amino acids was analyzed in several ways. For each residue, we recorded how many conformations it sampled and the rate at which it changed between these conformations; we then aggregated the data for each amino acid. Such properties can only be indirectly measured via experimental techniques, but we have calculated properties appropriate for comparison with experimental results.
Rotamer sampling
First, we examine the conformational space occupied by individual protein residues in Dynameomics, both in terms of dominant conformations and significant alternate conformations. We consider residues occupying a single conformation for ≥50% of its simulation as an unambiguous primary rotamer assignment [Fig. 4(a) and Supporting Information Table 6]. The amino acids fell into flexible and static groups. The flexible amino acids averaged 42% ± 16% “assignability” (the fraction of residues that could be assigned a primary conformation). These consisted precisely of the residues with ≥18 defined rotamers: Arg, Asn, Gln, Glu, Hid, Hie, Lys, and Met. The residues with ≤9 defined rotamers had a primary conformation in over twice as many cases: 95% ± 4%.
We define significant rotamers in a residue's conformation space as those populated for more than 10% of the simulation [Fig. 4(b) and Supporting Information Table 6]. The average residue populated 2.08 rotamers. Flexible residues averaged 2.8 ± 0.4 rotamers and ranged from 2.2 to 3.5 rotamers. The static residues fell in a narrow range between 1.3 and 1.8 rotamers, with a mean of 1.6 ± 0.2 rotamers.
Buried residues had 0.28 fewer rotamers and Surface residues had 0.22 more rotamers than the full Dynameomics set [Fig. 4(b)], on average. The Intermediate set again closely resembles the full Dynameomics set. The flexible residues have a large increase in occupied rotamers when solvent exposed (+0.85 ± 0.37). Though falling into the static group, the aromatic residues increased as much as dynamic residues (+0.78 ± 0.60). The rest of the residues were relatively flat (+0.10 ± 0.25), with Asp losing 0.4 rotamers and Thr gaining 0.4 rotamers.
The flexible and assignable groups held up in assignability as well, with the exception of Trp. The flexible residues lost 43% ± 9% assignability on the surface relative to full burial and static residues lost 5% ± 14%. Trp represented the bulk of this loss, at 46%.
Rotamer transitions
We next investigated the correlation times for rotamer transitions (Fig. 5). While our primary rotamer definitions are intended for conformational analyses, analysis of rotamer dynamics requires rotamer boundaries at energy maxima for all residues, lest the switching times be dominated by rapid movement within an energy well (Figs. 1 and 2). For χ2 of Asn, Asp, His, Phe, and Tyr and χ3 of Gln and Glu, we define g+ and g− rotamers separated at 0° and 180°.
Figure. 5.
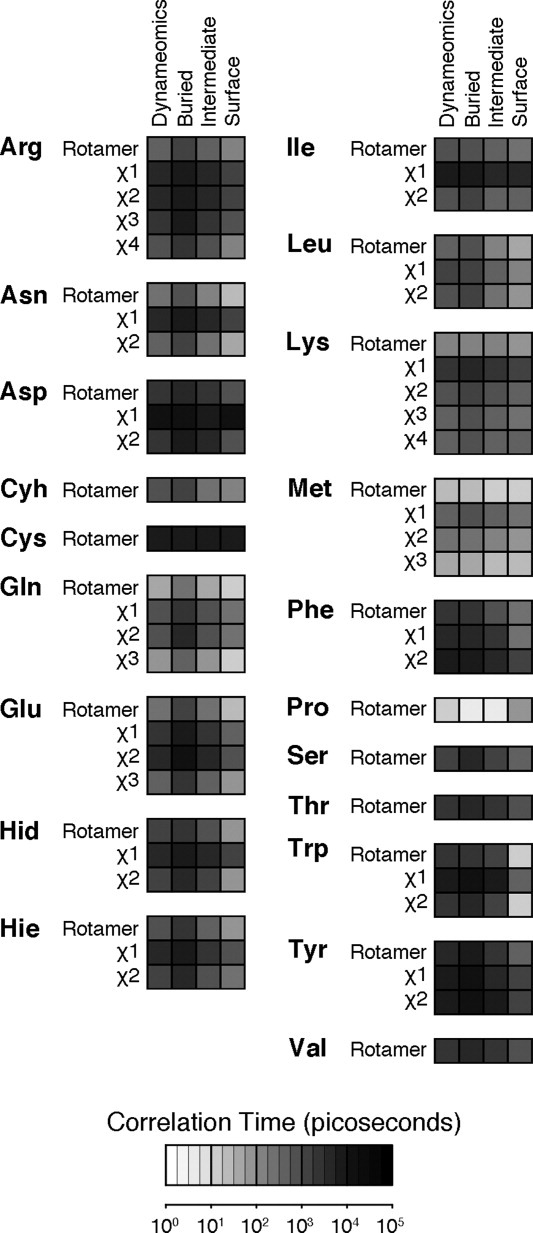
Correlation times for rotamer transitions. The correlation time for a residue is a function of the behavior of each χ-angle, often dominated by a single fastest angle. More terminal χ-angles and more solvent exposed χ-angles tend to move faster (exceptions noted in text). Correlation times longer than 1,000 ps are increasingly under-sampled due to the limits of simulation time, so mean correlation times of slower residues are likely underestimated.
Residues were loosely grouped into short (<100 ps), medium (100−1,000 ps), and long (>1,000 ps) correlation times. Met and Gln were the fastest residues (having short times and more overall transitions); Arg, Asn, Cyh, Glu, Hid, Hie, Ile, Leu, and Lys had intermediate times; Asp, Cys, Phe, Ser, Thr, Trp, Tyr, and Val were slow (long correlation times with few transitions, with individual residues often maintaining the same rotameric state throughout the simulation).
For longer residues, the outer dihedral angles generally experienced more transitions than those closer to the main chain (Fig. 5). Asn, Asp, Gln and Glu terminal χ angles switched between rotamers up to 10× more frequently than the penultimate angle. The only exceptions were χ2-angles of Gln, Glu, Phe, and Tyr, which took 25−100% longer than χ1-angles due to the strong χ2 preference for trans (Gln/Glu) and gauche (Phe,Tyr) conformation irrespective of χ1 orientation. The Lys χ4 angle correlation time was 18% longer than its χ3. Flexible residues (as defined above) tended to have faster switching times than static ones.
Solvent accessibility also modulates correlation times (Fig. 5), with virtually all residues transitioning faster with increased solvent exposure. Here, there were two groups and one outlier. Some residues showed modest increases upon solvent exposure, increasing switching rates by 0.2−6 fold when fully exposed compared with full burial: Cyh, Cys, Ile, Lys, Met, Ser, and Val. The second set increased by 11−33 fold: Arg, Asn, Asp, Gln, Glu, His, Leu, Phe, Tyr, and Tyr. Finally, Trp showed a 239-fold increase in switching rate when solvent exposed. Not only did outer angles of Trp residues tend to have shorter correlation times, the values decreased faster upon solvent exposure (Fig. 5). Trp χ2 dropped from 4,113 ps when buried to 14 ps at the surface (300× increased rate) while χ1 only decreased from 11,750 ps to 528 ps (22× increased rate). That the χ2 increase was greater than the total increase indicates that changes in χ2 and χ1 became more coupled at the surface. This is caused by shallow energy wells for Trp χ2 and complicated by the fact that the apparent energy maxima change as a function of solvent exposure (Fig. 5), with the trans population disappearing in the Surface dataset. Ile, Leu, Met, and Phe had parallel rate increases, between 1.0 and 1.6 fold. Lys and Tyr were the only residues with more slowly increasing rates, 0.5 and 0.7 fold.
S2 Side chain order parameters
Currently, the best experimental measure of side chain dynamics is S2 order parameters from NMR relaxation experiments.17,18 These measure the vector deviation of side chain methyl groups of Ala Cβ, Ile Cγ and Cδ, Leu Cδ, Met Cɛ, Thr Cγ, and Val Cγ on a ps-ns time scale. We calculated S2 order parameters with a 5-nanosecond window for each of these groups in Dynameomics and compared these distributions to a collection of relaxation data for 18 proteins.8 [Fig. 6(A) and Supporting Information Table 7]. Correlations for each group ranged from R = 0.69 to 0.93, with an overall correlation of R = 0.88. The individual terminal methyl groups were indistinguishable for Leu Cδ1 and Cδ2 (R = 0.96) as well as for Val Cγ1 and Cγ2 (R = 0.99), so they were grouped together as Leu Cδ and Val Cγ in the table and figures. The largest differences were for Ile Cδ, which is slightly less mobile than experiment, and Thr Cγ, which is more mobile than experiment.
Figure. 6.
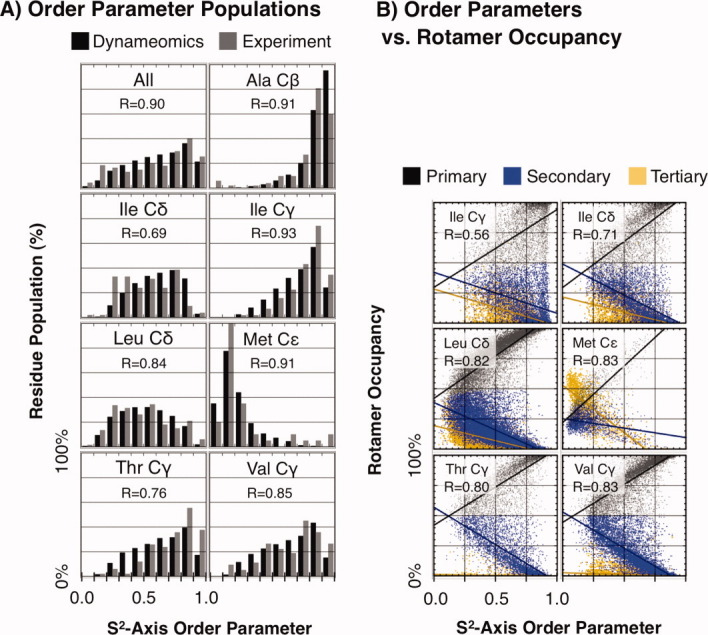
S2 Side chain order parameters. A: Order parameter histograms. Order parameter distributions for Dynameomics closely replicate trends seen in experiment. R-values are listed for each methyl group. B: Order parameters vs. rotamer occupancy. Order parameters directly reflect the rotamer sampling of a residue. These plots relate order parameters to occupancy of primary, secondary, and tertiary rotamers for each residue in Dynameomics along with linear trend lines. R-values between the order parameter and the primary rotamer occupancy are included in the figure. Complete correlations and equations for the lines are in Supporting Information Table 8.
We next compared our S2 calculations with our measures of rotamer occupancy, the time spent by individual residues in their primary, secondary, and tertiary (the sum of all other) rotamers [Fig. 6(B) and Supporting Information Table 8]. S2 was moderately correlated with primary rotamer occupancy (R = 0.57 to 0.84); the linear fit is shown in Figure 6(b). For all groups, order parameters above 0.75 indicated > 90% occupancy of a primary rotamer. For Ile, Leu, and especially Met, order parameters below 0.5 indicated > 10% population of tertiary rotamers.
Discussion
We have studied protein side chain behavior in Dynameomics, a database of all-atom simulations of 807 proteins in explicit solvent at 25°C. These proteins represent essentially all known autonomous protein domains. We analyzed conformational and dynamical properties and compared our results with experiment, where available. Our primary goals were to create a dynamic rotamer library for computational protein structure building and design and to better understand protein motion. Further, we desired a rotamer library representative of proteins in solution at ambient temperatures. We compared our results with experimental data, which include a mix of structures determined by X-ray crystallography (100% in Filtered PDB, 86% in Inclusive PDB), NMR (14% in Inclusive PDB), and other methods (four structures in Inclusive PDB). We note that 84−89% of the crystal structures were obtained at cryo temperatures (∼100 K).
Our rotamer library overlapped 74% with the experimental libraries (Fig. 3), which were themselves similar for most residues. The primary differences were in the terminal dihedral angles of charged residues (e.g., Asp, Gln, Lys, Ser) or in β-branched residues (Ile and Val; Figs. 1 and 2 and Supporting Information Table 3). Long residues (Arg and Met) and residues without well-defined dihedral energy minima (Hid, Hie) also differed more between data sets due to subtle conformational shifts. Experimental and simulation datasets were generally more similar for residues buried in the proteins as opposed to surface exposed residues, regardless of residue charge, though differences were larger for charged residues, which are generally surface exposed. Asp, Asn, Glu, and Gln also had the largest differences (11−16%) between the two experimental datasets while the other residues averaged 4% difference (Figs. 1 and 2, Supporting Information Tables 3 and 4).
Rotamers for solvent-exposed residues present a particular challenge for experimental techniques. In crystal structures, surface residues are more dynamic, have poorer electron density, and may be systematically left out or incorrectly assigned. Surface residues are also often buried at crystal packing interfaces, potentially distorting their conformations.
Dynameomics captures the rotamer populations of individual residues, both buried and exposed alike (Figs. 2 and 3). Residues spend significant time (>10% occupancy) in 2.1 rotamers on average and 75% of the residues have a single, unambiguous rotamer assignment (> 50% occupancy). Amino acids broke down into “dynamic” and “static” groups: those that were defined as having at least 18 rotamers and averaging at least two significant rotamers versus those with fewer rotamers that were at least 85% assignable. The one exception was Asp, which has 18 rotamers defined but was 95% assignable and occupied only 1.7 significant rotamers. Furthermore, all the dynamic residues (including Arg, Asn, Gln, Glu, Hid, Hie, Lys, and Met) were at least 20% displaced between experimental and MD libraries, whereas only Asp, Ile, Ser, and Val were more than 20% displaced in the static residues (which also include Cyh, Cys, Leu, Phe, Thr, Trp, and Tyr).
We measured correlation times between rotamer transitions for each residue (Fig. 5). Overall, Met, and Gln had the shortest correlation times: on the order of 30 ps between rotamer flips. Cys was the slowest (8 ns). The amino acids formed similar groups again, with dynamic residues switching transitioning between rotameric states more frequently than static ones.
Finally, we calculated side chain S2-axis order parameters for those residues commonly probed in NMR relaxation experiments (Ala, Ile, Leu, Met, Thr, and Val). We compared these distributions to an experimental dataset assembled for 18 proteins8 [Fig. 6(A) and Supporting Information Table 7]. Taking the histogram at 0.1 bins of the S2 values, we found decent to excellent correlations (R = 0.69 to 0.93). We related order parameters to rotamer occupancy, measured as the fraction of time a residue spends in its primary, secondary, and tertiary (all other) rotamers [Fig. 6(B) and Supporting Information Table 8]. We found linear correlations for each cardinal rotamer compared with S2 with correlations ranging from R = 0.57 to 0.84, accounting for up to 70% of the variance in the S2 values.
These correlations suggest that the dynamic behavior observed in the Dynameomics dataset is well in line with experiment. The differences observed between Dynameomics and Filtered PDB were largest for the dynamic, surface residues, which are not well represented by the filtered, low temperature, crystal structures comprising the experimental data sets. The work described here constitutes a new dynamic rotamer library and one of the most detailed analyses to date of dynamic side chain behavior. In addition, comparison with experimentally derived crystallographic rotamer libraries indicates that the Dynameomics rotamer library provides more accurate results for polar surface residues. Results from this study, as well as other structural analyses of the Dynameomics database, are publicly available at our website at http://www.dynameomics.org as part of our Structural Library of Intrinsic Residue Propensities (SLIRP) endeavor. In addition the library itself is available for download for incorporation into model building programs and other applications.
Materials and Methods
Conformational data sets
Using three primary data sources and four filters, we created seven rotamer libraries for conformational analyses. Our major data set was Dynameomics,9,17,18 a database of simulations of 807 proteins. Each protein in the dataset represents a unique protein fold11,12 as determined by a two out of three consensus by three protein domain dictionaries: SCOP,14 CATH,19 and Dali.20 These proteins represent 81% of all known protein structures. Each protein was simulated at 298 K for 31−51 nanoseconds using the simulation package ilmm (in lucem molecular mechanics).21 ilmm employs the Levitt et al. force field22 in the NVE microcanonical ensemble with explicit F3C waters.23,24 The first nanosecond of each simulation was considered equilibration time and not included in analysis. Structures were saved and analyzed at one ps resolution.
We divided Dynameomics into three further data sets by classifying each amino acid by its side chain solvent accessible surface area (SC-SASA)25 into Buried, Intermediate, or Surface groups (Supporting Information Table 5). To determine the SC-SASA cutoffs, we referred to a set of penta-peptide simulations, each of the sequence Gly-Gly-X-Gly-Gly, where X is the amino acid of interest.26 We measured the distribution of SC-SASA for the central residue in 5 Å2 bins and used the smallest bin containing at least 1% of the population as the bottom cutoff for Surface residues. We then took 25% of this threshold as the top cutoff for Buried residues; residues in between are in the Intermediate set. These cutoffs were selected to give a structural meaning to the datasets while including enough occurrences of each residue for statistical analysis (Supporting Information Tables 1 and 8). There were 24,872 buried residues, 42,854 intermediate residues, and 18,805 surface residues.
A static Control set was constructed from the starting structures of each Dynameomics simulation. These structures have passed though our build process, which includes reconstruction of missing atoms, brief minimization in vacuo, solvation in a water box, and equilibration of the water. We have shown data for the starting structures to confirm that the build process had a minimal effect on the structure.
Finally, we selected two publicly available datasets of static experimental structures, which we refer to as Inclusive PDB and Filtered PDB. Inclusive PDB was derived from Astral40, a curated set of protein structures selected from SCOP14 having <40% sequence identity. We analyzed version 1.71 and included any residue with all heavy atom assignments, totaling 30,835 pdbs, 1,164,170 residues, and 1004 unique protein folds. Filtered PDB is derived from the dataset used to generate the Dunbrack and Cohen backbone dependent rotamer library,5,15 first published in 1997, last revised in 2002. The revision begins with 850 protein chains from high quality crystal structures (<1.7 Å resolution) and then filters for residues having low B-factors, no steric clashes, and a single assigned conformation. It contains 133,798 residues and 310 unique protein folds. The current library and residue data are available at the Dunbrack web site (http://dunbrack.fccc.edu/bbdep/).
Conformational analyses
For each analysis and dataset, all residues in all proteins were considered to be independent observations; residue results were normalized by simulation length for Dynameomics data sets. Dihedral angle distributions (Figs. 1 and 2) were collated to determine the location and shape of energy minima in our ensemble. For each angle of each residue, we created histograms of the populations in 5° bins.
We generated a backbone independent rotamer library for each dataset (Supporting Information Table 4). To capture the full conformational range of each amino acid, we use rotamer definitions similar to that reported by Dunbrack,5,15 which divide the 360° range of each dihedral angle into bins separated at the predicted energy maxima of eclipsed atoms (Fig. 2 and Supporting Information Table 2). A rotamer is a combination of these bins, defining the total conformation of a residue. A rotamer library is simply the probability distribution of observing a residue in a given rotamer. It contains Supporting Information data such as the average and modal dihedral angles of a conformation.
To measure similarity between dihedral angle bin or rotamer distributions, we use a population displacement metric. We begin with histograms A and B of the dihedral or rotamer distributions from different data sets. Each dataset includes all each normalized to a population of 1. The similarity between histograms is the population that does not change between equivalent bins Ai and Bi [Eq (1)]. For each bin pair, this is the population that is found in both bins, or Min(Ai, Bi). The total similarity is the sum over all bins. Displacement, conversely, is the fraction that does change [Eq. (2)]. Similarity and displacement together sum to one.
| (1) |
| (2) |
Dynamics analyses
Our dynamical analyses were applied to Dynameomics and its derived dynamical datasets (Buried, Intermediate, and Surface). We measured distributions of how many rotamers individual residues populated (Fig. 4) at given occupancy thresholds. We discuss results for the 50% and 10% thresholds as unambiguous assignment and significant occupancy, respectively. Results for 0−100% occupancy are available in Supporting Information Table 6.
We analyzed correlation times between transitions for both rotamers and dihedral angle bins for each amino acid (Fig. 5 and Supporting Information Table 7). A new set of dynamical rotamer definitions was necessary for dihedral angles with wide, shallow energy minima: χ2 of Asn, Asp, His, Phe, and Tyr and χ3 of Gln and Glu. These angles all had energy maxima at 0° and 180° (Figs. 1 and 2) and so we split them into two bins at those angles. Symmetric dihedral angles were treated as asymmetric for this purpose. Correlation time distributions were calculated for each protein residue, normalized to the simulation time, and then these distributions were averaged together for each amino acid. Mean correlation times were calculated from these histograms (Fig. 5).
S2 generalized order parameters27–29 are used to describe the motion of side chain methyl groups (Ala Cβ, Ile Cγ, Ile Cδ, Leu Cδ1 and Cδ2, Met Cɛ, Thr Cγ, and Val Cγ1 and Cγ2) observed by NMR. For comparison with experiment,8 we have measured distributions of S2 order parameter distributions for each of these residues (36,356 total residues including 6,430 alanines) in Dynameomics (Fig. 6).30–32 S2 can be calculated for an individual methyl group in the following way. First, all structures in the simulation are aligned and the vector orientation of the methyl group is calculated for each time point. Equation 3 is applied to a time window to determine S2 for that window. The final value for each methyl group is the average of a sliding window across the entire simulation. P2 is the second Legendre polynomial: P2[x] = 1/2(3x2 − 1). μ(i)μ(j) is the projection of a unit vector along the bond vector at a time i to a time j. T is the window size. We used a window of 5 ns, which is comparable to correlation times used in experiment (2−10 ns). Distributions for windows from 250 ps to 10 ns were also calculated, but they had poorer matches to experiment. To aid interpretation, we created scatter plots of S2 against primary, secondary, and tertiary multirotameriticity populations for each residue and performed linear regression analysis (Fig. 6).
| (3) |
Acknowledgments
The authors thank R. Dustin Schaeffer and David A. C. Beck for helpful discussions and assistance with the Dynameomics Database, as well as the rest of the Dynameomics team for creating and maintaining the project.
References
- 1.Chandrasekaran R, Ramachandran GN. Studies on the conformation of amino acids. XI. Analysis of the observed side group conformation in proteins. Int J Prot Res. 1970;2:223–233. [PubMed] [Google Scholar]
- 2.Ponder JW, Richards FM. Tertiary templates for proteins–use of packing criteria in the enumeration of allowed sequences for different structural classes. J Mol Biol. 1987;193:775–791. doi: 10.1016/0022-2836(87)90358-5. [DOI] [PubMed] [Google Scholar]
- 3.Dunbrack RL., Jr Rotamer libraries in the 21st century. Curr Opin Struct Biol. 2002;12:431–440. doi: 10.1016/s0959-440x(02)00344-5. [DOI] [PubMed] [Google Scholar]
- 4.Lovell SC, Word JM, Richardson JS, Richardson DC. The penultimate rotamer library. Protein. 2000;40:389–408. [PubMed] [Google Scholar]
- 5.Dunbrack RL, Jr, Cohen FE. Bayesian statistical analysis of protein side-chain rotamer preferences. Protein Sci. 1997;6:1661–1681. doi: 10.1002/pro.5560060807. [DOI] [PMC free article] [PubMed] [Google Scholar]
- 6.Smith JL, Hendrickson WA, Honzatko RB, Sheriff S. Structural heterogeneity in protein crystals. Biochemistry. 1986;25:5018–5027. doi: 10.1021/bi00366a008. [DOI] [PubMed] [Google Scholar]
- 7.Shapovalov MV, Dunbrack RL., Jr Statistical and conformational analysis of the electron density of protein side chains. Protein. 2007;66:279–303. doi: 10.1002/prot.21150. [DOI] [PubMed] [Google Scholar]
- 8.Best RB, Clarke J, Karplus M. The origin of protein sidechain order parameter distributions. J Am Chem Soc. 2004;126:7734–7735. doi: 10.1021/ja049078w. [DOI] [PubMed] [Google Scholar]
- 9.Beck DA, Jonsson AL, Schaeffer RD, Scott KA, Day R, Toofanny RD, Alonso DO, Daggett V. Dynameomics: mass annotation of protein dynamics and unfolding in water by high-throughput atomistic molecular dynamics simulations. Protein Eng Des Sel. 2008;21:353–368. doi: 10.1093/protein/gzn011. [DOI] [PubMed] [Google Scholar]
- 10.van der Kamp MW, Schaeffer RD, Jonnson AL, Scouras AD, Simms A, Toofanny RD, Benson NC, Anderson PC, Merkley ED, Rysavy S, Bromley D, Beck DAC, Daggett V. Dynameomics: a comprehensive database of protein dynamics. Structure. 2010;18:423–435. doi: 10.1016/j.str.2010.01.012. [DOI] [PMC free article] [PubMed] [Google Scholar]
- 11.Day R, Beck DA, Armen RS, Daggett V. A consensus view of fold space: combining SCOP, CATH, and the Dali Domain Dictionary. Protein Sci. 2003;12:2150–2160. doi: 10.1110/ps.0306803. [DOI] [PMC free article] [PubMed] [Google Scholar]
- 12.Schaeffer RD, Jonsson AL, Simms AM, Daggett V. Generation of a protein consensus Domain Dictionary. Bioinformatics. 2011 doi: 10.1093/bioinformatics/btq625. DOI: 10.1093/bioinformatics/btq625. [DOI] [PMC free article] [PubMed] [Google Scholar]
- 13.Chandonia JM, Hon G, Walker NS, Lo Conte L, Koehl P, Levitt M, Brenner SE. The ASTRAL Compendium in 2004. Nucleic Acids Res. 2004;32:D189–D192. doi: 10.1093/nar/gkh034. [DOI] [PMC free article] [PubMed] [Google Scholar]
- 14.Murzin AG, Brenner SE, Hubbard T, Chothia C. Scop-a structural classification of proteins database for the investigation of sequences and structures. J Mol Biol. 1995;247:536–540. doi: 10.1006/jmbi.1995.0159. [DOI] [PubMed] [Google Scholar]
- 15.Dunbrack RL, Jr, Karplus M. Backbone-dependent rotamer library for proteins. Application to side-chain prediction. J Mol Biol. 1993;230:543–574. doi: 10.1006/jmbi.1993.1170. [DOI] [PubMed] [Google Scholar]
- 16.Chakrabarti P, Pal D. The interrelationships of side-chain and main-chain conformations in proteins. Prog Biophys Mol Biol. 2001;76:1–102. doi: 10.1016/s0079-6107(01)00005-0. [DOI] [PubMed] [Google Scholar]
- 17.Simms AM, Toofanny RD, Kehl C, Benson NC, Daggett V. Dynameomics: design of a computational lab workflow and scientific data repository for protein simulations. Protein Eng Des Sel. 2008;21:369–377. doi: 10.1093/protein/gzn012. [DOI] [PubMed] [Google Scholar]
- 18.Kehl C, Simms AM, Toofanny RD, Daggett V. Dynameomics: a multi-dimensional analysis-optimized database for dynamic protein data. Protein Eng Des Sel. 2008;21:379–386. doi: 10.1093/protein/gzn015. [DOI] [PubMed] [Google Scholar]
- 19.Orengo CA, Michie AD, Jones S, Jones DT, Swindells MB, Thornton JM. CATH-a hierarchic classification of protein domain structures. Structure. 1997;5:1093–1108. doi: 10.1016/s0969-2126(97)00260-8. [DOI] [PubMed] [Google Scholar]
- 20.Dietmann S, Park J, Notredame C, Heger A, Lappe M, Holm L. A fully automatic evolutionary classification of protein folds: Dali Domain Dictionary version 3. Nucleic Acids Res. 2001;29:55–57. doi: 10.1093/nar/29.1.55. [DOI] [PMC free article] [PubMed] [Google Scholar]
- 21.Beck DA, Daggett V. Methods for molecular dynamics simulations of protein folding/unfolding in solution. Methods. 2004;34:112–120. doi: 10.1016/j.ymeth.2004.03.008. [DOI] [PubMed] [Google Scholar]
- 22.Levitt M, Hirshberg M, Sharon R, Daggett V. Potential-energy function and parameters for simulations of the molecular-dynamics of proteins and nucleic-acids in solution. Computer Phys Commun. 1995;91:215–231. [Google Scholar]
- 23.Levitt M, Hirshberg M, Sharon R, Laidig KE, Daggett V. Calibration and testing of a water model for simulation of the molecular dynamics of proteins and nucleic acids in solution. J Phys Chem B. 1997;101:5051–5061. [Google Scholar]
- 24.Beck DA, Alonso DO, Daggett V. A microscopic view of peptide and protein solvation. Biophys Chem. 2003;100:221–237. doi: 10.1016/s0301-4622(02)00283-1. [DOI] [PubMed] [Google Scholar]
- 25.Lee B, Richards FM. Interpretation of protein structures-estimation of static accessibility. J Mol Biol. 1971;55:379–400. doi: 10.1016/0022-2836(71)90324-x. [DOI] [PubMed] [Google Scholar]
- 26.Beck DA, Alonso DO, Inoyama D, Daggett V. The intrinsic conformational propensities of the 20 naturally occurring amino acids and reflection of these propensities in proteins. Proc Natl Acad Sci USA. 2008;105:12259–12264. doi: 10.1073/pnas.0706527105. [DOI] [PMC free article] [PubMed] [Google Scholar]
- 27.Lipari G, Szabo A. Model-free approach to the interpretation of nuclear magnetic-resonance relaxation in macromolecules. 1. Theory and range of validity. J Am Chem Soc. 1982;104:4546–4559. [Google Scholar]
- 28.Lipari G, Szabo A. Model-free approach to the interpretation of nuclear magnetic-resonance relaxation in macromolecules. 2. Analysis of experimental results. J Am Chem Soc. 1982;104:4559–4570. [Google Scholar]
- 29.Chandrasekhar I, Clore GM, Szabo A, Gronenborn AM, Brooks BR. A 500-ps molecular-dynamics simulation study of interleukin-1-beta in water-correlation with nuclear-magnetic-resonance spectroscopy and crystallography. J Mol Biol. 1992;226:239–250. doi: 10.1016/0022-2836(92)90136-8. [DOI] [PubMed] [Google Scholar]
- 30.Levitt M. Molecular dynamics of native protein. I. Computer simulation of trajectories. J Mol Biol. 1983;168:595–617. doi: 10.1016/s0022-2836(83)80304-0. [DOI] [PubMed] [Google Scholar]
- 31.Levitt M. Molecular dynamics of native protein. II. Analysis and nature of motion. J Mol Biol. 1983;168:621–657. doi: 10.1016/s0022-2836(83)80306-4. [DOI] [PubMed] [Google Scholar]
- 32.Wong KB, Daggett V. Barstar has a highly dynamic hydrophobic core: evidence from molecular dynamics simulations and nuclear magnetic resonance relaxation data. Biochemistry. 1998;37:11182–11192. doi: 10.1021/bi980552i. [DOI] [PubMed] [Google Scholar]