

Abstract
Viral infection is normally detected either by viral culture or by PCR methods. Rarely a combination of the two techniques is used in the same study. Yet, when applied simultaneously, viral culture and PCR may reveal important features of viral biology, such as an abortive replication as in the case of respiratory syncytial virus (RSV) infection. In this unit we describe methods for detecting abortive RSV replication in a cotton rat model by using the plaque-forming unit assay and by the real-time reverse-transcription PCR (qRT-PCR) assay. All steps of the process of monitoring viral replication in vivo are described, starting from the design of animal infection protocols. We continue on to the methods for extracting and processing lung samples for viral culture and RNA extraction and finishing with the actual methods of viral titration by the qRT-PCR and the plaque-forming unit assays.
Keywords: abortive replication, RSV, cotton rat
This unit describes methods for detecting abortive viral replication in vivo in an animal model. Viral culture has long been considered the “gold standard” for laboratory diagnosis of respiratory viral infections in humans and for analysis of viral replication in animal models. Over the years, other techniques such as PCR have proven to be specific and sensitive methods of viral detection, with real-time reverse-transcription PCR (qRT-PCR) particularly well-suited for analysis of respiratory RNA viruses (Bustin and Mueller 2005). The rate of identification of viral infections in humans by viral culture is often lower than that detected by PCR and qRT-PCR (Mackay, Jacob et al. 2003; van Kraaij, van Elden et al. 2005). This finding is normally attributed to higher sensitivity of the PCR technique, but may also reflect cases when virus establishes an abortive infection in which viral genetic material is replicated, but production of infectious viral particles is impaired. Undetected by viral culture, this type of replication can only be documented by measuring viral gene expression and genome replication in infected individuals and laboratory animals by PCR.
One of the viruses for which both productive and abortive infections have been documented is Respiratory Syncytial Virus (RSV) (Boukhvalova, Yim et al. 2007). RSV is a negative strand RNA virus that is a major cause of bronchiolitis and viral pneumonia in children (Shay, Holman et al. 2001). RSV effectively establishes productive infection in naïve cotton rats Sigmodon hispidus, a preferred small animal model of human RSV disease (Niewiesk and Prince 2002; Openshaw and Tregoning 2005). When cotton rats are challenged with RSV for the second time, however, only abortive infection develops. The key for detecting all possible types of RSV replication in vivo is to analyze infection in dynamics by applying methods that allow virus monitoring both at microbiological (infectious virus generation) and molecular (replication of viral genetic material) levels. This type of analysis will constitute the scope of this unit. We will cover all steps of the process of monitoring viral replication in vivo starting from the design of animal infection protocols, continuing onto the methods for extracting and processing lung samples for viral culture and RNA extraction. We will describe the actual methods of viral titration by plaque assay and qRT-PCR measurements of RSV replication and finally discuss the ways to analyze and to interpret the data.
STRATEGIC PLANNING
To detect abortive viral replication one has to have the ability to monitor viral infection in dynamics and to compare viral replication in naïve animals to viral replication in animals immune to the virus. The abortive replication in the case of RSV infection is detected in animals that have been rendered immune to RSV by prior RSV infection. So, the experiment has to include two groups of animals: the first group is comprised of naïve animals that have never been infected with RSV before. These animals encounter RSV for the first time at the beginning of the experiment (primary infection). The second group includes animals that have been challenged with RSV once and then re-challenged again 21 days later (secondary infection). When cotton rats are challenged with RSV twice over the period of 21 days, no virus is detected by culture in the lungs of animals after the second infection. Even though no virus is detected in the lungs of re-challenged cotton rats by viral culture, replication of virus takes place and can be measured by qRT-PCR.
The samples have to be collected for viral load analysis at various time points after viral challenge: the first and only challenge in primary RSV infection, and the second viral challenge in secondary RSV infection. Animals are sacrificed and lungs are collected over a time span that includes the time of maximum virus replication in naïve animals (day 4 post-infection), as well as the time points before and after the peak viral replication. Because abortive viral replication is more rapid than the productive one, early time points post-infection have to be included in analysis. We find that collecting lungs at 6 and 12 hours, days 1, 2, 4, 7, and 14 post-infection works best for detection of abortive RSV replication in the cotton rat model. The same time points are used for both primary and secondary infection to allow parallel analysis of samples.
Two different methods for detection of abortive viral replication are required: viral culture and qRT-PCR method. Replication is abortive when there is a discrepancy between the amount of viral genetic material accumulated (detected by qRT-PCR) and the amount of progeny virus released (detected by viral culture). It is thus important to be able to quantify extent of viral load by qRT-PCR and by viral culture assays in the same sample and to correlate the data yielded by the two techniques.
BASIC PROTOCOL 1 INFECTION OF COTTON RATS WITH RSV; HARVESTING AND PROCESSING OF LUNGS
Several animal models of RSV disease exist (Byrd and Prince 1997). Among the ones most faithfully representing RSV disease manifestation in humans are cotton rat, African green monkey and the calf model of bovine RSV. The cotton rat is the preferred small animal model of RSV infection (Siber, Leombruno et al. 1994; Johnson, Oliver et al. 1997; Maggon and Barik 2004). Cotton rats are highly permissive for RSV infection and display histopathological features of the disease similar to that observed in humans (Prince, Jenson et al. 1986; Prince, Prieels et al. 1999). In this unit we describe a method for establishing RSV infection of cotton rats and for obtaining samples for analysis of RSV replication in the lungs. For all our experiments we use cotton rats S. hispidus from an inbred colony maintained at Virion Systems, Inc.
Materials
Cotton Rats S. hispidus 4–8 weeks-old
RSV A/Long (>107 pfu/ml)
Isoflurane Anesthesia Chamber
CO2 Chamber
Syringes (1ml)
Needles (21G)
Dissecting forceps
Dissecting scissors
70% alcohol
Liquid nitrogen
Sterile polysterene round bottom tubes with caps, 12 × 75 mm
Sterile Tenbroeck tissue homogenizers
Sterile 4 ml glass sample vials with caps
Sterile glass Pasteur pipettes
Cryotubes
Centrifuge, refrigerated
Inoculate cotton rats with RSV
-
1
Obtain young (4-8-week-old) S. hispidus cotton rats.
Young animals are required to reproduce dynamics of viral replication described under Commentary. Cotton rats older than 6 months of age have delayed viral clearance from the lungs (Curtis, Ottolini et al. 2002; Boukhvalova, Yim et al. 2007).
-
2
Dilute RSV stock solution with PBS, pH 7.4 to obtain 106.6 pfu/ml. Keep diluted virus on ice.
-
3
Anesthetize cotton rats in isoflurane chamber.
Take necessary precautions when catching cotton rats and placing them into anesthesia chamber. Cotton rats behave very differently from the common laboratory mice, in that cotton rats are more aggressive and very fast. Make sure to wear thick gloves when handling alert cotton rats to prevent being bitten. Quick reflexes on behalf of an investigator are a must!
-
4
Draw viral solution into a syringe with 21G needle attached.
-
5
Remove the animal from the anesthesia chamber and inoculate it with 100 μl viral solution from syringe by depositing drops at the nostrils’ opening, alternating nostrils for each consecutive drop.
Wear goggles and protective clothing.
Hold the animal in one hand, placing it belly-up on a palm and supporting the back of its head with four fingers. Use a thumb of that hand to push up on the chin of the animal to ensure that the mouth is closed. This will force the animal to aspirate viral solution through the nose. Animals have to be well-anesthetized prior to virus inoculation. If awaken during inoculation, animal can puff the viral solution out, compromising efficiency of infection and spreading virus around the work area.
-
6
After infection, place the animal back into the cage, monitoring it for several minutes to ensure that the animal successfully wakes up from the anesthesia.
If it takes longer than a few minutes for the animal to wake up, gently massage the sides of its chest cavity with one hand.
-
7
For secondary RSV infection studies, re-infect cotton rats 21 days later in the same manner as described in steps 2–6.
When carrying an experiment with both secondary and primary RSV infection, do not infect the group of animals for primary infection studies until 21 days into the experiment. Infect the animals for secondary infection studies on days 0 and 21. Infect the animals for primary infection studies on day 21. All animals (for both secondary and primary infections studies) should be age-matched on day 0. This way they will be age-matched at the time of sacrifice.
Sacrifice cotton rats
-
8
Sacrifice groups of animals via carbon dioxide asphyxiation at 6hr, 12hr, day 1, 2, 4, 7, and 14 after RSV inoculation* (4 animals per time point).
*This will be the first RSV inoculation for the primary RSV infection group and the second RSV inoculation for the secondary RSV infection group.
-
9
One group of animals should be sacrificed prior to infection (0h) to serve as control.
Harvest lungs
-
10
Remove the lungs from the thorax using dissecting scissors and forceps.
-
11
Separate the left lung from the right lung.
The right lung will be used for the qRT-PCR analysis and the left lung will be used for the RSV titration by plaque assay.
Allocate lungs for RNA extraction
-
12
Trisect the right lung indo individual lobes. Place each lobe in a separate cryotube and snap-freeze the tubes in liquid nitrogen. Transfer the tubes to dry ice and then to −80°C freezer.
Work fast. Minimizing the time between the lung extractions and freezing the lung pieces in liquid nitrogen is crucial for ensuring good quality RNA preparation.
Process lungs for plaque assay
-
13
Place the entire left lung into a sterile Tenbroeck tissue homogenizers with 10 parts (wt/vol) of homogenization media. Homogenize in two- three short bursts, place tubes on ice.
The entire left or right lung weights approximately 0.15 grams, therefore it should be homogenized in 1.5 ml media.
-
14
Following homogenization, pour samples into individually labeled sterile polysterene round-bottom tubes with caps and centrifuge specimens at 770g at 4°C for 10 minutes.
-
15
Transfer supernatants using glass Pasteur pipettes into sterile glass sample vials and quick freeze aliquot specimens on dry ice. Store specimens at −80°C until assayed.
BASIC PROTOCOL 2 REAL-TIME REVERSE TRANSCRIPTION PCR (qRT-PCR) ANALYSIS OF RSV INFECTION
Real-time PCR analysis has been used in the past to detect RSV infection (Falsey, Formica et al. 2002; Falsey, Formica et al. 2003; Hu, Colella et al. 2003; Perkins, Webb et al. 2005). However, this method has never been used to monitor dynamics of RSV infection in progression. We have established conditions for measuring expression of RSV genes and production of RSV genome/antigenome in vivo and in vitro (Boukhvalova, 2007 #56). This unit will describe steps required to analyze RSV infection in the lungs of cotton rats using qRT-PCR assay. Viral RNA is extracted from the lungs and reverse-transcribed. Expression of individual viral genes is measured. RSV amplicons NS1, N, M, G, F, M2 and L are targeted for quantification. All amplicons are less than 100 nucleotides in size, with primers defining them shown in Table 1.
Table 1.
Primers used for the real-time PCR analysis of RSV amplicons
| Viral Gene | Forward primera | Reverse primera | Start of Forward Primerb | Amplicon Length |
|---|---|---|---|---|
| NS1 | CACAACAATGCCAGTGCTACAA | TTAGACCATTAGGTTGAGAGCAATGT | 231 | 83 |
| N | AAGGGATTTTTGCAGGATTGTTT | CTCCCCACCGTAGCATTACTTG | 719 | 66 |
| M | ATGTGCTAATGTGTCCTTGGATGA | TGATTTCACAGGGTGTGGTTACA | 270 | 68 |
| G | CGGCAAACCACAAAGTCACA | TTCTTGATCTGGCTTGTTGCA | 191 | 64 |
| F | TAAGCAGCTCCGTTATCACATCTC | ATTGGATGCTGTACATTTAGTTTTGC | 1205 | 74 |
| M2 | CATGAGCAAACTCCTCACTGAACT | TCTTGGGTGAATTTAGCTCTTCATT | 294 | 80 |
| L | CACTCTACAAAACAAAAAGACACAATCA | AGGATGCTGCATTGAACACATT | 529 | 72 |
Primers designed using Primer Express® software
The number of nucleotides from the first nucleotide in the start codon (ATG) to the beginning of the amplicon
Materials
14 ml Polypropylene Round-Bottom Tubes
Probe Homogenizer
RNeasy Midi kit (Qiagen)
Thermocycler
96-well PCR Plates
Single channel pipetter, 20–1000 μl
12-channel pipetter, 20–200 μl
Bio-Rad iCycler with iQ5 software
iQ™ SYBR Green Supermix (Bio-Rad)
iQ™ 96-well PCR plates (Bio-Rad)
Microseal ‘B’ Adhesive Seals (Bio-Rad)
Extract RNA from lungs
-
1
Place 3.5 ml RLT buffer (RNeasy kit) supplemented with 10 μl/ml β-mercaptoethanol (RLT/ME buffer) into a 14 ml polypropylene tube. Add a frozen piece of lung to the solution and homogenize using probe homogenizer in two-three short bursts. Immediately freeze the homogenized lung on dry ice and transfer to −80°C freezer.
This step can be performed several days before the actual RNA extraction.
The size of the lung piece sufficient for RNA extraction should be more or equal to ~1/6th of the entire lung. We normally use one of the three lobes of the right lung, or a half of the upper lobe of the left lung for RNA extraction. Note! Lung tissue has to be frozen in liquid nitrogen immediately after extraction (see Basic Protocol 1). Otherwise quality of RNA preparation may be compromised.
Wash the probe well between the samples to prevent cross-contamination. We find that brief bursts of the homogenizer probe in two separate 50 ml tubes with 50 ml dH2O in each and an additional burst in 30 ml RLT/β-ME buffer between each sample is sufficient to prevent cross-contamination of samples.
-
2
On the day of the RNA extraction thaw lung homogenates in 37°C water bath for 15 min.
-
3
Centrifuge the homogenates for 10 min at 4,000g.
-
4
Transfer 2 ml of supernatant to a prepared 15 ml tube with 2 ml 70% ethanol.
Avoid upper phase when withdrawing supernatants.
-
5
Mix by inverting the tube vigorously 5–7 times, load the mixture onto the RNeasy Midi column.
-
6
Centrifuge the column and proceed with the protocol as specified in the RNeasy Midi kit brochure. Include the DNase treatment step as specified in the RNeasy Midi kit brochure.
Omitting the DNase treatment step would result in RNA preparation contaminated with genomic DNA. This may compromise accuracy of the qRT-PCR analysis.
-
7
Elute RNA from the RNeasy Midi column with 150 μl dH2O. Repeat elution with 50 μl dH2O. Measure RNA concentration.
Prepare cDNA
-
8
Combine 1μg of total RNA with 1 μl of oligo dT* primer in 20 μl total reaction volume in a 96-well PCR plate. Set up one reverse transcription (RT) reaction for each animal.
Use DEPC-treated water to bring final reaction volume to 20 μl.
*oligo dT primer should be used for analysis of RSV genes’ expression and for measurements of housekeeping gene β-actin mRNA. For analysis of the amount of RSV genome or antigenome use primer 5′ CAATGAACTAGGATATCAAGAC 3′ or primer 5′ GTCTTGATATCCTAGTTCATTG 3′, respectively (1 μl of 10 μM stock solution). The sequences of the last two primers correspond to the positive and negative strands within the intergenic region between SH and G genes of RSV.
-
9
Set up two additional RT reactions using RNA from two animals sacrificed on day 4 after primary RSV infection.
These two cDNAs will be used for standard curve construction. Animals sacrificed 4 days after primary RSV infection are chosen as the source of RNA for standard curve because of the highest level of RSV replication observed on that particular day in the cotton rat model.
-
10
Cover the plate and incubate it at 70°C for 10 min in a thermocycler.
-
11
Remove the plate from the thermocycler. Add a mixture containing PCR Buffer (final concentration 1X), MgCl2 (final concentration 2.5 mM), dNTP (final concentration 0.5 mM), DTT (final concentration 10 mM), and SR II RT (final concentration 200 U per reaction) to each well. Cup the plate and mix the contents of the plate by vortexing.
-
12
Briefly centrifuge the plate and return it to the thermocycler for 60 min at 42°C, followed by 15 min at 70°C.
-
13
Add 80 μl of dH2O upon completion of cDNA synthesis, resuspend well.
Prepare standard curve cDNA
-
14
After the cDNA synthesis is complete and 80 μl of dH2O is added to each well, combine the contents of the two extra reactions that were set up using RNA from animals sacrificed day 4 post-primary-RSV infection into the same well (resulting volume: 200 μl). This will be the first cDNA in a dilution series of the standard curve samples.
-
15
Serially dilute this cDNA 1:2, 1:4, 1:8, 1:16, and 1:32 with dH2O and use it together with the dilutions to comprise a standard curve.
Store the cDNA plate at −20°C in between uses.
Set up real-time PCR reactions
Note! Before starting to set real-time PCR reactions, turn on the lamp on the Bio-Rad iCycler as it takes time to warm up for the run.
-
16
Obtain an iQ™ 96-well PCR plates.
-
17
Prepare a premix by combining (per reaction): 12.5 μl SYBR Green Supermix; 1.25 μl of each primer (from 10 μM stock) in an appropriate primer pair given in Table 1; 7 μl dH2O. Mix enough for all animal samples to be run in duplicates, for the standard curve reactions to be run in duplicates plus for 2–3 extra reactions. Aliquot 22 μl of premix in each well of a 96-well plate.
A 64-nucleotide amplicon in the β-actin transcript is amplified using primers 5′ TACGCCAACACAGTGCTGTCT 3′ (forward) and 5′ TCTGCATCCTGTCGGCAAT 3′ (reverse).
-
18
Add 3 μl of cDNA to 22 μl of premix in a 96-well plate.
Use multichannel pipette to transfer cDNA from the cDNA plate to a plate containing PCR pre-mix.
-
19
Cover the plate with Microseal ‘B’ Adhesive Seal, making sure it is firmly and uniformly attached throughout the plate.
-
20
Vortex the plate and briefly centrifuge at 800g to bring contents of the wells down to the bottom.
-
21
Set the plate into the Bio-Rad iCycler.
-
22
Run the following program: 1 cycle of 95°C for 3 min; 40 cycles of 95°C for 10 s; 60°C for 10 s; 72°C for 15 s.
There is no need to run melting curves for the primer pairs given in Table 1, as we have completed melting curves for each primer pair used in this work and no non-specific amplification was noted under conditions tested.
If amplifying a certain gene product not specified here, program the PCR machine to add a melting curve at the end of the PCR reaction to check that particular primer pair for a potential for amplifying multiple products.
Analyze real-time PCR assay results
-
23
The baseline cycles and cycle threshold (Ct) will be calculated automatically by the iQ5 software in the PCR Base Line Subtracted Curve Fit mode.
-
24
Plot the average Ct values for the standard curve samples against log10 cDNA dilution factor.
Individual standard curves should be constructed for each gene analyzed.
-
25
Use this curve to convert the average Ct values obtained for different samples to relative expression units. These relative expression units then should be normalized to the level of β-actin mRNA (“housekeeping gene”) expressed in the corresponding sample.
-
26
Calculate β-actin normalization values for each animal:
select the lowest β-actin relative expression unit value by comparing units obtained for different animals;
-
divide the β-actin relative expression units obtained for all animals by that lowest β-actin relative expression unit.
Note! For the animal selected in 26a β-actin normalization value would equal 1.
-
27
Divide relative expression units obtained for genes other than β-actin by the β-actin normalization values.
-
28
For groups of animals, express mRNA levels as the geometric mean ± SEM for all animals in a group at a given time.
BASIC PROTOCOL 3 PLAQUE-FORMING UNIT ASSAY OF RSV PRODUCTION
This protocol describes the method to determine viral load in the lungs of RSV-infected animals by a plaque-forming unit assay (“plaque assay” in short). Monolayers of HEp-2 cells are inoculated with the homogenates of lung tissue. The infected monolayers are incubated in semi-solid methyl cellulose media for several days to allow formation of plaques. Because semi-solid media prevents spread of the virus (otherwise seen in liquid media), infection of cells is localized and virus released from an infected cell can infect only cells in the immediate surrounding of the originally-infected one thus producing a plaque. The plaques are visualized against background of healthy cells stained with crystal violet stain. One plaque corresponds to one plaque-forming unit of RSV and total number of plaques reflects amount of infectious virions present in the original lung sample.
Materials
24-well tissue culture plates
Humidified Incubator, 37°C, 5% CO2
Tissue culture flasks, 162–175 cm2
Serological Pipettes
Single channel pipetter, 100–1000 μl
12-channel pipetter, 20–200 μl
Vacuum pump with side-arm flask and tubing
Squeeze bottle containing Crystal violet stain
Dissecting microscope
Prepare HEp-2 monolayers
-
1
Seed HEp-2 cells on 24-well tissue culture plates at 1*105 cells/well.
-
2
Incubate the plates in a humidified incubator until the cell monolayer achieves confluency.
It takes 2 to 3 days for the HEp-2 monolayer to achieve confluency.
Prepare samples for titrations
-
3
Thaw lung homogenates (prepared as described in steps 13–15 of Basic Protocol 1) at room temperature.
-
4
Prepare 1:10 and 1:100 serial dilutions of samples in unsupplemented EMEM.
Inoculate HEp-2 monolayers
-
5
Aspirate half of the media from each well of the HEp-2 seeded 24-well culture dishes.
-
6
Inoculate wells with 50 μl of neat, 1:10 and 1:100 dilutions of each sample in duplicates.
-
7
Incubate the inoculated 24-well culture dishes for 1 hour in the incubator.
-
8
After the incubation period, aspirate the remaining media from each well of the culture dishes.
-
9
Overlay each well with 1 ml of the methyl cellulose overlay media.
-
10
Incubate the plates for 4 days in the incubator.
Stain and read the titration
-
11
Remove the overlay from each well.
-
12
Add 0.5 ml of crystal violet stain to each well. Allow plates to incubate with crystal violet stain for no less than 20 minutes at room temperature.
-
13
Remove stain by rinsing each plate two to three times under cold water until the water runs clear.
-
14
Place the plate upside-down to air dry.
The plates have to be completely dry prior to reading.
-
15
Under a dissecting microscope count the number of plaque forming units (PFU) per well. Select the sample dilution which allows for the most reproducible counting of PFU’s.
-
16Calculate the corresponding RSV titer in plaque forming units (PFU) per gram of tissue using the following equation:
EQUATION *0.1 ml total volume: 50μl of sample inoculated onto cells in duplicate = 50 μl + 50 μl
†dilution factor from processing the tissue, remains at a constant of 10x
The limit of the sensitivity of the assay is 1 × 10² PFU/gram of lung tissue.
-
17
Determine the geometric mean ± SEM for all animals in a group at a given time
SUPPORT PROTOCOL 1 RSV INFECTION OF A549 EPITHELIAL CELLS
Materials
Human alveolar epithelial type II cell (A549) culture
Tissue culture flasks (75–175cm2)
6-well tissue culture plates
Humidified Incubator, 37°C, 5% CO2
Serological pipettes
Eppendorf tubes
Single channel pipetter, 20–1000 μl
12-channel pipetter, 20–200 μl
RNeasy Midi kit (Qiagen)
Prepare A549 cells for infection
-
1
Propagate A549 cells in A549 Growth Media in a humidified incubator in 75–175cm2 tissue culture flasks.
-
2
Dilute cells to 2*105 cells/ml and plate on 6-well plates at 2 ml/well. Leave the plate in the incubator for two days.
Infect A549 cells with RSV
-
3
Trypsinize the cells in one well, mix with trypan blue (1:1) and count cells using hematocytometer.
-
4
Dilute RSV in plain DMEM media to yield various MOIs (0.001–0.1).
The calculations should be based on the fact that 500 μl of viral solution per well will be used for infection.
-
5
Wash the cells twice with PBS, pH7.4, by adding 2 ml PBS to each well, swirling solution around the well, and aspirating PBS out.
Washing the cells with PBS removes traces of FBS present in A549 growth media. Residual FBS may reduce efficiency of infection.
-
5
Add viral solution to the wells of cells to be infected (each treatment should be done in duplicates) and place the plate into the incubator for a total of 1 hour. During that hour, rock the plate every 15 minutes to uniformly cover the cells with viral solution.
The small volume of viral solution, barely covering the cell monolayer, is crucial for efficient infection.
-
6
Aspirate viral solution and replace it with the A549 growth media. Return the plate to the incubator.
Collect supernatants for RSV titrations by the plaque-forming unit assay
-
7
Harvest cell supernatants into Eppendorf tubes at various times post-infection.
-
8
Centrifuge supernatants for 5 min at 500g at 4°C in a microcentrifuge, and freeze cleared supernatants at −80°C for further analysis.
Determine viral titer in the supernatants by the plaque-forming unit assay
-
9
Titrate supernatants as described in Basic Protocol 3 with the following modifications:
prepare 1:10, 1:100, and 1:1000 dilutions of supernatants for titration
- use the following formula to calculate viral titers:
Collect cells for RSV replication analysis by real-time PCR assay
-
10
Cells in the wells from which supernatants were harvested for viral titration by plaque assay should be collected for RNA extraction. Remove traces of media from the wells and add 400 μl RLT/ME buffer per well. Resuspend the cells in RLT/ME by pipetting up-and-down.
A lot of attention should be given to cell pipetting in RLT/ME buffer. At least 7–10 rounds have to be performed to ensure successful RNA isolation later on. Avoid foaming the solution when resuspending.
-
11
Add 400 μl 70% ethanol to each well. Mix with the contents of a well by pipetting up-and-down 2–3 times, load the mixture onto the RNeasy Mini kit (QIAGEN) column.
-
12
Proceed with the RNA extraction using RNeasy Mini kit. Include the DNase treatment step as specified in the RNeasy brochure.
Analyze RSV replication in A549 cells by real-time PCR assay
-
13
Prepare cDNA from 1 μg total RNA as described in Basic Protocol 2.
-
14
Use RNA from highly-infected cells (e.g., wells infected with RSV at MOI 1 for 24h) to prepare cDNA for a standard curve.
-
15
Amplify viral genes and β-actin using primers described above.
Because of high sequence similarity between human and cotton rat β-actin gene, the same set of primers is used for the β-actin amplification in A549 cells and in cotton rat lung samples.
-
16
Use the standard curve to obtain relative expression units for all genes and normalize them by the β-actin mRNA expression level as described in Basic Protocol 2.
-
17
Express mRNA levels as the mean ± SEM for two different wells of cultures.
REAGENTS AND SOLUTIONS
A549 Growth Media
Dulbecco’s modified Eagle’s medium (DMEM)
10% fetal bovine serum (FBS)
100 IU/ml of penicillin
100 μg/ml streptomycin
2 mM L-glutamine
Crystal Violet Fixative/Stain
0.067% (w/v) Crystal violet
1.25% (v/v) Glutaraldehyde in water.
Diluent Media (for sample dilution in plaque assay)
EMEM with Earle’s BSS.
Dulbecco’s modified Eagle’s medium (DMEM)
Eagles’s Minimum Essential Media (EMEM)
Fetal Bovine Serum (FBS)
HEp-2 Growth Media
EMEM with Earle’s BSS
10% FBS
2 mM L-glutamine
50 μg/ml Gentamicin
2.5 μg/ml Fungizone
1X Pen-Strep.
Homogenization Media (for lung processing for plaque assay)
Hanks balanced salt solution (HBSS)
0.218 M sucrose
4.4 mM glutamate
3.8 mM KH2PO4
7.2 mM K2HPO4
Methyl Cellulose Overlay Media
EMEM
0.75% (w/v) Methyl cellulose
1% FBS
2 mM L-glutamine
50 μg/ml Gentamicin
2.5 μg/ml Fungizone.
Phosphate Buffered Saline (PBS), pH7.4
REAGENTS FOR qRT-PCR
dNTP 10 mM (Invitrogen)
DTT 0.1 M (Invitrogen)
oligo dT 0.5 μg/μl (Invitrogen)
MgCl2 50 mM (Invitrogen)
PCR Buffer 10X (-MgCl2) (Invitrogen)
RNase-free DNase (Qiagen)
SS II RT 200 U/μl (Invitrogen)
COMMENTARY
Background Information
RSV is an enveloped non-segmented, negative strand RNA virus that belongs to the family Paramyxoviridae. The RSV genome contains 10 genes in the order NS1, NS2, N, P, M, SH, G, F, M2, L from the 3′ end, which give rise to 11 proteins (M2 ORF encodes two proteins: M2-1 and M2-2). RSV proteins include 3 transmembrane surface proteins G, F, and SH; the virion matrix protein M; the nucleocapsid proteins L, N, P, M2-1 and M2-2, and the two putative non-structural proteins NS1 and NS2. RSV genes are transcribed sequentially from the 3′ end of the genome, with promoter-proximal genes transcribed more frequently than downstream genes (Collins and Wertz 1983). This results in a transcription gradient characteristic also of other mononegaviruses. Upon accumulation of virally-expressed proteins in infected cells, RSV begins a replicative cycle, in which a positive-strand copy of genome, the antigenome, is synthesized as an intermediate. Both genomic and antigenomic RNA get packaged into completed virions, in a process dependent on ongoing viral protein synthesis (Huang and Wertz 1982).
Respiratory syncytial virus (RSV) is a major cause of bronchiolitis and viral pneumonia in young children, and the primary viral cause of death in infants (Shay, Holman et al. 2001; Thompson, Shay et al. 2003). Bronchiolitis caused by RSV affects most infants during their first and second months of life, but reinfection (often occurring with milder symptoms or asymptomatic) is common. By the age of 2, all children have been infected with RSV at least once, and half of the children had been reinfected (Glezen, Taber et al. 1986). RSV infection in children is associated with recurrent wheezing later in life, pointing to a link between RSV and inflammatory-allergic disorders (Stein, Sherrill et al. 1999; Sigurs, Bjarnason et al. 2000; Schauer, Hoffjan et al. 2002). Animal studies in the cotton rat model indicate that inflammatory changes in the lung are elicited in animals immune to RSV, even in the absence of detectable virus production (Prince, Jenson et al. 1986). One likely explanation for that phenomenon could be abortive viral replication triggering an inflammatory response in the lung.
Abortive replication of RSV may indicate that re-infection with RSV occurs more frequently than currently appreciated. Typically, RSV infection is diagnosed by the isolation of virus from respiratory secretions of infected individuals. These cases would represent children infected with RSV for the first time, as well as children and adults reinfected with RSV after a certain period of time sufficient for the immune protection against virus to wane. However, our results suggest that re-infections might also occur shortly after previous challenge and happen at a time when immune response is sufficiently strong to suppress productive infection, but not abortive replication of the virus. Clinically, these re-infections would be characterized by expression of viral antigens in the absence of virus production, and may go undetected if viral cultures are used to monitor disease. Notably, results of several recent human studies support the possibility of frequent “abortive” RSV infections. These studies, in which respiratory secretions were analyzed for RSV presence by viral culture and by RT-PCR, revealed that consistently more samples test positive for RSV by RT-PCR than by culture (Falsey, Formica et al. 2002; Falsey, Formica et al. 2003; Hu, Colella et al. 2003; Perkins, Webb et al. 2005). These results might indicate that some individuals with RSV detected by RT-PCR, but not by culture, might have recently recovered from RSV and are currently undergoing re-infection accompanied by abortive replication of the virus.
Critical Parameters and Troubleshooting
The critical parameter for abortive viral replication is establishing immunity strong enough to suppress productive replication of the virus in the lung. In the cotton rat, infection of animals with less that ~104 pfu RSV/animal produces only partial immunity and virus can be recovered from the lungs of animals re-infected with RSV 21 days later. In this case, abortive replication of RSV would be masked by the production and release of infectious virions in the lung. If this situation occurs after following the protocols described here, an experimentator should re-check the titer of the RSV virus stock used in his/her lab to ensure it is of correct concentration. If the titer turns out to be lower than expected value, the amount of viral inoculum needs to be increased in the priming and re-challenge dose accordingly.
If using an animal model other than cotton rat to monitor abortive replication of RSV, one would need to determine the amount of viral inoculum establishing sterilizing immunity (as defined by the absence of infectious virions in the lungs after re-challenge) in the lungs of that particular animal. In order to do that, animals have to be inoculated with various doses of RSV at time 0, re-infected with ~105–6 pfu RSV/animal 21 days later and sacrificed at the time of peak RSV replication. The dose of RSV causing sterilizing immunity in the lung, should be used in all experiments on abortive RSV replication.
The critical parameters and troubleshooting relating to Basic protocols 1–3 were addressed in the corresponding sections.
Anticipated Results
Each primer pair given in Table 1 can be expected to successfully amplify the appropriate DNA fragment, with efficiencies between primer pairs being nearly identical (98–99%) (Fig. 1A). This is best demonstrated when a standard curve is developed using serial 10-fold dilutions of plasmid containing entire RSV antigenome (correlation coefficients of 0.996–0.998). When used for analysis of RSV replication in vitro (see Support Protocol 1), qRT- PCR assay described in Basic Protocol 2 accurately reflects viral load as estimated by the plaque assay (Basic Protocol 3). We have addressed this issue using cultures of alveolar epithelial cells A549 infected with RSV. As shown in Figure 1B, infection of A549 cells is slow, with transcripts of RSV genes appearing at 6 hrs, and accumulating considerably by 24 hrs post-infection, consistent with reports of RSV-infection of epithelial cells measured by other methods (Bermingham and Collins 1999). A pronounced gradient of RSV gene expression is apparent in infected A549 cells, with amounts of transcripts diminishing dramatically in the order from NS1 to L. Reverse transcription with oligo dT primer, used in this and other similar experiment, results in a cDNA pool that contains not only reverse-transcribed copies of individual mRNA produced during RSV transcription, but also copies of RSV antigenome. However, because antigenome would be represented similarly in reactions for different RSV genes, the differences between amplicon levels measured by RT-PCR here are attributed to differences in gene expression levels. Therefore, fluctuations in the different RSV amplicons’ levels measured in oligo dT cDNA can be expressed as the gene expression differences.
Figure 1.
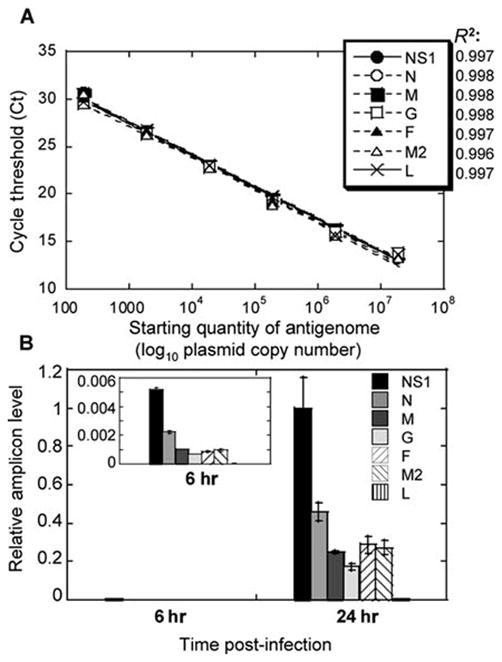
Establishing real-time PCR assay of RSV replication. A: Amplification of various RSV genes from RSV antigenome inserted into a vector. Six 10-fold dilutions of antigenome-containing vector were used to generate a standard curve. Ct values were plotted against log10 quantity of antigenome used as a template. Correlation coefficients (R2) of the best fit are shown next to the symbols corresponding to the 7 RSV genes analyzed. Each point on this graph includes symbols for all 7 genes. B: Expression of RSV genes in infected A549 cells. A549 cells were infected with RSV at MOI 0.1. Six and 24 hours after infection, total RNA was extracted from infected cells and reverse transcribed using oligo dT primer. Expression of mRNA for each RSV gene indicated was measured by real-time PCR. Relative level of each amplicon was normalized by β-actin mRNA level (also measured by real-time PCR) in the corresponding sample, and expressed relative to the level of NS1 amplicon at 24 hours. The insert shows gradient of RSV gene expression at 6 hrs on an adjusted Y-scale to highlight differences between levels of various amplicons. The results represent the mean ± SEM for two different wells per time point.
The RT-PCR assay of RSV replication described above can be expected to accurately quantify viral load in infected cells. To verify that we inoculated A549 cells with RSV at various MOIs (0.001–0.1). Forty-eight hours after infection cell supernatants were collected for viral titrations, while the cells themselves were lysed for RNA extraction. Viral yield in supernatants of A549 cells accurately represented the level of infection (Table 2). Cells infected with the 10-fold-increasing amount of RSV release virus in the quantities that also differ by ~10-fold. When viral RNA from these cells is analyzed by RT-PCR using primers for RSV NS1 gene, the difference in the amount of NS1 amplicon detected in A549 cells also differs by ~10-fold between cultures infected with RSV at MOI 0.001, 0.01, and 0.1, respectively. The level of negative-sense (genome) and positive-sense (antigenome) RNA can also be measured in RSV-infected cells (Table 2). For that, total RNA of infected cells is reverse-transcribed using forward or reverse primer annealing to genomic or antigenomic strand of RSV, respectively. The amount of reverse-transcribed product can then measured by real-time PCR using primers specific for RSV amplicons G or M, proximal to the start of genome or antigenome fragment prepared, respectively. In infected A549 cells, amount of genome and antigenome increases progressively between samples infected with increasing amount of RSV, similar to the pattern of viral gene expression (Table 2), although reflecting less precisely differences between MOIs of infection and viral yield in infected cells. Real-time PCR analysis of extracts of cells infected with RSV indicates that RSV genome was ~3-4-fold more abundant in infected cells than antigenome, consistent with reports for other paramyxoviruses, in which antigenome constitutes only 10–40 % of genome in infected cells (Robinson 1970; Kolakofsky, Spahr et al. 1974; Kolakofsky and Bruschi 1975).
Table 2.
Comparison of RSV detection by viral culture and real-time PCR in RSV- infected epithelial cells.
| MOI 0.001a | MOI 0.01 | MOI 0.1 | |
|---|---|---|---|
| Viral Yield (log10 pfu/ml) | 2.24 ± 0.06 | 3.26 ± 0.20 | 4.77 ± 0.25 |
| RSV Gene Expression Levelb | 0.004 ± 0.001 | 0.069 ± 0.005 | 1 ± 0.1909 |
| RSV Genome Levelc | 0.0009 ± 0.0002 | 0.020 ± 0.003 | 1 ± 0.117 |
| RSV Antigenome Levelc | 0.0003 ± 0.0002 | 0.005 ± 0.002 | 0.269 0.057 |
A549 alveolar epithelial cells were infected with RSV at MOI 0.001–0.1. 48 hrs after infection cell supernatants were collected for quantification of viral yield by plaque assay, while cells themselves were lysed and used as a source of RNA for real-time PCR analysis of RSV transcripts.
Expression of RSV NS1 amplicon was analyzed by real-time PCR, normalized by the expression of β-actin in the corresponding cell culture, and presented relative to the amount NS1 amplicon in MOI 0.1-infected culture (assigned relative value of 1).
Expression of RSV genome and antigenome was analyzed by real-time PCR, normalized by the level of β-actin in the corresponding cell culture, and presented relative to the amount genome in MOI 0.1-infected culture (assigned relative value of 1).
In vivo replication of RSV can also be accurately assessed by qRT-PCR. Infection of naïve cotton rats with RSV (primary RSV infection) results in efficient virus replication in the lungs that reaches peak on day 4 post-infection and disappears by day 7 (Fig. 2A). Genome and antigenome synthesis in primary RSV infection (Fig. 2B) increases progressively following RSV challenge, reaching its peak on day 4 post-infection, and diminishing after that. This pattern of genome/antigenome production parallels amount of infectious viral particles detected in the lungs of animals with primary RSV infection (Fig. 2A) on corresponding days. The only difference is seen for day 7, when no virus can be recovered from the lungs, and yet genomic and antigenomic strands of RSV can still be detected.
Figure 2.
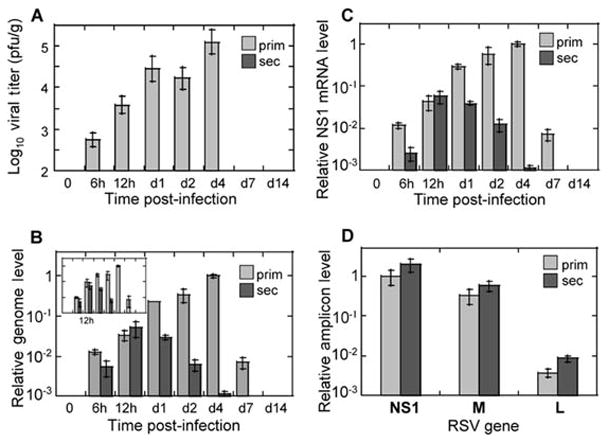
RSV replication in vivo: evidence of abortive replication in the reinfection model. Cotton rats were infected with RSV once for primary infection studies or twice (with an interval of 21 days) for secondary infection studies. At the indicated time points after the final challenge lungs were collected for viral titer determination by plaque assay (A) or for analysis of RSV replication by real-time PCR (B-D). A: Pulmonary viral titers in cotton rats with primary RSV infection (“prim”, light gray bars) and secondary RSV infection (“sec”, no virus detected). Viral titers were determined by plaque assay as previously described (Prince, Jenson et al. 1978) (limit of detection 2 log10 pfu/g). B: RSV genome and antigenome replication in primary and secondary RSV infection. RNA was extracted from the lungs of infected animals and reversed transcribed using primers complementary to the genomic or antigenomic strand of RSV. Relative genome (and antigenome, insert) amounts were determined by real-time PCR, normalized by the β-actin mRNA level in the corresponding sample, and expressed relative to the level of genome (antigenome, for insert) detected in the lungs of animals with primary RSV infection on day 4. C: Expression of RSV genes during primary and secondary RSV infection. RNA extracted from animals described above was reverse-transcribed using oligo dT primer. Expression of NS1 mRNA was measured by real-time PCR, normalized by β-actin as described above, and expressed relative to the level of NS1 mRNA detected in the lungs of animals with primary RSV infection on day 4. D: Gradient of RSV gene expression at 12 hours post-infection in primary and secondary RSV disease. NS1, M, and L amplicon levels were measured by real-time PCR in cDNA prepared using oligo dT primer. Expression of each amplicon was normalized by β-actin, and expressed relative to the level of NS1 mRNA detected in the lungs of animals with primary RSV infection. The results represent the mean ± SEM for 4 animals per time point for each primary and secondary infection.
If animals inoculated with RSV once are kept for 21 days and then re-challenged with RSV (secondary RSV infection), no virus is detected in the lungs of such animals by viral culture (Fig. 2A). Viral RNA expression in secondary RSV infection, however, can be expected to reach high levels. As Figure 2B shows, secondary RSV infection of cotton rats is accompanied by efficient synthesis of both genomic and antigenomic strands of RSV. It reaches peak at 12 hrs post-infection and declines afterwards to undetectable level by day 7. Production of genomic/antigenomic RNA is indistinguishable between primary and secondary RSV infection at 12 hours post-infection. After that the amount of viral RNA in animals with secondary infection starts to decrease, and the differences between primary and secondary infection increase in magnitude with each subsequent time point as infection progressed. Because the scales of changes in viral titer and RSV RNA production in Figures 2A and 2B were set to be comparable (spanning 3 orders of magnitude each), the large discrepancy in the extent of viral RNA replication and production of infectious viral particles during secondary RSV infection can be easily appreciated. For example, while the amount of infectious viral particles on day 1 in primary RSV infection is at least 288-fold higher than in secondary RSV infection (taking 2 log10 pfu/g detection limit into account and allowing for the possibility of the presence of some undetectable virus in the lungs of secondarily-infected animals), the difference in RSV RNA level between primary and secondary infection is only 8-fold.
Expression of individual RSV genes during RSV infection in vivo can also be analyzed during primary and secondary RSV infection of cotton rats. The dynamics of RSV gene expression changes can be expected to be very similar to those of genome/antigenome variations noted above, and are exemplified by changes in the NS1 amplicon level shown in Figure 2C. NS1 gene expression in secondary RSV infection increases between 6 and 12 hrs, and declines afterwards, while NS1 expression in primary infection increases progressively past the 12 hr time-point, reaches peak on day 4 post-infection, and declines afterwards. M and L amplicons follow identical patterns of time-dependent changes after RSV infection (data not shown). Similarly to the genome/antigenome changes, expression of RSV genes between primary and secondary infection is very similar at 12 hrs post-infection for each particular gene analyzed. Overall, RSV re-infection of animals infected 21 days earlier results in increasing expression of viral transcripts and genome replication, but does not lead to production of detectable progeny virus. This type of replication, therefore, can be termed “abortive”, as RSV is capable of entering the cells in the lungs of immune animals, yet production of progeny viruses is impaired. This is in contrast to the primary RSV infection, where accumulation of both viral genetic material and progeny viruses is detected in the lungs.
Time Considerations
Viral titrations by qRT-PCR and by plaque assay take approximately one week each, from the time of lung sample processing to the time of reading final results. Animal experiments are the most time-consuming part of the described protocols. A period of 21 days is needed between the primary and secondary RSV challenge, and additional two weeks are needed for collection of samples after the final RSV inoculation.
Literature Cited
- Bermingham A, Collins PL. The M2-2 protein of human respiratory syncytial virus is a regulatory factor involved in the balance between RNA replication and transcription. Proc Natl Acad Sci U S A. 1999;96(20):11259–64. doi: 10.1073/pnas.96.20.11259. [DOI] [PMC free article] [PubMed] [Google Scholar]
- Boukhvalova MS, Yim KC, et al. Age-related differences in pulmonary cytokine response to respiratory syncytial virus infection: modulation by anti-inflammatory and antiviral treatment. J Infect Dis. 2007;195(4):511–8. doi: 10.1086/510628. [DOI] [PubMed] [Google Scholar]
- Bustin SA, Mueller R. Real-time reverse transcription PCR (qRT-PCR) and its potential use in clinical diagnosis. Clin Sci (Lond) 2005;109(4):365–79. doi: 10.1042/CS20050086. [DOI] [PubMed] [Google Scholar]
- Byrd LG, Prince GA. Animal models of respiratory syncytial virus infection. Clin Infect Dis. 1997;25(6):1363–8. doi: 10.1086/516152. [DOI] [PubMed] [Google Scholar]
- Collins PL, Wertz GW. cDNA cloning and transcriptional mapping of nine polyadenylylated RNAs encoded by the genome of human respiratory syncytial virus. Proc Natl Acad Sci U S A. 1983;80(11):3208–12. doi: 10.1073/pnas.80.11.3208. [DOI] [PMC free article] [PubMed] [Google Scholar]
- Curtis SJ, Ottolini MG, et al. Age-dependent replication of respiratory syncytial virus in the cotton rat. Exp Biol Med (Maywood) 2002;227(9):799–802. doi: 10.1177/153537020222700912. [DOI] [PubMed] [Google Scholar]
- Falsey AR, Formica MA, et al. Comparison of quantitative reverse transcription-PCR to viral culture for assessment of respiratory syncytial virus shedding. J Clin Microbiol. 2003;41(9):4160–5. doi: 10.1128/JCM.41.9.4160-4165.2003. [DOI] [PMC free article] [PubMed] [Google Scholar]
- Falsey AR, Formica MA, et al. Diagnosis of respiratory syncytial virus infection: comparison of reverse transcription-PCR to viral culture and serology in adults with respiratory illness. J Clin Microbiol. 2002;40(3):817–20. doi: 10.1128/JCM.40.3.817-820.2002. [DOI] [PMC free article] [PubMed] [Google Scholar]
- Glezen WP, Taber LH, et al. Risk of primary infection and reinfection with respiratory syncytial virus. Am J Dis Child. 1986;140(6):543–6. doi: 10.1001/archpedi.1986.02140200053026. [DOI] [PubMed] [Google Scholar]
- Hu A, Colella M, et al. Simultaneous detection, subgrouping, and quantitation of respiratory syncytial virus A and B by real-time PCR. J Clin Microbiol. 2003;41(1):149–54. doi: 10.1128/JCM.41.1.149-154.2003. [DOI] [PMC free article] [PubMed] [Google Scholar]
- Huang YT, Wertz GW. The genome of respiratory syncytial virus is a negative-stranded RNA that codes for at least seven mRNA species. J Virol. 1982;43(1):150–7. doi: 10.1128/jvi.43.1.150-157.1982. [DOI] [PMC free article] [PubMed] [Google Scholar]
- Johnson S, Oliver C, et al. Development of a humanized monoclonal antibody (MEDI-493) with potent in vitro and in vivo activity against respiratory syncytial virus. J Infect Dis. 1997;176(5):1215–24. doi: 10.1086/514115. [DOI] [PubMed] [Google Scholar]
- Kolakofsky D, Bruschi A. Antigenomes in Sendai virions and Sendai virus-infected cells. Virology. 1975;66(1):185–91. doi: 10.1016/0042-6822(75)90189-0. [DOI] [PubMed] [Google Scholar]
- Kolakofsky D, Spahr PF, et al. Comparison of 6–94 virus and Sendai virus RNA by RNA-RNA hybridization. J Virol. 1974;13(4):935–6. doi: 10.1128/jvi.13.4.935-936.1974. [DOI] [PMC free article] [PubMed] [Google Scholar]
- Mackay IM, Jacob KC, et al. Molecular assays for detection of human metapneumovirus. J Clin Microbiol. 2003;41(1):100–5. doi: 10.1128/JCM.41.1.100-105.2003. [DOI] [PMC free article] [PubMed] [Google Scholar]
- Maggon K, Barik S. New drugs and treatment for respiratory syncytial virus. Rev Med Virol. 2004;14(3):149–68. doi: 10.1002/rmv.423. [DOI] [PubMed] [Google Scholar]
- Niewiesk S, Prince G. Diversifying animal models: the use of hispid cotton rats (Sigmodon hispidus) in infectious diseases. Lab Anim. 2002;36(4):357–72. doi: 10.1258/002367702320389026. [DOI] [PubMed] [Google Scholar]
- Openshaw PJ, Tregoning JS. Immune responses and disease enhancement during respiratory syncytial virus infection. Clin Microbiol Rev. 2005;18(3):541–55. doi: 10.1128/CMR.18.3.541-555.2005. [DOI] [PMC free article] [PubMed] [Google Scholar]
- Perkins SM, Webb DL, et al. Comparison of a real-time reverse transcriptase PCR assay and a culture technique for quantitative assessment of viral load in children naturally infected with respiratory syncytial virus. J Clin Microbiol. 2005;43(5):2356–62. doi: 10.1128/JCM.43.5.2356-2362.2005. [DOI] [PMC free article] [PubMed] [Google Scholar]
- Prince GA, Jenson AB, et al. Enhancement of respiratory syncytial virus pulmonary pathology in cotton rats by prior intramuscular inoculation of formalin-inactivated virus. J Virol. 1986;57(3):721–8. doi: 10.1128/jvi.57.3.721-728.1986. [DOI] [PMC free article] [PubMed] [Google Scholar]
- Prince GA, Jenson AB, et al. The pathogenesis of respiratory syncytial virus infection in cotton rats. Am J Pathol. 1978;93(3):771–91. [PMC free article] [PubMed] [Google Scholar]
- Prince GA, Prieels JP, et al. Pulmonary lesions in primary respiratory syncytial virus infection, reinfection, and vaccine-enhanced disease in the cotton rat (Sigmodon hispidus) Lab Invest. 1999;79(11):1385–92. [PubMed] [Google Scholar]
- Robinson WS. Self-annealing of subgroup 2 myxovirus RNAs. Nature. 1970;225(5236):944–5. doi: 10.1038/225944a0. [DOI] [PubMed] [Google Scholar]
- Schauer U, Hoffjan S, et al. RSV bronchiolitis and risk of wheeze and allergic sensitisation in the first year of life. Eur Respir J. 2002;20(5):1277–83. doi: 10.1183/09031936.02.00019902. [DOI] [PubMed] [Google Scholar]
- Shay DK, Holman RC, et al. Bronchiolitis-associated mortality and estimates of respiratory syncytial virus-associated deaths among US children, 1979–1997. J Infect Dis. 2001;183:16–22. doi: 10.1086/317655. [DOI] [PubMed] [Google Scholar]
- Siber GR, Leombruno D, et al. Comparison of antibody concentrations and protective activity of respiratory syncytial virus immune globulin and conventional immune globulin. J Infect Dis. 1994;169(6):1368–73. doi: 10.1093/infdis/169.6.1368. [DOI] [PubMed] [Google Scholar]
- Sigurs N, Bjarnason R, et al. Respiratory syncytial virus bronchiolitis in infancy is an important risk factor for asthma and allergy at age 7. Am J Respir Crit Care Med. 2000;161(5):1501–7. doi: 10.1164/ajrccm.161.5.9906076. [DOI] [PubMed] [Google Scholar]
- Stein RT, Sherrill D, et al. Respiratory syncytial virus in early life and risk of wheeze and allergy by age 13 years. Lancet. 1999;354(9178):541–5. doi: 10.1016/S0140-6736(98)10321-5. [DOI] [PubMed] [Google Scholar]
- Thompson WW, Shay DK, et al. Mortality associated with influenza and respiratory syncytial virus in the United States. Jama. 2003;289(2):179–86. doi: 10.1001/jama.289.2.179. [DOI] [PubMed] [Google Scholar]
- van Kraaij MG, van Elden LJ, et al. Frequent detection of respiratory viruses in adult recipients of stem cell transplants with the use of real-time polymerase chain reaction, compared with viral culture. Clin Infect Dis. 2005;40(5):662–9. doi: 10.1086/427801. [DOI] [PMC free article] [PubMed] [Google Scholar]