Abstract
Multiparous ewes received 100% (control, C, n=13) or 50% (nutrient restricted, NR, n=14) of NRC dietary requirements from d28-d78 of gestation. On d78, 5 C and 6 NR ewes were necropsied. The remaining 8 C and 8 NR ewes were fed to 100% of NRC from d78-d135 and necropsied. Maternal blood was collected at both necropsies and at weekly intervals for assay of glucose, insulin and leptin. Fetal blood was collected at d78 and d135 necropsies for assay of glucose and lipids. Cotyledonary (COT) tissue was evaluated for protein and mRNA expression [fatty acid transporter (FATP)1, FATP4, CD36, glucose transporter (GLUT)1 and GLUT3], mRNA expression only [placenta fatty acid binding protein (FABPpm) and lipoprotein lipase (LPL)], or expression of phosphorylated and total protein forms [AMP kinase (AMPK)α, acetyl-CoA carboxylase (ACC), extracellular signal-regulated kinase (Erk)1/2, mammalian target of rapamycin (mTOR) and protein kinase B (Akt)]. On d78, but not d135, placental and fetal weights were reduced (P < 0.05) in NR vs. C ewes. Maternal circulating glucose, insulin and leptin levels were decreased in NR vs. C ewes on d78 (P < 0.05) but similar at d135. Fetal blood glucose and triglyceride levels were lower in NR vs. C ewes (P < 0.05) on d78, but similar on d135. On d78, GLUT1, FATP4, CD36 mRNA and protein expression levels, FABPpm mRNA level, and leptin protein level were all increased (P < 0.05) in COT of NR vs. C ewes. AMPK, ACC, and Erk1/2 activities were also increased (P < 0.05) in NR vs. C COT on d78. In contrast, only FATP4 was increased (P < 0.05) at both the mRNA and protein levels in COT of NR realimented vs. C ewes on d135. These data demonstrate placental adaptation to maternal NR through increasing nutrient transporter production and growth signaling activity.
Keywords: FATP, GLUT, growth signaling, maternal nutrient restriction, sheep
Introduction
Maternal nutrient restriction (NR) during pregnancy results in fetal intrauterine growth restriction (IUGR), and low birth weight [1, 2]. Maternal NR is also associated with disproportionately enlarged placentae, a phenotype linked to an increased risk of offspring developing adult hypertension [1]. Moreover, maternal NR during the first half of gestation has been shown to increase perinatal mortality and the prevalence of metabolic disorders, such as obesity and insulin resistance, in the offspring of several mammalian species including the humans, rats and the sheep [3-6].
We have previously reported that maternal NR from day 28 to day 78 of gestation in the sheep resulted in fetal IUGR at mid-gestation [2], in association with a significantly increased cotyledonary angiogenesis and storage of long chain polyunsaturated fatty acids (LC-PUFAs) in fetal liver, lung and muscle [7], suggesting altered placental nutrient transport in NR ewes. Further, when the NR ewes were realimented to a control diet during the second half of gestation, their male offspring exhibited remarkably greater adiposity and weight gain during postnatal life [6].
The human placenta is of a hemochorial discoid type, with cotyledonary villi directly bathed in maternal blood [8]. In the sheep, 75 to 120 placentomes distributed over the endometrial surface of the uterus constitute the sites of maternal:fetal exchange [9]. Each placentome is composed of a maternal caruncular, and a placental cotyledonary component. The cotyledonary placenta of both the human and the sheep expresses a variety of nutrient transporters to facilitate nutrient delivery to the fetus [10-13]. Although the specific localization of glucose transporter (GLUT)1 and 3 in the sheep and human cotyledonary placenta differs, both GLUT1 and 3 are expressed at all stages of pregnancy in both species [10, 11]. Free and lipoprotein-bound triglycerides in the maternal circulation are hydrolyzed by lipoprotein lipase (LPL) to release long chain fatty acids (LCFAs), and allow fatty acids transporter (FATP)1 and FATP4 to transport them across the placental membranes [12, 13]. In addition, fatty acid translocase (FAT)/CD36 and FABPpm, a placenta specific fatty acids binding protein, facilitate extracellular binding and intracellular transport of LCFAs, respectively [13, 14].
GLUT1-mediated glucose transport is upregulated by AMP-activated protein kinase (AMPK) [15], the activity of which is regulated by nutrient availability (e.g. circulating glucose levels), and circulating hormones such as insulin and leptin [16-18]. AMPK in turn regulates the acetyl-CoA carboxylase (ACC) pathway, which controls fatty acid metabolism [19, 20]. In both humans and the sheep, the increase of cotyledonary vasculature is critical for the rapid fetal growth during the second half of gestation [21]. Mammalian target of rapamycin (mTOR), protein kinase B (Akt) and extracellular signal-regulated kinase (Erk)1/2 signaling pathways are all important for promoting cell survival, cell growth and proliferation [22, 23]. The Erk1/2 pathway is reported to be upregulated at mid-gestation in response to maternal NR in the cow to promote the growth of the placenta and placental vasculature [24]. The current study investigated placental regulation of nutrient transporters and growth signaling in relation to placental transport capacity utilizing the pregnant NR ewe model in order to understand the changes in mechanisms responsible for placental transport function in response to maternal nutrient restriction.
Materials and Methods
Animal care
This study was conducted at the University of Wyoming, and all procedures were approved by the University of Wyoming Animal Care and Use Committee. Multiparous Rambouillet/Columbia cross ewes of similar weight and body condition score (BCS), an index of fatness, were studied [25]. On day 20 of pregnancy, each ewe was weighed so that each individual diet could be calculated based on metabolic body weight (BW0.75).
From day 21 of gestation, all ewes were placed in individual pens and fed with a highly palatable diet at 100% of National Research Council (NRC) recommendations [26]. On day 28, ewes were randomly assigned to a control group (C, fed at 100% of NRC recommendations, n = 13), or a nutrient restricted group (NR, fed at 50% of NRC recommendations, n = 14) as previously reported [2]. Beginning on day 28 of gestation, ewes were weighed weekly and diets adjusted for weight gain as previously described [6]. The number of fetuses carried by each ewe was determined by ultrasonography (Asonics Microimager 1000 sector scanning instrument, Ausonics Pty Ltd, Sydney, Australia) at day 45 of gestation. Ewes carrying singleton and twin fetuses were utilized in this study. On day 78 of gestation 5 C (2 singleton and 3 twin pregnancies) and 6 NR ewes (2 singleton and 3 twin pregnancies) were necropsied. All 8 fetuses from each dietary group were recovered and utilized in the study. From day 79 of gestation, 8 C ewes continued to receive the control ration, and the remaining 8 NR ewes were re-alimented to the control ration (NR-RE, 100% of NRC recommendations) until day 104 of gestation. From day 105 of gestation until necropsy on day 135 of gestation, diets fed to all of the pregnant ewes were increased according to the NRC guidelines for late pregnant ewes [26]. On day 135 of gestation, 12 fetuses (4 singleton and 4 twin pregnancies) from the 8 C and 13 fetuses (3 singleton and 5 twin pregnancies) from 8 NR-RE ewes were recovered and utilized in the study.
Maternal weights throughout pregnancy for C and NR ewes on this study have been previously reported [6]. On day 28 of gestation, body weight (BW) did not differ between C and NR ewes, but by 78 of gestation C ewes gained ∼6.9% of BW, while NR ewes lost ∼10.5% of BW. After diet realimentation from day 78, weight gain was similar between C and NR-RE ewes, but the NR-RE ewes remained lighter than C ewes by day 135 of gestation.
Maternal blood samples were collected by jugular venipuncture from both dietary groups at weekly intervals between day 78 and 135 of gestation into chilled, non-heparinized vacutainer tubes (Sigma, St. Louis, MO) and serum stored at -80°C until subsequent insulin analysis. Another set of blood samples were collected into chilled, heparinized vacutainer tubes containing 2.5 mg/mL of sodium fluoride (Sigma, St. Louis, MO). After collection, the heparin plus sodium fluoride tubes were centrifuged at 3,000 × g for 10 min and plasma was collected and stored at -80°C for subsequent glucose and leptin analysis.
Necropsy
Immediately before necropsy on either day 78 or day 135 of gestation ewes were weighed, and for each ewe a serum and plasma sample were collected and stored as described above. Ewes were then sedated with Ketamine (22.2 mg/kg body weight) and anesthetized via isofluorane inhalation (2-3 %). Immediately following laparotomy, umbilical vein serum and plasma were collected and stored as described for maternal blood. Ewes were euthanized by exsanguination while still under general anesthesia, and the gravid uterus quickly recovered. Fetal body weights, crown rump lengths (CRL), and selected organ weights were then recorded. For each placenta (day 78 and day 135), COT tissues were manually separated from caruncular tissue from two Type A placentomes [27] of similar weight and size within 15 cm of the umbilical cord attachment site and COT tissue snap frozen in liquid nitrogen. COT tissues were stored at -80°C until utilized for realtime-PCR and Westernblot. All remaining placentomes on day 78 (all were type A) were then dissected from each uterus, counted and the total placentome weight per placenta was determined. For the day 135 necropsy, type A, B, C and D placentomes [27] were separately counted and weighed.
Fetal plasma lipid assay
Umbilical vein plasma collected from day 78 and day 135 necropsies were utilized for triglyceride and lipoprotein assay. A Boehringer Mannhiem/Hitachi 912 analyzer was used to analyze plasma cholesterol, high density lipoprotein (HDL), low density lipoprotein (LDL), very low density lipoproteins (VLDL) and triglyceride (Roch Diagnostics, Indianapolis, IN) content as previously described [28]. The lipid analyses were conducted by Veterinary Diagnostic and Investigational Laboratory, College of Veterinary Medicine, University of Georgia.
Glucose, insulin and leptin analysis
Umbilical vein plasma collected from day 78 and day 135 necropsies were utilized for glucose assay. Maternal blood samples collected weekly between day 78 and day 135 of gestation were utilized for glucose, insulin and leptin assays. Glucose was measured in triplicate by photoabsorbance following the addition of glucose hexokinase reagent (Liquid Glucose Hexokinase Reagent Set, Pointe Scientific, Inc., Canton MI) using 96-well plates as previously described [6]. Mean intraassay coefficient of variation (CV) was 1.5% and interassay CV was 4.0%. Insulin was measured in duplicate by commercial radioimmunoassay kit (Siemens Healthcare Diagnostics, Deerfield, IL). Intra- and interassay CV for insulin was 7.6% and 14.9%, respectively. Serum leptin was measured by commercial radioimmunoassay kit (Multi-species Leptin RIA, Millipore Corporation, Billerica, MA) in duplicate within a single assay. Intra-assay CV was 2.5%. Leptin and insulin assays were previously validated for use in sheep [6].
Westernblot and antibodies
Total protein extraction and Westernblot were accomplished as previously described [29]. Protein concentration was determined via the Bradford method (Bio-Rad, Bio-Rad Laboratories Inc., Hercules, CA), and ∼30 μg of protein from each protein extracts was loaded for SDS-PAGE. COT tissue of type A placentomes from both day 78 and day 135 gestation C and NR ewes were measured for FATP1, FATP4, CD36, GLUT1, GLUT3, leptin, phosphorylated and total forms of AMPKα, ACC, Akt, mTOR and p44/42 MAPK (or Erk1/2) via Westernblot. Primary leptin antibody was purchased from Abcam Inc. (Cat# ab16227, Cambridge, MA). Primary antibodies against FATP1 (Cat# sc-25541), FATP4 (Cat# sc-25670), CD36 (Cat# sc-9154), GLUT1 (Cat# sc-7903), GLUT3 (Cat# sc-31838), and secondary anti-goat antibody (Cat# sc-2020) were purchased from Santa Cruz Biotechnology, Inc. (Santa Cruz, CA). Primary antibodies against phospho-AMPKα (Thr172, Cat# 2535), phospho-ACC (Ser79, Cat# 3661, phospho-Akt (Ser473, Cat# 9271), phospho-Erk1/2 (Thr202/Tyr204, Cat# 9101), total-AMPKα (Cat# 2532), total-ACC (Cat# 3662), total-Akt (Cat# 9772), total-Erk1/2 (Cat# 9102), and secondary anti-rabbit (Cat# 7074) and anti-mouse (Cat# 7076) antibodies were purchased from Cell Signaling Technology, Inc. (Boston, MA). All primary antibodies were used at 1:500 (v/v) dilution in either 5% (w/v) fetal bovine serum (FBS) or 5% (w/v) skim milk [dissolved in Tris (2mM) buffered saline (13.7mM) with 0.05% Tween20 (0.05%TBST20)]. All secondary antibodies were used at 1:2000 (v/v) dilution in 2% (w/v) skim milk. Primary antibody was tested prior to use using the recommended positive control and a negative control to ensure binding specificity. Secondary antibodies were also tested by directly blocking with sheep protein extracts to ensure no non-specific reaction to sheep protein extracts. Westernblot result evaluation was conducted as previously described [29]. The density of target bands was quantified and normalized with β-tubulin (Cat# T-4026, Sigma-Aldrich, Inc., St. Louis, MO).
Realtime-PCR and primers
Total RNA extraction was accomplished as previously described from COT tissues of type A placentomes of both day 78 C and NR and day 135 C and NR-RE ewes [29]. One μg of purified total RNA was used to synthesize single-strand DNA using the Bio-Rad iScript cDNA Synthesis Kit (Bio-Rad Laboratories Inc., Hercules, CA) according to manufacture's protocol. Messenger RNA levels of FATP1, FATP4, CD36, FABPpm, LPL, GLUT1 and GLUT3 were measured via realtime-PCR in COT of day 78 C and NR ewes and day 135 C and NR-RE ewes. All realtime-PCR reactions were conducted using a Bio-Rad IQ5 Realtime-PCR Reaction System (Bio-Rad Laboratories Inc., Hercules, CA). A temperature gradient PCR reaction was run before realtime-PCR to determine the optimal annealing temperature for all primer sets. According to gradient PCR, the optimal annealing temperature of all primer sets overlapped at 58°C. Reactions for each gene were run in duplicate. β-tubulin was used as reference gene in realtime-PCR reactions. Realtime-PCR reaction steps and statistical analysis were described previously [29]. Briefly, a 20 μl mix of 10 ul SYBR green (Bio-Rad), 10 pmol forward and reverse primer, and 100 ng cDNA was used for realtime-PCR reaction. The following program was applied to all real-time PCR reactions: I) 1 cycle at 95°C for 3 min; II) 40 repeat cycles at 95°C for 10 sec, following by annealing at 58°C for 30 sec; III) 55.0 °C-95.0°C with melting temperature increasing 0.5°C for each 30 sec. Fluorescence was detected at both step II and III.
All primers were designed using a free online software Primer 3. All primers were synthesized by Invitrogen (Carlsbad, CA), and their sequences are listed in Table 1.
Table 1.
Primers used for realtime-PCR quantifications.
| Gene Name | Product Size | Direction | Primer Sequence |
|---|---|---|---|
| FATP1 | 102bp | Forward | ACTGTCTGCCCCTGTACCAC |
| Reverse | GGCTGGCTGAAAACTTCTTG | ||
| FATP4 | 88bp | Forward | GGCACCAACGACAAGAAGAT |
| Reverse | GCTCGTCCATCACTAGCACA | ||
| CD36 | 76bp | Forward | GGTGATTTGACCCAGCACTT |
| Reverse | AATGCTGGTTGGAGGACAAC | ||
| FABPpm | 100bp | Forward | ACAAACCCTGTCAGTCACACCA |
| Reverse | GTGCTGTTTTCAGGCTGGTTCT | ||
| LPL | 129bp | Forward | TGTGCCGCCTTGGGTTCAGC |
| Reverse | GCACACGCTCAGAGCCAGCA | ||
| GLUT1 | 149bp | Forward | AACTGTGCGGACCCTATGTC |
| Reverse | GTCACTTTGGCTTGCTCCTC | ||
| GLUT3 | 160bp | Forward | TGTGGTGTCTGTGTTCTTGG |
| Reverse | TTTCAAAGAAGGCCACAAAG | ||
| β-tubulin | 141bp | Forward | CGAGAGCTGTGACTGTCTGC |
| Reverse | GGCATGACGCTAAAGGTGTT |
Statistical analysis
Data were analyzed using a complete randomized design using GLM (General Linear Model of Statistical Analysis System; SAS 9.1, 2002-2003, SAS Institute Inc., Cary, NC). Mean separation was performed using LSMEANS. Fetal type and sex were included in the original model and were found to be non-significant (P >0.50) and were therefore removed in the final model, which only contained maternal nutritional treatment. Data are presented throughout as means ± SEM and considered significantly different when P < 0.05, while P values between 0.05 and 0.10 were considered trends.
Results
As shown in Table 2, on day 78 of gestation, both fetal weights and CRL were significantly lower in NR than C ewes (P < 0.05), indicating maternal NR induced fetal IUGR. However, after realimentation to the control diet, fetuses of NR-RE exhibited catch up growth and reached similar weights and CRL to those of C fetuses on day 135 of gestation (Table 2). Brain weight of day 78 NR fetuses was less (P < 0.05) than that of C fetuses, and the brain/fetal weight ratio was greater in fetuses of NR versus C ewes (P < 0.05), demonstrating that the growth restriction was asymmetric. In contrast, neither the fetal brain weight nor the brain/fetal weight ratio showed any difference between C and NR-RE ewes on day 135 of gestation (Table 2). Total placentomal weight of NR ewes was lower than that of C ewes on day 78 of gestation (Table 2, P < 0.05), but total placentomal weights were similar on day 135. This resulted from the fact that during the second half of gestation, total placentome weight decreased ∼27% in C ewes, while staying relatively constant in NR-RE ewes (Table 2). Neither placentome number nor average placentome weight differed between the two dietary groups at either mid- or late gestation (Table 2). Day 135 NR-RE ewes had greater numbers (P < 0.05) of type D placentomes than C ewes, with a 4-fold greater total type D placentome weight (P < 0.05). In contrast, C ewes had a larger number (P < 0.05) of type A placentomes, with a 2-fold higher total type A placentome weight (Table 3, P < 0.05). In addition, on day 135 of gestation, the average weight of type B, C and D placentomes were greater than that of type A placentomes, in both C and NR-RE ewes (Table 3, P < 0.05). The fetal/placentomal weight ratio, a rough measurement of placental efficiency [30], was not different between C and NR ewes at mid- or late gestation, but increased markedly during the second half of gestation in both C and NR-RE ewes (Table 2).
Table 2.
Fetal and placentomal measurements on day 78 and day 135 of gestation in fetuses from control (C), nutrient restricted (NR), and nutrient restricted re-alimented (NR-RE) ewes.
| Gestation length | day 78 | day 135 | ||
|---|---|---|---|---|
| Dietary group | C (n = 8) | NR (n = 8) | C (n = 12) | NR-RE (n = 13) |
| Fetal Wt. (g) | 278.90 ± 11.89 b | 207.11 ± 8.21 a | 4901.22 ± 188.74 c | 4896.18 ± 159.92 c |
| CRL (cm) | 23.75 ± 0.54 b | 21.56 ± 0.61 a | 55.96 ± 0.78 c | 55.42 ± 0.71 c |
| Brain Wt. (g) | 7.15 ± 0.03 b | 6.48 ± 0.03 a | 42.18 ± 1.24 c | 45.34 ± 2.58 c |
| Brain/Fetal Wt. Ratio | 0.027 ± 0.000 b | 0.031 ± 0.000 c | 0.0088 ± 0.0002 a | 0.0093 ± 0.0004 a |
| Total Placentome Wt. (g) | 701.35 ± 51.12 b | 553.42 ± 40.06 a | 509.63 ± 41.80 a | 503.61 ± 39.98 a |
| Total Placentome Number | 57 ± 5.83 a | 49.00 ± 5.97 a | 52.00 ± 4.03 a | 53.23 ± 4.50 a |
| Ave. Placentome Wt. (g) | 13.34 ± 1.62 a | 12.20 ± 1.33 a | 10.01 ± 0.71 a | 9.94 ± 0.99 a |
| Fetal/Placentome Wt. Ratio | 0.41 ± 0.03 a | 0.39 ± 0.03 a | 10.09 ± 0.57 b | 10.44 ± 0.98 b |
Means ± SEM within a measurement with different superscripts differ (P < 0.05).
Table 3.
Comparisons of average placentome weight (g), total plascentome weight (g), and placentome number among type A, B, C and D placentomes from fetuses of day 135 C (n = 12) and NR realimented ewes (NR-RE presented in the table, n = 13).
| Measurements | Dietary group | Type of placentomes | |||
|---|---|---|---|---|---|
| A | B | C | D | ||
| Average Placentome Wt. (g) | C | 7.32 ± 0.61 a | 10.01 ± 0.98 b | 15.24 ± 1.90 c | 16.20 ± 2.02 c |
| NR-RE | 6.93 ± 0.70 a | 8.87 ± 0.60 b | 17.01 ± 2.77 c | 21.28 ± 3.45 c | |
| Total Placentome Wt. (g) | C | 253.76 ± 68.10 ab | 175.81 ± 47.31 a | 188.89 ± 37.08 a | 77.18 ± 26.79 a |
| NR-RE | 125.20 ± 31.35 a | 232.19 ± 39.67 ab | 112.76 ± 24.14 a | 313.95 ± 52.42 b | |
| Placentome Number | C | 32.00 ± 8.23 c | 17.80 ± 4.65 b | 13.50 ± 3.69 b | 4.25 ± 2.25 a |
| NR-RE | 18.09 ± 4.14 b | 28.00 ± 5.36 bc | 9.30 ± 2.65 ab | 16.00 ± 4.14 b | |
Means ± SEM within a measurement with different superscripts differ (P < 0.05).
At mid-gestation, NR ewes had significantly lower circulating glucose, insulin and leptin compared to that of C ewes (Figure 1; P < 0.05). Immediately after realimentation to control diet, circulating glucose, insulin and leptin levels were increased in NR-RE ewes and reached levels similar with that of C ewes from day 85 of gestation through late gestation, except on day 92 of gestation, there was a decreased blood glucose and insulin level in NR-RE versus C ewes (P < 0.05). The fetal circulating glucose at both mid- and late gestation was correlated to that in the maternal circulation. At mid-gestation, blood glucose level was ∼24% lower in NR versus C fetuses (P < 0.05), while at late gestation it was not different between NR-RE and C fetuses (Figure 2A). Although fetal circulating triglyceride concentration was higher in C than NR ewes on day 78 of gestation (P < 0.05), it decreased about 16% between day 78 and day 135 of gestation in fetal blood of C ewes (P < 0.05), while increasing about 23% in the NR-RE fetuses over the same period (Figure 2B; P < 0.05). As a result, the fetal circulating triglyceride levels were similar in the two dietary groups at day 135 of gestation (Figure 2B), indicating greater placental transport of triglycerides/LCFAs across the placenta of NR-RE ewes during this period. In addition, Table 4 shows that the levels of fetal blood cholesterol, HDL and VLDL were not changed from day 78 to day 135 of gestation in either of the two dietary groups, nor were there any differences between the two dietary groups on either day 78 or day 135 of gestation. LDL levels and the cholesterol/HDL ratio were not different between either C and NR fetuses at mid-gestation or between C and NR-RE fetuses at late gestation. The cholesterol/HDL ratio decreased significantly in both C and NR groups from mid- to late gestation (P < 0.05), and the LDL level was significantly lower in NR-RE fetuses on day 135 of gestation when compared to C or NR fetuses on day 78 of gestation (P < 0.05).
Figure 1.
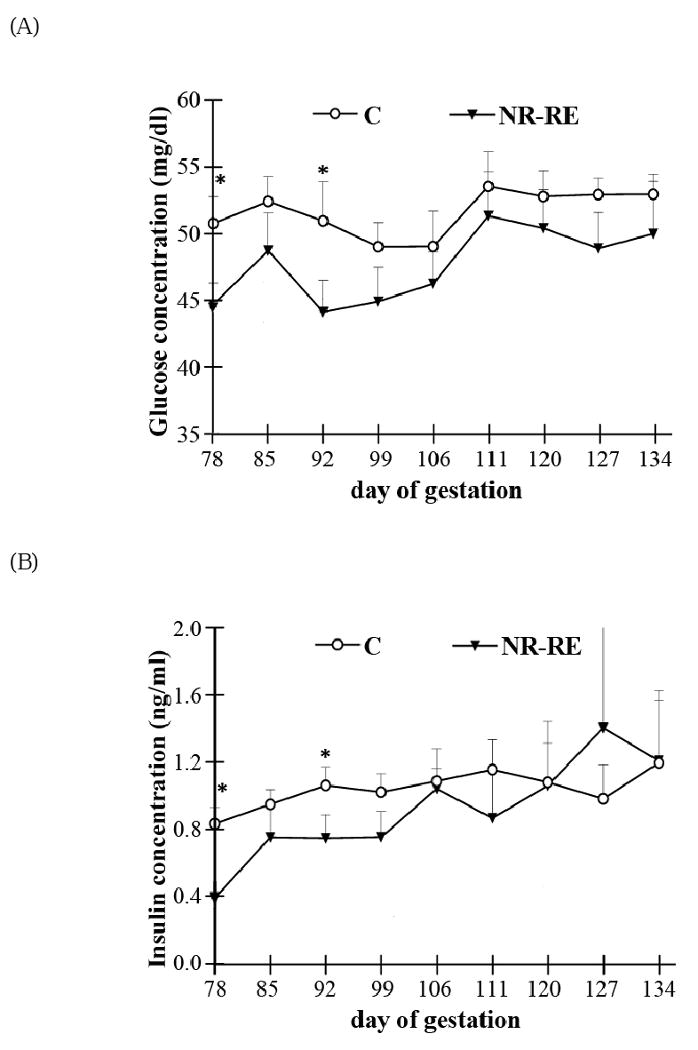
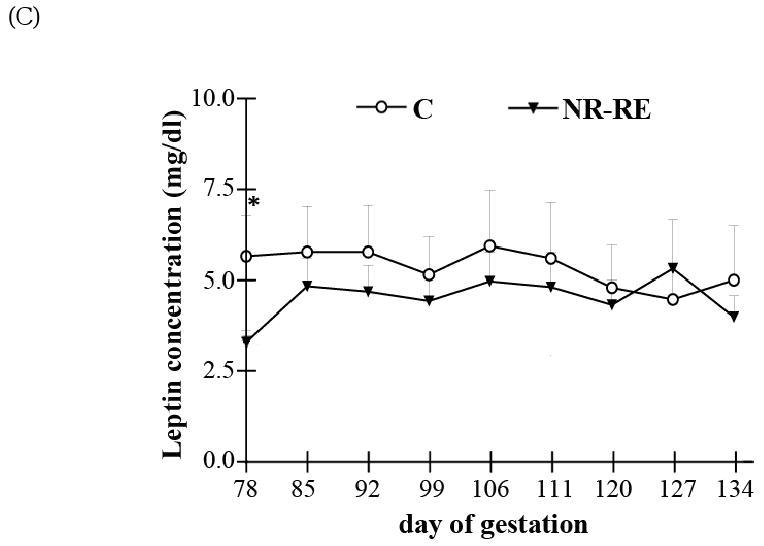
Maternal circulating (A) glucose, (B) insulin, and (C) leptin levels from day 78 to day 134 of gestation in both control (C, n = 10) and nutrient restricted realimented (NR-RE) ewes (n = 9). *Means ± SEM within a gestation date between C and NR-RE group differ (P < 0.05).
Figure 2.
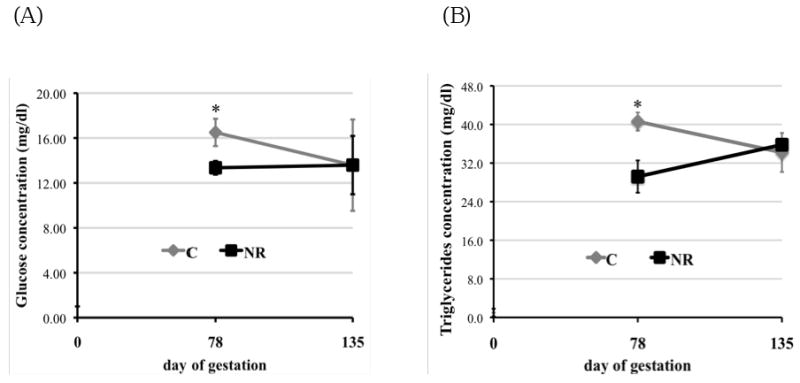
(A) Fetal plasma glucose concentrations on day 78 (n = 8) and day 135 of gestation (C, n = 12; NR-RE, n = 13). (B) Fetal plasma triglycerides on day 78 and day 135 of gestation (according to the data in Table 3, n = 5). *Means ± SEM within a gestation date differ (P < 0.05).
Table 4.
Fetal plasma concentrations of cholesterol, tryiglycerides and different densities of lipoproteins on day 78 and day 135 of gestation.
| Gestation length | day 78 | day 135 | ||
|---|---|---|---|---|
| Dietary group | C (n = 5) | NR (n = 5) | C (n = 5) | NR-RE (n = 5) |
| Cholesterol (mg/dl) | 33.20 ± 1.56 a | 30.00 ± 0.55 a | 32.60 ± 3.08 a | 27.20 ± 3.67 a |
| Triglycerides (mg/dl) | 40.60 ± 1.89 b | 29.20 ± 0.80 a | 34.20 ± 4.04 b | 35.80 ± 3.34 b |
| HDL (mg/dl) | 7.80 ± 0.37 a | 8.40 ± 0.40 a | 12.8 ± 1.16 a | 9.25 ± 1.77 a |
| LDL (mg/dl) | 17.40 ± 1.21 b | 15.40 ± 1.33 b | 13.00 ± 2.92 ab | 9.40 ± 2.01 a |
| VLDL (mg/dl) | 8.14 ± 0.38 a | 7.96 ± 0.48 a | 6.82 ± 0.82 a | 7.18 ± 0.66 a |
| Cholesterol/HDL Ratio | 4.28 ± 0.08 b | 3.60 ± 0.17 b | 2.56 ± 0.14 a | 2.74 ± 0.19 a |
Means ± SEM within a measurement with different superscripts differ (P < 0.05)
Figure 3 shows that mRNA levels of FATP4 (Figure 3A; P < 0.05) and GLUT1 (Figure 3B; P < 0.05) were elevated about 45% and 55%, respectively, in COT tissue of day 78 NR ewes compared to C ewes. Fatty acids translocase (FAT)/CD36 (Figure 3A; P = 0.07) and FABPpm (Figure 3A; P = 0.06) also tended to increase in COT tissue of NR ewes compared to C ewes on day 78 of gestation. However, among all the measured factors that participated in transporting LCFAs and glucose across placenta, only higher mRNA levels of FATP4 persisted in COT of NR-RE ewes compared to C ewes at day 135 of gestation (Figure 1B, P < 0.05). LPL mRNA levels were not different between the two dietary groups at either gestational age. When protein expression was evaluated with Westernblot (Figure 4A) on day 78 of gestation, FATP4 (P = 0.07), CD36 (P = 0.06) and GLUT1 (P < 0.05) were still elevated about 42%, 74% and 52%, respectively, in NR versus C COT, which is consistent with the increase of their mRNA levels. On day 135 of gestation, only protein levels of FATP4 (P = 0.08) and CD36 (P = 0.08) tended to be higher in NR-RE versus C COT (Figure 4B).
Figure 3.
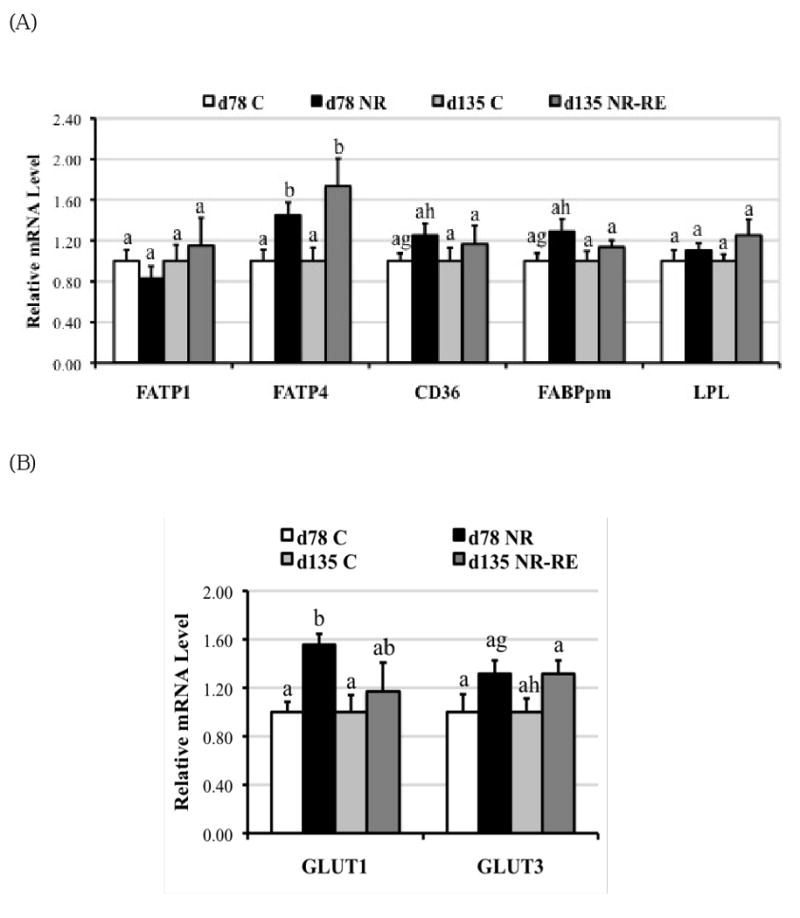
Messenger RNA levels of (A) FATP1, FATP4, CD36, FABPpm, LPL; and (B) GLUT1, GLUT3 in COT tissue of day 78 C and nutrient restricted (NR) ewes (n = 8) and day 135 C and NR-RE ewes (n = 4). ab Means ± SEM with different superscripts differ (P < 0.05). gh Means ± SEM with different superscripts differ (P < 0.10).
Figure 4.
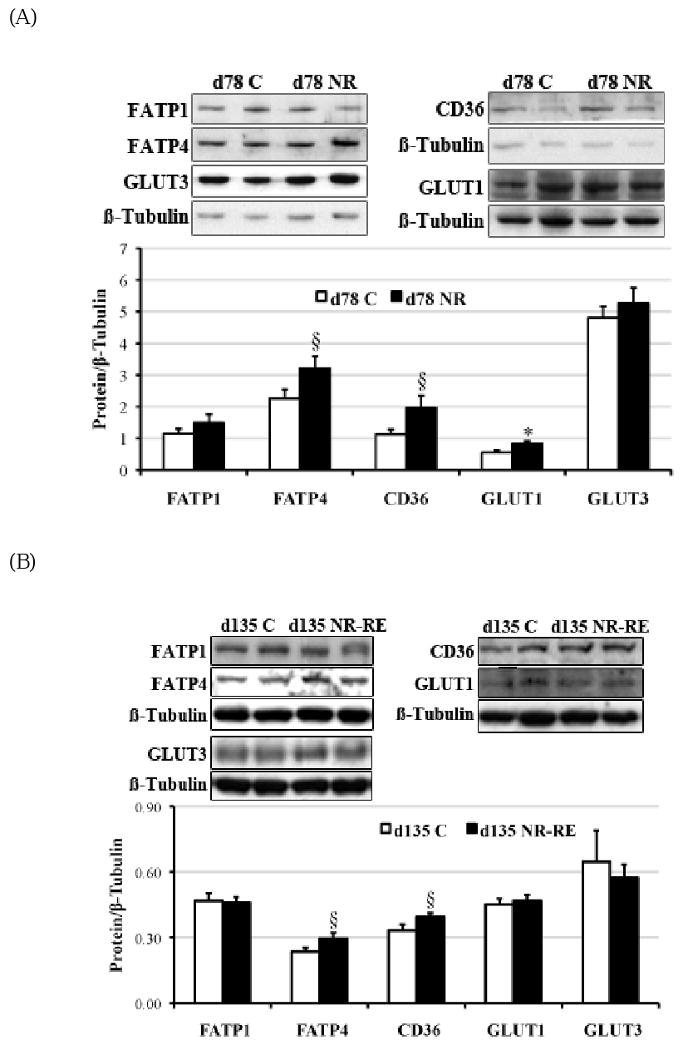
Protein levels of FATP1 (∼70 kDa), FATP4 (∼65 kDa), CD36 (∼90 kDa), GLUT1 (∼55 kDa) and GLUT3 (∼55 kDa) in COT of (A) day 78 C and NR ewes (n = 8), and (B) day 135 C and NR-RE ewes (n = 8). *Means ± SEM differ (P < 0.05). § Means ± SEM tends to differ (P < 0.10).
The phosporylation of AMPKα leads to AMPK activation (41). On day 78 of gestation but not late gestation, phosphorylated AMPKα was elevated (P < 0.05) with a trend towards increase in total AMPKα (P = 0.08) in the COT of NR ewes compared to C ewes (Figure 5A). Consistent with the elevated AMPKα phosphorylation, ACC phosphorylation was strongly enhanced as well at mid-gestation in NR versus C COT (Figure 5B, P < 0.05). However, no difference was observed in AMPK or ACC phosphorylation or protein expression on day 135 of gestation between C and NR-RE COT (Figure 5A, 5B). Either phosyphorylated or total form of mTOR, in contrast, did not show any difference either at mid- or late gestation between COT tissues of the two dietary groups. Both phosphorylated Erk1/2 and the ratio of phosphorylated to total form of Erk1/2 (p/T-Erk) were markedly increased in NR COT at day 78 of gestation, but not at late gestation. Similar to mTOR signaling, the Akt signaling failed to show any difference in either the phosphorylated form or the total form between the two dietary groups from mid- to late gestation.
Figure 5.
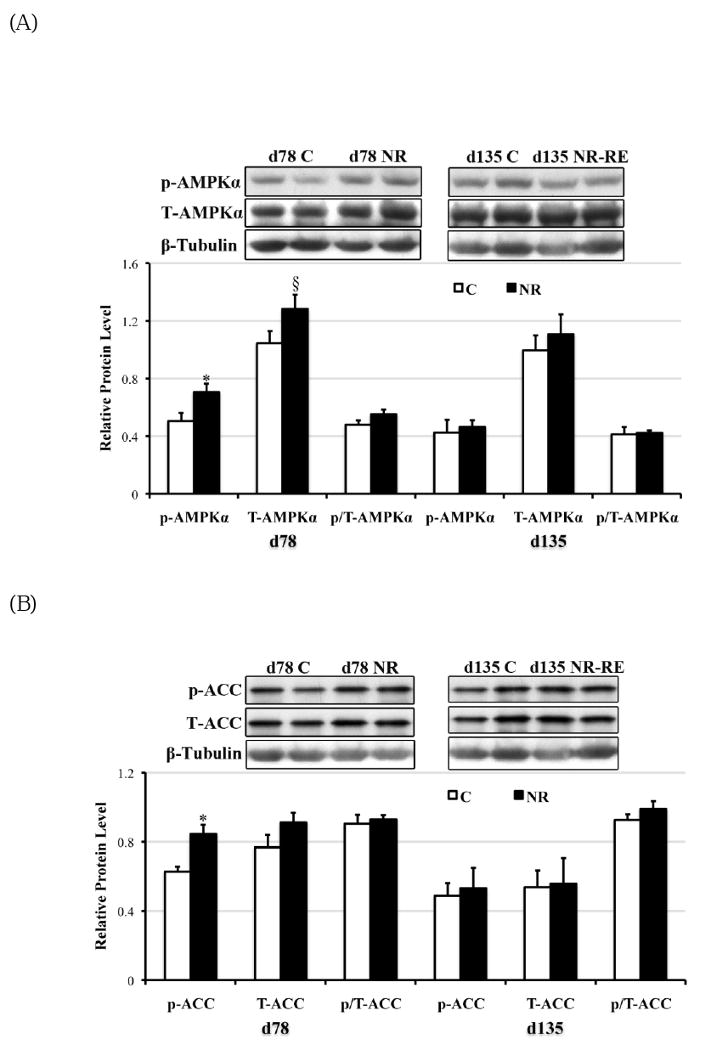
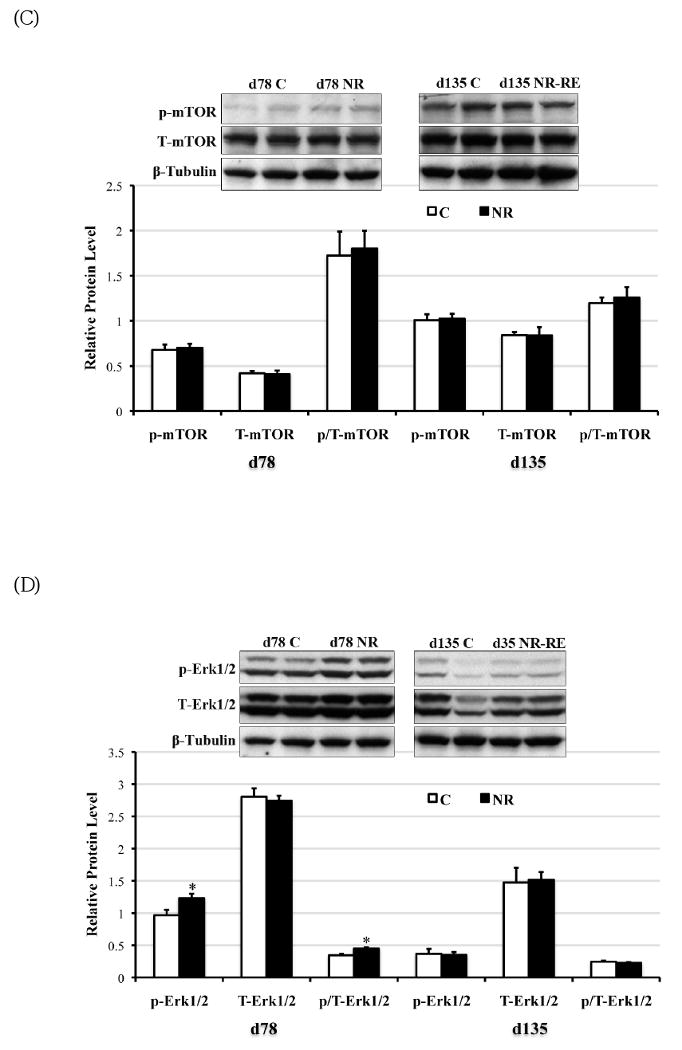
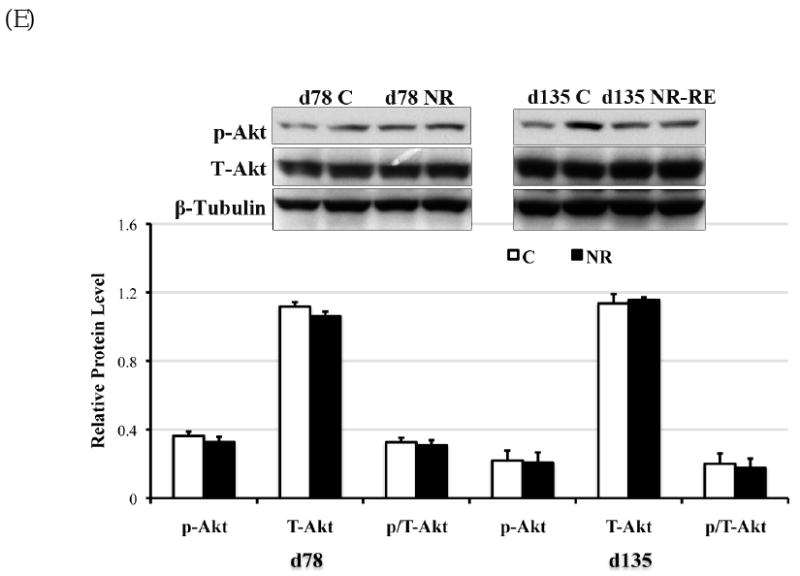
Phosphorylated form (lowercase ‘p’), total form (capitalized ‘T’), and the phosphorylated to total form ratio (p/T) of (A) AMPKα (∼60 kDa); (B) ACC (∼280 kDa); (C) mTOR (∼280 kDa); (D) Erk1/2 (42kDa and 44kDa); and (D) Akt (∼60 kDa) in COT tissues of day 78 C and NR ewes (n = 8) and day 135 C and NR-RE ewes (n = 4). *Means ± SEM differ (P < 0.05). § Means ± SEM tends to differ (P < 0.10).
Interestingly, leptin protein levels were significantly lower in NR COT compared to C COT at day 78 (P < 0.05) but not day 135 of gestation (Figure 6), which was consistent with decreased maternal circulating leptin level in NR versus C ewes at mid-gestation.
Figure 6.
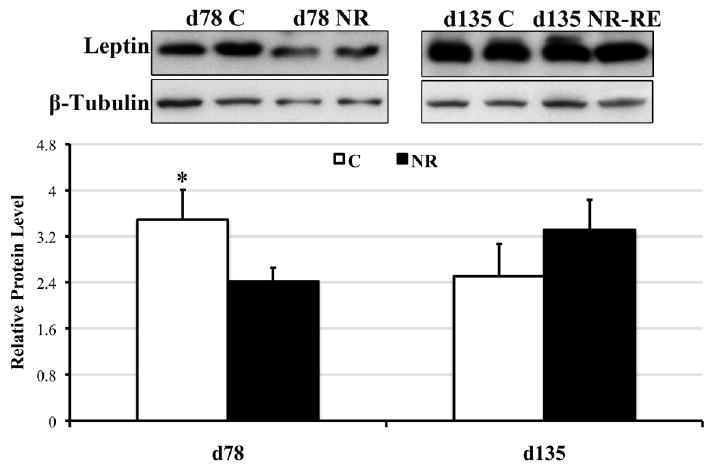
Protein levels of leptin (∼17 kDa) in COT tissues of day 78 C and NR ewes (n = 8) and day 135 C and NR-RE ewes (n = 4). *Means ± SEM differ (P < 0.05).
Discussion
Maternal NR during pregnancy not only restricts fetal growth and development but is also linked to offspring health risks during postnatal and adult life [1]. However, the exact mechanisms connecting maternal gestational undernutrition with specific alterations in fetal development are not clear. To our knowledge, this is the first study conducted to investigate the impact of early to mid-gestational maternal undernutrition on the control of the placental nutrient transporters and growth signaling pathways in the pregnant sheep.
Coan et al. [31] recently reported that the mouse placenta alters its phenotype to maintain normal fetal weight in response to a maternal diet fed at 80% of requirements. To accomplish this, the placentae of NR mothers exhibit reduced weights but increased (P < 0.04) expression of GLUT1 and system A amino acid transporters by 18% and 27% by day 19 of gestation [31]. Similarly, in the current study, the total placentome weight of NR ewes was reduced at mid-gestation, but placental efficiencies (fetal/placentome weight ratio) were maintained at C ewe levels. The ability of NR ewes to maintain placental efficiency at control levels is consistent with the increased COT expression of GLUT1. In addition, FATP4, CD36 and FABPpm were elevated at mid-gestation and FATP4 continued to be expressed at higher levels in NR-RE versus C COT throughout the second half of gestation. These data suggest that the increase of fetal circulating triglyceride levels from mid- to late gestation may result from a greater placental fatty acid transport ability during this period in the NR-RE ewes as compared to that of C ewes.
We have previously reported an elevated expression of COT angiogenic factors and increased capillary numbers (per mm2 of COT tissue) at mid-gestation in the same NR ewe model reported here, a change which would further increase nutrient and oxygen delivery to fetuses of NR ewes [21, 32]. Zhou et al. (2008), again utilizing the same early to mid-gestational NR ewe model as reported here have shown elevated LC-PUFAs, specifically of eicosapentaenoic acid (EPA, 20:5n-3) and docosapentaenoic acid (DPA, 22: 50-3), in the fetal liver, lung and muscle at mid-gestation. Since we know that the fetus derives all of its essential fatty acids from maternal circulating fatty acids crossing the placenta as triglycerides [33], the increased LC-PUFAs in the fetal tissues may result from the enhanced fatty acid transport ability of the NR placenta. Similarly, Bispham et al. [34] reported an increased adipose tissue deposition in the fetus as early as day 140 of gestation in ewes that were undernourished from day 28 to day 80 of gestation. These data suggest that although nutrient realimentation during the second half of gestation can recuperate fetal weight by late gestation, maternal early gestational NR has already altered fetal body composition with the result that NR fetuses are fatter than the fetuses of C mothers. This is further supported by the observation that increased back fat thickness was observed in lambs born from NR-RE ewes versus C ewes at postnatal day 140, and the fact that these NR-RE lambs exhibited a greater percentage of body fat than C lambs at slaughter on postnatal day 280 [6]. This programmed change in body composition may reflect a greater placental transport of LCFAs into the fetal circulation as suggested from the current study.
The regulation of GLUTs in the muscle and adipose tissue has been extensively investigated. In the muscle for example, GLUT4 is translocated from intracellular vesicles to the plasma membrane and facilitates cellular uptake and utilization of circulating glucose following insulin stimulation, which is mediated via Akt signaling [35]. In addition, AMPK is reported to stimulate the expression of both GLUT4 and GLUT1 in the muscle and GLUT1-mediated glucose transport in vitro [15, 36]. However the regulation of placental GLUT1 and GLUT3 expression is largely unknown. In the current study, the increased expression of GLUT1 at mid-gestation is associated with enhanced AMPK activity, but not Akt activity in NR versus C COT. Insulin induced phosphorylation of insulin receptor 1β, as the upstream signal of Akt, was also not changed (Ma Y et al., unpublished observation), although following nutrient restriction maternal insulin was significantly lower at mid-gestation. In a maternal overnutrition study, where a group of ewes were fed with 150% of NRC from day 60 before conception to day 75 of gestation, maternal blood insulin and glucose levels were markedly increased by mid-gestation [37], while the COT arterial insulin receptor 1β phosphorylation was not different from that of control fed ewes (100% of NRC) [24]. These data suggest that in the placenta, GLUT1 expression may be regulated via AMPK signaling rather than insulin signaling. In addition, AMPK signaling regulates fatty acid metabolism mediated by ACC [20]. ACC phosphorylation leads to ACC inactivation, which further decreases fatty acid synthesis, while promoting fatty acids oxidation in order to generate instead of consume ATP [38, 39]. It is known that fatty acid oxidation can generate twice as much energy as glucolysis per gram of substances metabolized [40]. The increased phosphorylation of ACC promoted by AMPK would be expected to promote ATP production in COT tissue of NR ewes at mid-gestation in order to promote survival in the face of nutrient restriction.
AMPK is activated by an increased AMP/ATP ratio under nutritional and environmental stress [20]. AMPK activity is also regulated by insulin via the Akt pathway [41], and by leptin in both peripheral tissues and the hypothalamus [42]. As discussed above, both insulin receptor and Akt activation failed to show any difference between NR and C COT at mid-gestation. Leptin regulation of AMPK in peripheral tissues is opposite to that exhibited in the hypothalamus [18]. In the hypothalamus, inhibition of AMPK activity is necessary for leptin to limit food intake and body weight, while activation of AMPK increases both [42]. Interestingly, in the current study associated with increased AMPK activity in the COT, COT leptin protein level was reduced in NR ewes compared to C ewes at mid-gestation. These data suggest that, in addition to the increased nutrient transportor activity in the COT of NR ewes at mid-gestation, a mechanism similar to the hypothalamic control of food intake and body growth involving leptin and AMPK may exist. Therefore, the sheep placenta appears to adapt to maternal NR by promoting nutrient transport and placentomal growth (to more advanced placentome type) to maintain significant nutrient supply for fetal growth. The leptin regulation of AMPK activity in the placenta of sheep still needs to be determined.
Erk1/2 has mitogenic actions that mediate vascular endothelial growth factor (VEGF) initiated endothelial cell proliferation [43]. Erk1/2 is reported to be down regulated in COT arteries of overnourished ewes [17], while it is upregulated in COT arteries of undernourished cows at mid-gestation [24]. In the case of maternal overnutrition, the down regulation of Erk1/2 is associated with decreased expression of VEGF in the COT arteries [17, 29], and a restricted COT capillary growth. In the current study Erk1/2 activity was upregulated, which is associated with increased expression of VEGF [32], and an increased COT angiogenesis previously demonstrated by mid-gestation in undernourished ewes [2, 32]. These data suggest that Erk1/2 plays an important role in VEGF initiated COT vessel growth. In sheep specifically, this mechanism may contribute to placentome conversion from type A placentomes to more advanced types. The increased placentomal size and vascularity [44] in type B, C, and D placentomes compared to type A placentomes requires tremendous growth and proliferation of trophoblast cells as well as the endothelial cells. The increased angiogenic factor (including VEGF) and mitogenic signal (Erk1/2) would serve this requirement well. Further studies on the Erk1/2 signaling pathway in different types of placentomes shall provide more information on the mechanism of placentomal conversion into more advanced types in the sheep. However, mTOR, as a nutrient sensor that also promote cell growth via regulating protein synthesis, and its upstream signal, the insulin-Akt signaling, were not altered by maternal undernutrition in the current study [19, 45]. This is probably due to the fact that the low maternal nutrient availability failed to increase the activation of mTOR.
In conclusion, the current study investigated the COT profiles of nutrient transporters and growth signaling pathways following maternal NR until mid-gestation and after diet realimentation from mid- to late gestation. Our observations suggest that maternal undernutrition stimulates the placenta of NR ewes to activate several mechanisms that augment placental transport capacity and fetal growth. These mechanisms include upregulation of GLUT1, FATP4, CD36 and FABPpm expression, increased activity of AMPK, ACC, and Erk1/2, and previous reported upregulation of angiogenesis in COT tissues by mid-gestation [32]. The adverse effects of such placental adaptation to maternal NR are the resulting change of fetal body composition at term and the continuation of this phenotype into postnatal life. Compared to the male lambs born from C mothers, those born to NR-RE mothers not only exhibited greater weight gain and adiposity, but also experienced insulin resistance by day 63 of age, and sign of pancreatic failure by day 250 of age [6]. These findings enhance our understanding of placental adaptations and potential consequences resulting from fetal developmental programming of offspring of undernourished mothers.
Acknowledgments
The author would like to thank NIH INBRE to support the current study.
This work was supported by NIH INBRE 1P20RR16474
Footnotes
Publisher's Disclaimer: This is a PDF file of an unedited manuscript that has been accepted for publication. As a service to our customers we are providing this early version of the manuscript. The manuscript will undergo copyediting, typesetting, and review of the resulting proof before it is published in its final citable form. Please note that during the production process errors may be discovered which could affect the content, and all legal disclaimers that apply to the journal pertain.
References
- 1.Barker DJ, Clark PM. Fetal undernutrition and disease in later life. Rev Reprod. 1997;2(2):105–12. doi: 10.1530/ror.0.0020105. [DOI] [PubMed] [Google Scholar]
- 2.Vonnahme KA, Hess BW, Hansen TR, McCormick RJ, Rule DC, Moss GE, Murdoch WJ, Nijland MJ, Skinner DC, Nathanielsz PW, Ford SP. Maternal undernutrition from early- to mid-gestation leads to growth retardation, cardiac ventricular hypertrophy, and increased liver weight in the fetal sheep. Biol Reprod. 2003;69(1):133–40. doi: 10.1095/biolreprod.102.012120. [DOI] [PubMed] [Google Scholar]
- 3.Hales CN. Metabolic consequences of intrauterine growth retardation. Acta Paediatr Suppl. 1997;423:184–7. doi: 10.1111/j.1651-2227.1997.tb18410.x. discussion 8. [DOI] [PubMed] [Google Scholar]
- 4.Gilbert JS, Lang AL, Grant AR, Nijland MJ. Maternal nutrient restriction in sheep: hypertension and decreased nephron number in offspring at 9 months of age. J Physiol. 2005;565(Pt 1):137–47. doi: 10.1113/jphysiol.2005.084202. [DOI] [PMC free article] [PubMed] [Google Scholar]
- 5.Wu G, Bazer FW, Wallace JM, Spencer TE. Board-invited review: intrauterine growth retardation: implications for the animal sciences. J Anim Sci. 2006;84(9):2316–37. doi: 10.2527/jas.2006-156. [DOI] [PubMed] [Google Scholar]
- 6.Ford SP, Hess BW, Schwope MM, Nijland MJ, Gilbert JS, Vonnahme KA, Means WJ, Han H, Nathanielsz PW. Maternal undernutrition during early to mid-gestation in the ewe results in altered growth, adiposity, and glucose tolerance in male offspring. J Anim Sci. 2007;85(5):1285–94. doi: 10.2527/jas.2005-624. [DOI] [PubMed] [Google Scholar]
- 7.Zhou Y, Nijland M, Miller M, Ford S, Nathanielsz PW, Brenna JT. The influence of maternal early to mid-gestation nutrient restriction on long chain polyunsaturated fatty acids in fetal sheep. Lipids. 2008;43(6):525–31. doi: 10.1007/s11745-008-3186-1. [DOI] [PubMed] [Google Scholar]
- 8.Page KR. The physiology of the human placenta. London: UCL press; 1993. [Google Scholar]
- 9.Stegeman JHJ. Placental development in the sheep and its regulation to fetal development. Bijdragen Tot De Dierkunde (Contrib Zool) 1974;44:3–72. [Google Scholar]
- 10.Wooding FB, Fowden AL, Bell AW, Ehrhardt RA, Limesand SW, Hay WW. Localisation of glucose transport in the ruminant placenta: implications for sequential use of transporter isoforms. Placenta. 2005;26(8-9):626–40. doi: 10.1016/j.placenta.2004.09.013. [DOI] [PubMed] [Google Scholar]
- 11.Illsley NP. Glucose transporters in the human placenta. Placenta. 2000;21(1):14–22. doi: 10.1053/plac.1999.0448. [DOI] [PubMed] [Google Scholar]
- 12.Hanebutt FL, Demmelmair H, Schiessl B, Larque E, Koletzko B. Long-chain polyunsaturated fatty acid (LC-PUFA) transfer across the placenta. Clin Nutr. 2008;27(5):685–93. doi: 10.1016/j.clnu.2008.05.010. [DOI] [PubMed] [Google Scholar]
- 13.Duttaroy AK. Transport of fatty acids across the human placenta: a review. Prog Lipid Res. 2009;48(1):52–61. doi: 10.1016/j.plipres.2008.11.001. [DOI] [PubMed] [Google Scholar]
- 14.Campbell FM, Dutta-Roy AK. Plasma membrane fatty acid-binding protein (FABPpm) is exclusively located in the maternal facing membranes of the human placenta. FEBS Lett. 1995;375(3):227–30. doi: 10.1016/0014-5793(95)01216-2. [DOI] [PubMed] [Google Scholar]
- 15.Abbud W, Habinowski S, Zhang JZ, Kendrew J, Elkairi FS, Kemp BE, Witters LA, Ismail-Beigi F. Stimulation of AMP-activated protein kinase (AMPK) is associated with enhancement of Glut1-mediated glucose transport. Arch Biochem Biophys. 2000;380(2):347–52. doi: 10.1006/abbi.2000.1935. [DOI] [PubMed] [Google Scholar]
- 16.Hardie DG, Hawley SA. AMP-activated protein kinase: the energy charge hypothesis revisited. Bioessays. 2001;23(12):1112–9. doi: 10.1002/bies.10009. [DOI] [PubMed] [Google Scholar]
- 17.Zhu MJ. Down-regulation of growth signaling pathways linked to a reduced cotyledonary vascularity in placentomes of over-nourished, obese pregnant ewes. Placenta. 2009;30(5):405–10. doi: 10.1016/j.placenta.2009.02.001. [DOI] [PMC free article] [PubMed] [Google Scholar]
- 18.Lim CT, Kola B, Korbonits M. AMPK as a mediator of hormonal signalling. J Mol Endocrinol. 2010;44(2):87–97. doi: 10.1677/JME-09-0063. [DOI] [PubMed] [Google Scholar]
- 19.Hay N, Sonenberg N. Upstream and downstream of mTOR. Genes Dev. 2004;18(16):1926–45. doi: 10.1101/gad.1212704. [DOI] [PubMed] [Google Scholar]
- 20.Hardie DG. The AMP-activated protein kinase pathway--new players upstream and downstream. J Cell Sci. 2004;117(Pt 23):5479–87. doi: 10.1242/jcs.01540. [DOI] [PubMed] [Google Scholar]
- 21.Reynolds LP, Redmer DA. Utero-placental vascular development and placental function. J Anim Sci. 1995;73(6):1839–51. doi: 10.2527/1995.7361839x. [DOI] [PubMed] [Google Scholar]
- 22.Avruch J, Lin Y, Long X, Murthy S, Ortiz-Vega S. Recent advances in the regulation of the TOR pathway by insulin and nutrients. Curr Opin Clin Nutr Metab Care. 2005;8(1):67–72. doi: 10.1097/00075197-200501000-00010. [DOI] [PubMed] [Google Scholar]
- 23.Roux PP, Blenis J. ERK and p38 MAPK-activated protein kinases: a family of protein kinases with diverse biological functions. Microbiol Mol Biol Rev. 2004;68(2):320–44. doi: 10.1128/MMBR.68.2.320-344.2004. [DOI] [PMC free article] [PubMed] [Google Scholar]
- 24.Zhu MJ, Du M, Hess BW, Means WJ, Nathanielsz PW, Ford SP. Maternal nutrient restriction upregulates growth signaling pathways in the cotyledonary artery of cow placentomes. Placenta. 2007;28(4):361–8. doi: 10.1016/j.placenta.2006.04.005. [DOI] [PubMed] [Google Scholar]
- 25.Sanson DW, West TR, Tatman WR, Riley ML, Judkins MB, Moss GE. Relationship of body composition of mature ewes with condition score and body weight. J Anim Sci. 1993;71(5):1112–6. doi: 10.2527/1993.7151112x. [DOI] [PubMed] [Google Scholar]
- 26.Council NR. Nutrient Requirements of Sheep. Washington DC: National Academic Press; 1985. [Google Scholar]
- 27.Vatnick I, Schoknecht PA, Darrigrand R, Bell AW. Growth and metabolism of the placenta after unilateral fetectomy in twin pregnant ewes. J Dev Physiol. 1991;15(6):351–6. [PubMed] [Google Scholar]
- 28.Long NM, Hill GM, Baker JF, Graves WM, Froetschel MA, Keisler DH, Mullinix BG., Jr BG. Reproductive performance of beef heifers supplemented with corn gluten feed and rumen-protected fat before breeding. The Professional Animal Scientist. 2007;23:316–24. [Google Scholar]
- 29.Ma Y, Zhu MJ, Zhang L, Hein SM, Nathanielsz PW, Ford SP. Maternal obesity and overnutrition alters fetal growth rate and cotyledonary vascularity and angiogenic factor expression in the ewe. Am J Physiol Regul Integr Comp Physiol. 2010;210(1):249–58. doi: 10.1152/ajpregu.00498.2009. [DOI] [PMC free article] [PubMed] [Google Scholar]
- 30.Wilson ME, Ford SP. Comparative aspects of placental efficiency. Reprod Suppl. 2001;58:223–32. [PubMed] [Google Scholar]
- 31.Coan PM, Vaughan OR, Sekita Y, Finn SL, Burton GJ, Constancia M, Fowden AL. Adaptations in placental phenotype support fetal growth during undernutrition of pregnant mice. J Physiol. 2009;588(Pt 3):527–38. doi: 10.1113/jphysiol.2009.181214. [DOI] [PMC free article] [PubMed] [Google Scholar]
- 32.Ma Y, Hein SM, Nathanielsz PW, Ford SP. Nutrient restriction during early pregnancy in sheep results in increased placenta vascularity by mid-gestation. Reprod Sci. 2010;17(No. 3(Suppl)):122A. [Google Scholar]
- 33.Crawford MA, Hassam AG, Stevens PA. Essential fatty acid requirements in pregnancy and lactation with special reference to brain development. Prog Lipid Res. 1981;20:31–40. doi: 10.1016/0163-7827(81)90011-4. [DOI] [PubMed] [Google Scholar]
- 34.Bispham J, Gopalakrishnan GS, Dandrea J, Wilson V, Budge H, Keisler DH, Broughton Pipkin F, Stephenson T, Symonds ME. Maternal endocrine adaptation throughout pregnancy to nutritional manipulation: consequences for maternal plasma leptin and cortisol and the programming of fetal adipose tissue development. Endocrinology. 2003;144(8):3575–85. doi: 10.1210/en.2003-0320. [DOI] [PubMed] [Google Scholar]
- 35.Hajduch E, Litherland GJ, Hundal HS. Protein kinase B (PKB/Akt)--a key regulator of glucose transport? FEBS Lett. 2001;492(3):199–203. doi: 10.1016/s0014-5793(01)02242-6. [DOI] [PubMed] [Google Scholar]
- 36.Fryer LG, Foufelle F, Barnes K, Baldwin SA, Woods A, Carling D. Characterization of the role of the AMP-activated protein kinase in the stimulation of glucose transport in skeletal muscle cells. Biochem J. 2002;363(Pt 1):167–74. doi: 10.1042/0264-6021:3630167. [DOI] [PMC free article] [PubMed] [Google Scholar]
- 37.Ford SP, Zhang L, Zhu M, Miller MM, Smith DT, Hess BW, Moss GE, Nathanielsz PW, Nijland MJ. Maternal obesity accelerates fetal pancreatic {beta} cell but not {alpha} cell development in the sheep: prenatal and postnatal consequences. Am J Physiol Regul Integr Comp Physiol. 2009;297(3):R835–43. doi: 10.1152/ajpregu.00072.2009. [DOI] [PMC free article] [PubMed] [Google Scholar]
- 38.Merrill GF, Kurth EJ, Hardie DG, Winder WW. AICA riboside increases AMP-activated protein kinase, fatty acid oxidation, and glucose uptake in rat muscle. Am J Physiol. 1997;273(6 Pt 1):E1107–12. doi: 10.1152/ajpendo.1997.273.6.E1107. [DOI] [PubMed] [Google Scholar]
- 39.Lopez M, Lelliott CJ, Vidal-Puig A. Hypothalamic fatty acid metabolism: a housekeeping pathway that regulates food intake. Bioessays. 2007;29(3):248–61. doi: 10.1002/bies.20539. [DOI] [PubMed] [Google Scholar]
- 40.DRI Report-Energy, Carbohydrate, Fiber, Fat, Fatty Acids, Cholesterol, Protein, and Amino Acids (Macronutrients) National Academy of Sciences, Institute of Medicine; 2005. p. 109. [Google Scholar]
- 41.Kovacic S, Soltys CL, Barr AJ, Shiojima I, Walsh K, Dyck JR. Akt activity negatively regulates phosphorylation of AMP-activated protein kinase in the heart. J Biol Chem. 2003;278(41):39422–7. doi: 10.1074/jbc.M305371200. [DOI] [PubMed] [Google Scholar]
- 42.Minokoshi Y, Alquier T, Furukawa N, Kim YB, Lee A, Xue B, Mu J, Foufelle F, Ferre P, Birnbaum MJ, Stuck BJ, Kahn BB. AMP-kinase regulates food intake by responding to hormonal and nutrient signals in the hypothalamus. Nature. 2004;428(6982):569–74. doi: 10.1038/nature02440. [DOI] [PubMed] [Google Scholar]
- 43.Parenti A, Morbidelli L, Cui XL, Douglas JG, Hood JD, Granger HJ, Ledda F, Ziche M. Nitric oxide is an upstream signal of vascular endothelial growth factor-induced extracellular signal-regulated kinase1/2 activation in postcapillary endothelium. J Biol Chem. 1998;273(7):4220–6. doi: 10.1074/jbc.273.7.4220. [DOI] [PubMed] [Google Scholar]
- 44.Vonnahme KA, Hess BW, Nijland MJ, Nathanielsz PW, Ford SP. Placentomal differentiation may compensate for maternal nutrient restriction in ewes adapted to harsh range conditions. J Anim Sci. 2006;84(12):3451–9. doi: 10.2527/jas.2006-132. [DOI] [PubMed] [Google Scholar]
- 45.Dennis PB, Jaeschke A, Saitoh M, Fowler B, Kozma SC, Thomas G. Mammalian TOR: a homeostatic ATP sensor. Science. 2001;294(5544):1102–5. doi: 10.1126/science.1063518. [DOI] [PubMed] [Google Scholar]


