

Abstract
N-methyl-D-aspartate receptor (NMDAR) ontogeny and subunit expression are altered during developmental lead (Pb2+) exposure. However, it is unknown whether these changes occur at the synaptic or cellular level. Synaptic and extra-synaptic NMDARs have distinct cellular roles, thus, the effects of Pb2+ on NMDAR synaptic targeting may affect neuronal function. In this communication, we show that Pb2+ exposure during synaptogenesis in hippocampal neurons altered synaptic NMDAR composition, resulting in a decrease in NR2A-containing NMDARs at established synapses. Conversely, we observed increased targeting of the obligatory NR1 subunit of the NMDAR to the postsynaptic density (PSD) based on the increased colocalization with the postsynaptic protein PSD-95. This finding together with increased binding of the NR2B-subunit specific ligand [3H]-ifenprodil, suggests increased targeting of NR2B-NMDARs to dendritic spines as a result of Pb2+ exposure. During brain development, there is a shift of NR2B- to NR2A-containing NMDARs. Our findings suggest that Pb2+ exposure impairs or delays this developmental switch at the level of the synapse. Finally, we show that alter expression of NMDAR complexes in the dendritic spine is most likely due to NMDAR inhibition, as exposure to the NMDAR antagonist aminophosphonovaleric acid (APV) had similar effects as Pb2+ exposure. These data suggest that NMDAR inhibition by Pb2+ during synaptogensis alters NMDAR synapse development, which may have lasting consequences on downstream signaling.
Keywords: NMDA Receptor, NR2B, NR2A, NR1, Lead, synaptic targeting, APV
1. Introduction
Brain development, as well as learning and memory, is the result of modifications in synapses as defined by patterns of neuronal activity and alterations in the function and trafficking of the NMDA receptor (NMDAR) subtype of excitatory amino acid receptors (Chen and Tonegawa, 1997; Pérez-Otaño and Ehlers, 2005; Tsien et al., 1996). A variety of studies have demonstrated that Pb2+ is a potent non-competitive antagonist of the NMDAR (Alkondon et al., 1990; Gavazzo et al., 2008; Guilarte and Miceli, 1994; Omelchenko et al., 1997; Ujihara and Albuquerque, 1992). Studies in animal models of developmental Pb2+ exposure show altered ontogeny of NMDAR subunits and downstream signaling (Guilarte and McGlothan, 1998; Nihei et al., 2000; Toscano and Guilarte, 2005; Zhang et al., 2002) which are associated with deficits in long-term potentiation in the hippocampus and impairment of spatial learning (Gilbert et al., 1996; Guilarte and McGlothan, 2003; Nihei et al., 2000; Ruan et al., 1998).
The NMDAR is one of three main types of glutamatergic receptors in the mammalian brain (Monaghan et al., 1983) and is composed of an obligatory NR1 subunit and accessory subunits from the NR2 and NR3 family. Specific splice variants of NR1 impart different pharmacological characteristics of the NMDAR (Durand et al., 1992) and are expressed differentially during development (Zukin and Bennett, 1995) and on the basis of synaptic activity (Pauly et al., 2005). The NR2 family consists of NR2A, NR2B, NR2C, and NR2D family members (Ishii et al., 1993; Monyer et al., 1992; Monyer et al., 1994). In the hippocampus, NR2A and NR2B are the most abundant NR2 family members. These two subunits exhibit differential developmental expression, with NR2B subunit expression levels high during fetal development and early postnatal life while NR2A subunit expression increases with postnatal maturation (Monyer et al., 1994). Besides exhibiting differential developmental expression, NR2A and NR2B subunits also have distinct intracellular protein associations and signaling pathways, believed to be mediated through protein interactions with the C-terminus. NR2A- and NR2B-containing NMDARs have differential MAPK signaling (Kim et al., 2005), pro-death or pro-life signaling (Soriano et al., 2008), and differential induction of nuclear gene expression (Hardingham et al., 2002). These differential effects on cell signaling and gene expression may also be mediated by NMDAR localization; NR2A-containing receptors are predominately located synaptically, while NR2B-containing receptors are expressed both synaptically and extrasynaptically (Tovar and Westbrook, 1999).
The combination of NMDAR splice variants and subunit composition create a diverse array of receptors with different biological functions. Developmental Pb2+ exposure has been shown to disrupt this delicate balance, causing alterations in NR1 splice variant expression, NR2 subunit ontogeny, and NMDAR-dependent signaling. Specifically, developmental Pb2+ exposure in animals resulted in altered expression of NR1 splice variants (Guilarte and McGlothan, 2003), and decreased expression of the NR2A subunit with no change or a small increase in NR2B subunit expression (Nihei et al., 2000; Nihei and Guilarte, 1999; Zhang et al., 2002). Developmental Pb2+ exposure resulted in increased levels of NR2B-containing receptors (Toscano et al., 2002), suggesting that Pb2+ exposure may delay or prevent the essential developmental switch from predominately NR2B-containing NMDARs (NR2B-NMDARs) to NR2A-containing NMDARs (NR2A-NMDARs) (Toscano and Guilarte, 2005). Finally, developmental Pb2+ exposure was shown to disrupt downstream signaling including the binding ability, phosphorylation status, and transcriptional activity of the cyclic-AMP response element binding protein (CREB) (Toscano et al., 2002; Toscano et al., 2003). Alterations in calcium (Ca2+)/calmodulin-dependent kinase activity (Toscano et al., 2005) and MAPK signaling (Cordova et al., 2004) have also been observed in animal models of Pb2+ exposure. Together, these studies demonstrate that chronic Pb2+ exposure during brain development negatively affects the developmental expression and function of NMDARs, which may have lasting consequences on intracellular signaling and synaptic plasticity. However, these studies were limited to detection of changes on the cellular level, and were unable to determine the effects of Pb2+ at the level of the synapse.
The current study was undertaken to determine if Pb2+ exposure altered the synaptic expression of NMDARs during synaptogenesis in hippocampal neurons. Since NMDARs can exhibit distinct cellular signaling properties based on their synaptic targeting it is important to determine whether Pb2+ exposure alters NMDAR localization. We used a primary hippocampal culture model to obtain high-resolution images of neurons after exposure to Pb2+ (10 nM to 1 μM) during the critical window for synaptogenesis in these cultures (day in vitro, DIV7-DIV12). We show that Pb2+ exposure during synaptogenesis resulted in altered expression of NMDARs at established synapses, with a specific reduction of NR2A-NMDARs juxtaposed to presynaptic contact sites. Exposure to Pb2+ during this critical window also increased the levels of NR2B-NMDARs found in dendritic spines. The increased targeting of the NR1 subunit to the PSD is likely a compensatory response of the neuron to prolonged NMDAR inhibition, as exposure to the NMDAR antagonist aminophosphonovaleric acid (APV) resulted in similar effects as Pb2+ exposure.
2. Methods
2.1 Animal Care and Use Statement
All animal studies were reviewed and approved by the Johns Hopkins University Animal Care and Use Committee and have been conducted in accordance with the Guide for Care and Use of Laboratory Animals as adopted and promulgated by the U.S. National Institutes of Health.
2.2 Cell culture
Primary hippocampal cultures were obtained from E18 Sprague-Dawley rat pups (Harlan, Frederick, MD). Low density cultures (14,000 cells/cm2) were seeded and maintained as described elsewhere (Neal et al., 2010). Feeding medium was composed of fetal bovine serum (FBS, 1% v/v, Hyclone-Thermo Scientific, Waltham, MA), 2 mM glutamax (Invitrogen, Carlsbad, CA), and penicillin/streptomycin (100 units each, Invitrogen) in neurobasal medium (Invitrogen). Pb-acetate (95% pure, Sigma Aldrich, St. Louis, MO) and/or APV (≥98% pure; Sigma) were added to the feeding medium on DIV7 while vehicle (feeding media without Pb-acetate) was added to control cultures. Neurons were harvested 5 days after dosing (DIV12), without media exchange between DIV7 and DIV12.
2.3 Pb2+ analysis
Samples of the stock solutions of Pb2+ (100 μM and 10 μM) used to treat cells were sent periodically to ESA Laboratories, Inc. (Magellan Biosciences, Chelmsford, MA) for atomic absorption spectroscopy. Reports from ESA labs showed that our 100 μM and 10 μM Pb2+ stock solutions were within the intended range (91.4 ± 4.9 μM, n=9 samples; and 9.6 ± 0.4 μM, n=4 samples, respectively).
2.4 Immunocytochemistry
On DIV12, immunocytochemistry was performed as described elsewhere (Neal et al., 2010). Briefly, On DIV12, neurons grown on glass coverslips were initially fixed in 4% paraformaldehyde (v/v), 4% sucrose (w/v) in phosphate buffered saline (PBS) followed by secondary fixation in ice cold methanol. Cells were permeablized in 0.2% Triton in PBS (v/v) and blocked in 10% normal goat serum in PBS (v/v). Samples were incubated in primary antibodies diluted in blocking solution overnight at 4° C using the following dilutions: 1 μg/mL NR2A (Upstate 07–632, Billerica, MA); 1:100 NR2B (Chemicon AB1557P); 1:500 Synaptophysin (mouse, Sigma S5768); 1:100 Synaptophysin (rabbit, Santa Cruz sc9112, Santa Cruz, CA); 11 μg/mL PSD-95 (Chemicon MAB1596). Synaptophysin (Syn) was used as a colabel in juxtaposition studies with NMDAR subunits and based on the species of NMDAR antibody (rabbit or mouse) the appropriate Syn antibody (rabbit or mouse) was selected. After incubation in primary antibodies the neurons were washed in PBS and incubated in the appropriate secondary antibodies (10 μg/mL Alexafluor488 or Alexafluor594; Invitrogen-Molecular Probes, Carlsbad, CA) diluted in blocking solution (10% v/v normal goat serum in phosphate-buffered saline) at room temperature. Following another series of washes in PBS the coverslips were mounted onto slides in ProLong Gold mounting media (Molecular Probes). Slides were coded to ensure that imaging and analyses were conducted in a blinded fashion.
2.5 Imaging and Image Analysis of Fixed Coverslips
Immunofluorescently-labeled neurons were imaged at 63x magnification using a single-point, laser scanning confocal microscope (LSM510-Meta, Zeiss, Thornwood, NY) utilizing LSM image software at the Johns Hopkins University School of Medicine Microscope Facility. All coverslips stained under the same conditions were imaged using the same scanning parameters on the same day. Four to 7 confocal stacks of single neurons were obtained for each experimental condition. Confocal stacks were projected into single images using the maximum fluorescence. Images were analyzed using Metamorph Offline (Molecular Devices, Downingtown, PA). Images obtained from the same experiment were thresholded at the same level for analysis. Several parameters of synaptic protein expression were measured using integrated morphometry analysis. They include immunofluorescent puncta density (number of puncta per μm dendrite), area (average area of puncta), intensity (average grey value of puncta), and total grey value (integration of puncta intensity relative to area). Puncta intensity thus measures the average intensity of the fluorescent puncta while puncta total grey value gives a semi-quantitative measurement of protein quantity. For colocalization (or juxtaposition) analysis, gray scale images at each wavelength for the same neuron were used to select 3 – 6 dendritic regions. Selected dendritic regions were at least 10 μm from the cell body, were clearly identifiable as single processes, and could be traced back to the imaged neuron. All dendrites which fit these criteria in a single image were sampled. Using the tool “Measure Colocalization”, the area of colocalized pixels of both wavelengths in these regions was used to calculate the percent colocalization of the cell. Percent colocalization was calculated as follows:
where A and B are individual wavelengths for the same image.
2.6 Protein harvesting and western blotting
For whole cell protein levels cells were harvested on DIV12 as described in Neal et al. (2010). Western blot membranes were incubated in the appropriate primary antibodies (1:200 NR1, JH4456: kind gift of Dr. Richard Huganir; 1:1000 MAP2 Santa Cruz sc74421; 1:200 NR2B BD 610416, Franklin Lakes, New Jersey; 1:1000 Actin, Santa Cruz sc1616) diluted in blocking solution overnight at 4°C. The membranes were visualized using the Odyssey imaging system (LiCor, Lincoln, NE). The integrated intensity of the protein of interest was normalized to actin levels from the same blot.
2.7 [3H]-ifenprodil Binding Assays
[3H]-ifenprodil binding assays were performed as described previously (Toscano et al., 2002), but modified for cell culture samples. Hippocampal neurons were scraped into ice cold Tris-HCl buffer (50 mM, pH 7.4). Harvests from 2 separate dissections were pooled to provide adequate protein quantity for detection. Cells were homogenized using a dounce homogenizer. Protein quantification using the BCA protein assay (BioRad, Hercules, CA) was run in parallel to radioligand binding assays, and the disintegrations per minute (dpm) of each sample were converted to pmol [3H]-ifenprodil and normalized to protein content using Microsoft Excel (Microsoft, Redmond, WA). Assays were performed in the presence of 375 μM 1-(2-[bis(4-Fluorophenyl)methoxy]ethyl)-4-(3-phenylpropyl)piperazine dihydrochloride (GBR) to prevent binding of [3H]-ifenprodil to sigma receptors.
2.8 Statistical Analyses
For immunocytochemistry experiments, data from 3 or more independent trials were internally normalized to the average control value and the normalized data were pooled. Data were then analyzed using one-way ANOVA (Superanova, Abacus Concepts, Piscataway, NJ). Significance was set at p<0.05 and post hoc analysis utilized Fisher’s Protected LSD test. Data comparing a single treatment condition to control were subjected to Student’s two-tailed t-tests. Western blots were performed with duplicate sample loading. The average of the duplicates was used as the single datum point for an independent trial. Three or more independent trials were pooled and subjected to one-way ANOVA. 3[H]-ifenprodil binding assay data were analyzed by one-way ANOVA followed by Fisher’s Protected LSD analysis at the p < 0.05 level of significance.
3. Results
3.1 Exposure to Pb2+ during synaptogenesis reduces the levels of NR2A-containing NMDA receptors juxtaposed to the presynaptic protein Synaptophysin (Syn)
Exposure to Pb2+ (0.01, 0.1, and 1.0 μM) was initiated at 7 days in vitro (DIV7) and terminated at DIV12. This time period corresponds to the critical window for synaptogenesis in these cultures (Fletcher et al., 1994), and allowed us to assess the effects of Pb2+ on developing synapses. We have shown that these concentrations of Pb2+ are non-cytotoxic and correlate to the levels of Pb2+ found in the brain of developmentally-exposed rats (Neal et al., 2010; Guilarte et al., 2003).
We examined the effects of Pb2+ exposure on NMDAR targeting at established synapses defined by the juxtaposition of the presynaptic vesicular protein synaptophysin (Syn) with the postsynaptic NMDAR subunits NR1, NR2A or NR2B in the PSD. Figure 1A–F depicts representative images of the juxtaposition of NMDAR subunits with Syn. Juxtaposition can be visualized as orange or yellow, indicating the apparent overlap of the NMDAR subunit (green) with Syn (red). Juxtaposition of Syn with the NR1 and NR2A but not with the NR2B subunit was reduced as a function of Pb2+ concentration (Figure 1G; n=16–18 neurons from 3 trials). Furthermore, the juxtaposition of the NR2A subunit with Syn was significantly decreased even at the lowest level of Pb2+ tested, 0.01 μM. These findings suggest that synapses with NR1/NR2A-NMDARs are significantly decreased after the Pb2+ exposure period. On the other hand, no significant effect was observed with synapses containing the NR2B subunit after exposure to any of the concentrations of Pb2+. In parallel studies published elsewhere (Neal et al, 2010), we observed that the levels of Syn decreased in a concentration-dependent manner during the same period of Pb2+ exposure.
Figure 1. Pb2+ exposure decreases the juxtaposition of NR1 and NR2A with synaptophysin (Syn)-containing presynaptic active zones.

Representative images of control (A, C, E) and 1 μM Pb2+-treated (B, D, F) neurons stained for NR1 (A, B), NR2A (C, D), and NR2B (E, F) in green and Syn in red. Juxtaposition is visualized as yellow or orange color. Highlighted regions for each cell are shown magnified to the right. (G) Quantification of the juxtaposition of NR1, NR2A, and NR2B with Syn. A concentration-dependent decrease in juxtaposition of NR1 and NR2A is observed after exposure to Pb2+ but NR2B juxtaposition with Syn does not change significantly. Data are mean ± SEM and are the result of 3 independent trials with 16–18 neurons per condition. Scale bar = 20 μm, * = significance from control, # = significance from 0.01 μM Pb2+, and @ = significance from 0.1 μM Pb2+ (Fisher’s Protected LSD).
3.2 Exposure to Pb2+ increases NR2B-NMDARs without affecting NMDAR subunit protein levels
One potential explanation for the data in the previous section is that Pb2+ exposure results in altered protein expression of NMDAR subunits. However, we did not detect any effect on the immunofluorescent staining of NR1, NR2A, or NR2B after Pb2+ exposure (Figure 2A–I). Furthermore, whole cell Western blots showed that although the levels of NR1 protein appeared to decrease with Pb2+ exposure, the trend did not reach statistical significance (Figure 2J–K). This may be due to the fact that approximately 50% of total NR1 protein is located intracellularly (Hall and Soderling, 1997; Huh and Wenthold, 1999). Thus, we may not be able to detect changes related to synaptic NR1 expression using whole cell preparations. Consistent with other studies (Neal et al., 2010), we did not observe any evidence of neuron-specific cytotoxicity since the levels of microtubule associated protein (MAP2) remained constant after Pb2+ exposure. Westerns for NR2A were not feasible in our hands due to the low abundance of this protein at this stage of development in primary cultures. Together, the western data indicate that neuronal viability and postsynaptic protein expression is unaffected by Pb2+ exposure. Therefore, as previously shown by us, the decreased juxtaposition of NR1 and NR2A with Syn is mediated by loss of Syn protein (Neal et al., 2010).
Figure 2. Pb2+ exposure does not affect NMDAR subunit protein expression.

(A-C) Representative image of control (A) and 1.0 μM Pb2+-treated (B) neurons stained for NR1. Quantification shown in C.
(D-F) Representative image of control (D) and 1.0 μM Pb2+-treated (D) neurons stained for NR2A. Quantification in F.
(G-I) Representative image of control (G) and 1.0 μM Pb2+-treated (H) neurons stained for NR2B. Quantification in I.
(J) Representative immunoblots of NR1, NR2B, and MAP2 protein from whole cells.
(K) Quantification of (J). Data are shown as mean ± SEM and are the result of 3–4 independent trials
Image data are the mean ± SEM and are the results of at least 3 independent trials with 4–6 neurons per condition per trial. Scale = 20 μm
Our immunofluorescence confocal imaging data on the juxtaposition of NMDAR subunits with Syn suggests a Pb2+-induced decrease in synapses containing NR1/NR2A-NMDARs. This effect may produce a proportional increase in synapses containing NR1/NR2B-NMDARs. To test this hypothesis, we performed whole-cell radioligand binding studies using the NR2B subunit-specific radioligand [3H]-ifenprodil. Figure 3 shows that Pb2+ exposure at 1 μM caused a significant increase of [3H]-ifenprodil binding to neuronal membranes, which is indicative of an increase in NR2B-containing NMDARs.
Figure 3. Pb2+ exposure increases the levels of NR2B-containing receptors.
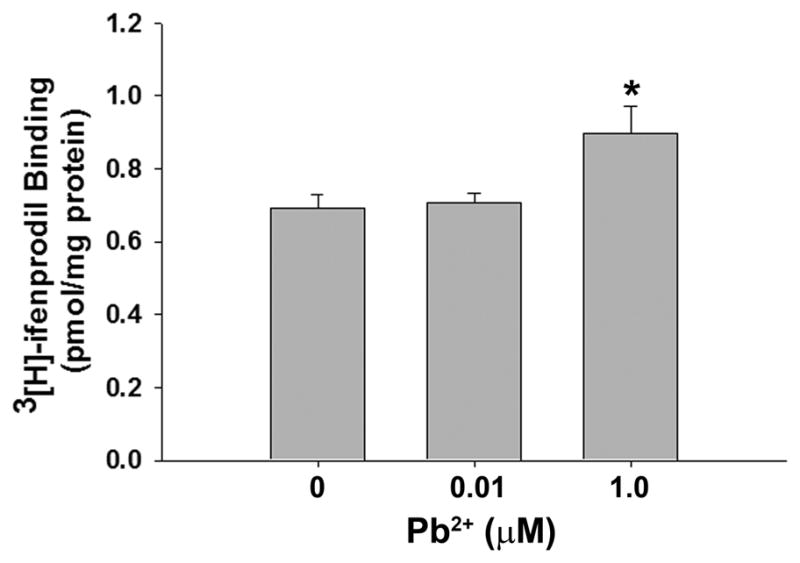
[3H]-ifenprodil radioligand binding assays revealed a ~30% increase in specific binding after exposure to 1 μM Pb2+. Assays were performed in the presence of GBR to prevent binding of radioligand to sigma receptors. Data are shown as the mean ± SEM and are the result of 3 independent assays. * = significance from all other treatments (Fisher’s Protected LSD).
3.3 Lead exposure increases NR1 subunit targeting to the PSD
The increased level of [3H]-ifenprodil binding as a result of Pb2+ exposure could be due to alterations in the targeting of NMDAR subunits to the PSD. To test this hypothesis, we examined the colocalization of the NR1, NR2A and NR2B subunits with PSD-95, a protein integral to the PSD. Figure 4 demonstrates a significant increase in the colocalization of the NR1, but neither the NR2A nor NR2B subunit, with PSD-95 after Pb2+ exposure (Figure 4; n=25 neurons from 4 trials). The increase in NR1 subunit targeting to the PSD was significant at the 1 μM Pb2+ concentration, which is the same Pb2+ concentration in which increased [3H]-ifenprodil binding was observed (see above and Figure 3).
Figure 4. Pb2+ exposure increases NR1 targeting to the PSD.

(A-C) Representative images of control (A) and 1 μM Pb2+ (B)-treated neurons stained for NR1 (green) and PSD95 (red). Colocalization is shown as yellow or orange color. Quantification of colocalization is shown in (C). A significant, concentration-dependent increase in NR1 colocalization with PSD95 was observed after Pb2+ exposure.
(D-F) Representative images of control (D) and 1 μM Pb2+ (E)-treated neurons stained for NR2A (green) and PSD95 (red). Colocalization is shown as yellow or orange color. Quantification of colocalization is shown in (F). No effect on NR2A colocalization with PSD95 was observed after Pb2+ exposure.
(G-I) Representative images of control (G) and 1 μM Pb2+ (H)-treated neurons stained for NR2B (green) and PSD95 (red). Colocalization is shown as yellow or orange color. Quantification of colocalization is shown in (I). No effect on NR2B colocalization with PSD95 was observed after Pb2+ exposure.
Data are shown as the mean ± SEM and are the result of 4 independent trials with 22–26 neurons per condition. * = significance from control (Fisher’s Protected LSD).
The increase in NR1 colocalization with PSD-95 produced by Pb2+ exposure was not due to an increase in spine density, since PSD-95 puncta density did not change (Figure 5; n=15 neurons from 3 trials). However, we did observe a small but significant increase in PSD-95 puncta area of 122 ± 12% of control at the lowest level of Pb2+ tested. The implication of this effect has not been determined. As the obligatory subunit of the NMDAR, increased targeting of NR1 to the PSD suggests elevated NMDAR levels in dendritic spines. This observation, combined with the Pb2+-induced increase in [3H]-ifenprodil binding suggests that the increase in receptor levels likely correspond to NR2B-containing receptors.
Figure 5. Pb2+ exposure results in a small increase in PSD-95 area at 0.01 μM.

Representative images of control (A), 0.01 (B), 0.1 (C), and 1.0 μM (D)-treated neurons stained for PSD-95. (E): Quantification of immunofluorescent parameters. Data are represented as the mean ± SEM and are the result of 3 independent trials with 13–17 neurons per condition. * = significance from control (Fisher’s Protected LSD). Scale bar = 20 μm.
3.4 NMDAR inhibition by the NMDAR-specific atagonist APV has similar effects as Pb2+ exposure
Changes in NMDAR activity can alter NMDAR subunit targeting to the PSD (Lee et al., 2010; Pérez-Otaño and Ehlers, 2005). Since Pb2+ is a potent NMDAR antagonist, Pb2+ exposure could alter NMDAR targeting via NMDAR inhibition. If this is the case, then exposure of hippocampal neurons to the selective NMDAR antagonist aminophosphonovaleric acid (APV) should mimic the effects of Pb2+ on NR1 targeting to the PSD.
We found that, similar to Pb2+, APV treatment (100 μM) increased the targeting of the NR1 subunit to the postsynaptic density (Figure 6). After exposure to APV, NR1 colocalization with PSD-95 increased to 216 ± 20% (n=14 neurons from 3 independent trials) of control values. By comparison, 1 μM Pb2+ increased NR1 colocalization with PSD-95 to 150 ± 17% (n=13 neurons from 3 independent trials) and co-exposure to both antagonists increased colocalization to 148 ± 19% (n=14 neurons from 3 independent trials) relative to controls (F3,48=6.37, p<0.01). Examination of the parameters of the colocalization calculation ( ), revealed that the higher magnitude of colocalization after exposure to APV was driven by decreased dendritic (or total) NR1 area. APV reduced NR1 area by 58.8 ± 7.0% (n=14 neurons from 3 independent trials). This was further supported by decreased NR1 immunofluorescent parameters (Figure 6F) and NR1 protein levels (Figure 6H–I) in APV-treated neurons. APV exposure reduced NR1 protein expression by 57.5 ± 12.8% relative to control conditions measured by Western blot (n=3 independent experiments). In contrast, Pb2+ alone or in combination with APV did not significantly reduce NR1 expression. No effect was observed on PSD-95 puncta parameters (Figure 6G), except that neurons exposed simultaneously to both antagonists exhibited a small but significant decrease in PSD-95 puncta intensity (decrease to 89.9 ± 3.8% of control; n=14 neurons from 3 independent trials). The functional significance of this effect on PSD-95 has yet to be determined.
Figure 6. NMDAR inhibition results in increased NR1 targeting to the PSD.

Neurons were exposed to 100 μM APV, 1 μM Pb2+, or both from DIV7 - DIV12
(A-D) Representative images of control (A), 100 μM APV (B), 1 μM Pb2+ (C), and Pb2+ + APV (D)-treated neurons stained for NR1 (green) and PSD-95 (red). Colocalization is shown as yellow or orange color. Scale bar= 20 μm.
(E) Quantification of colocalization of NR1 and PSD-95. Both Pb2+ and APV treatments increase colocalization but APV treatment does so to a higher magnitude. The colocalization calculation is: . APV significantly reduces total NR1 dendritic area, resulting in increased percent colocalization. Data are the result of 3 independent trials with 12–14 neurons per treatment.
(F) NR1 immunofluorescent parameters. APV exposure significantly reduces NR1 puncta parameters, but Pb2+ or Pb2+ + APV treatments do not. Data are the result of 3 independent trials with 14–15 neurons per treatment.
(G) PSD-95 immunfluorescent parameters. No changes in spine density, area, or intensity are observed after any treatment, but neurons treated with APV + Pb2+ exhibited a decrease in PSD-95 puncta intensity. Data are the result of 3 independent trials with 14–15 neurons per treatment.
(H-I) Representative immunoblot of whole cell protein probed for NR1 and Actin (H). Quantification in (I). APV significantly reduces NR1 levels, but Pb2+ and co-exposure treatments do not, although they both exhibit non-significant reductions in NR1 protein. Data are the result of 3 independent trials.
Data are represented as the mean ± SEM. * = significance from control, @ = significance from 1.0 μM Pb2+, and # = significance from all other conditions (Fisher’s Protected LSD).
4. Discussion
In this communication we show that Pb2+ exposure during synaptogenesis alters NMDAR expression at developing synapses with a specific decrease of synapses containing NR1/NR2A-NMDARs and an increase in NR1/NR2B-NMDAR containing synapses. During early development, NR2B-containing NMDARs predominate until a developmental switch occurs, resulting in the incorporation of the NR2A subunit (Monyer et al., 1994). However, the present study, as well as previous work (Toscano et al., 2002), suggests that this developmental switch is delayed or impaired during Pb2+ exposure. We show here that this effect is NMDAR activity-dependent, since exposure to APV resulted in similar effects as we observed with Pb2+ exposure.
It is important to note that these effects were observed at concentrations of Pb2+ consistent with those in the hippocampus of animals exposed to Pb2+ during development (Guilarte and McGlothan, 2003; Guilarte et al., 2003; Nihei et al., 2000). The blood Pb2+ concentration in these animals is in the same range as that measured in Pb2+-intoxicated inner city children. Thus, the concentrations of Pb2+ used in the present study are relevant to contemporary exposures in pediatric populations. Furthermore, it is particularly noteworthy that many of the findings reported here are consistent with what has previously been shown in animal models of developmental Pb2+ exposure. Rats exposed to Pb2+ during development exhibit altered NR1 and NR2A subunit gene and protein expression in the hippocampus either without changes or a with small increase in NR2B subunit expression (Toscano and Guilarte, 2005). In addition, rats developmentally exposed to Pb2+ have elevated levels of NR2B-containing receptors in the hippocampus, as detected by [3H]-ifenprodil binding (Toscano et al., 2002) results that are similar to those presented in this in vitro study. Thus, cultured hippocampal neurons accurately represent Pb2+-mediated effects on NMDARs observed in vivo.
What are potential mechanism(s) by which Pb2+ exposure differentially alters NMDAR subunit expression? It is well-established that Pb2+ is a potent non-competitive antagonist of the NMDAR (Alkondon et al., 1990; Guilarte et al., 1994; Ujihara and Albuquerque 1992). We have suggested that the putative binding site of Pb2+ on the NMDAR is at a zinc (Zn2+) regulatory (inhibitory) site (Guilarte et al., 1995; Guilarte et al., 1994). Consistent with our findings, recent studies by Gavazzo et al. (2008) have shown that indeed Pb2+ interacts at the Zn2+ regulatory site of NMDAR complexes containing the NR2A but not the NR2B subunit. Thus, Pb2+ inhibition of NMDAR complexes containing the NR2B subunit is mediated by an alternative mechanism that has yet to be identified.
The N-terminal domain of the NR2 subunits contains the Zn2+ binding site. NR2A- containing complexes express high affinity (IC50= 20 nM) for Zn2+ while NR2B complexes have a low affinity (IC50= 2 μM) (Paoletti et al., 2000; Rachline et al., 2005). Since Pb2+ and Zn2+ have similar potencies in inhibiting the NMDAR (Guilarte et al., 1994; Guilarte et al., 1995), it is likely that Pb2+ concentrations (≈ 1 μM) achieved in the brain of intoxicated children and in our primary hippocampal neuron culture system inhibit NR2A-containing NMDAR complexes. This explanation is consistent with the observation that recombinant NR1/NR2A complexes are more sensitive to Pb2+ inhibition than NR1/NR2B complexes (Omelchenko et al., 1996). This suggests that changes observed with NR2A-NMDARs but not NR2B-NMDARs may be a result of preferential inhibition of Pb2+ for NR2A-NMDARs.
An alternative explanation to our findings is that a reduction in overall network activity induced by Pb2+ inhibition of the NMDAR prevents incorporation of the NR2A subunit in synaptic receptors (Barria and Malinow, 2002; Pérez-Otaño and Ehlers, 2005; Quinlan et al., 2004). Consistent with this idea, a recent study has shown that synapses that experience high activity levels express higher NR2A content while synapses with lower activity exhibit higher NR2B content (Lee et al., 2010).
Our observation that NMDAR inhibition by Pb2+ results in increased levels of NR2B-containing NMDARs is supported by similar studies in which hippocampal synaptic activity is dampened by pharmacological agents (Pérez-Otaño and Ehlers, 2005). Exposure to APV increased NR2B-NMDAR surface expression and APV withdrawal from the same cultures decreased NR2B-NMDAR surface expression (Chung et al., 2004). Interestingly, these changes in NR2B surface expression can occur without a change in whole-cell NR2B expression (Chung et al., 2004). This is consistent with our observations that Pb2+ exposure can increase NR2B-NMDAR synapses (Figure 3) without affecting whole-cell NR2B expression (Figure 2). Furthermore, a recent study by Lee et al. (2010) indicates that there is increased NR1 targeting and NR2B surface expression at single synapses which have been silenced by synapse-specific expression of tetanus toxin light chain, preventing vesicular release. These effects were shown to be specifically due to decreased NMDAR activity, as APV exposure increased NR1 and NR2B content while TTX exposure did not. This study strongly supports our hypothesis that prolonged exposure to Pb2+, which reduces NMDAR activity, can increase the amount of NR2B-NMDARs. Thus, the increase in NR2B-containing NMDARs (Figure 3) and the increased NR1 subunit targeting to the PSD (Figure 4) during Pb2+ exposure is likely a homeostatic response to decreased synaptic activity.
Altered NMDAR targeting by Pb2+ may have significant effects on cellular signaling pathways. NR2A-containing receptors localize to synapses while NR2B-containing complexes may be located both extra-synaptically and synaptically (Tovar and Westbrook, 1999). The latter is important, since synaptic localization can modulate the biological responses of NMDAR-mediated Ca2+ signaling. Specifically, synaptic NMDARs mediate CREB activation, synaptic plasticity and survival programs. On the other hand, extra-synaptic receptors are associated with a CREB-shut off pathway, and induce cellular death pathways (Hardingham et al., 2002; Vanhoutte and Bading, 2003). Extracellular signal-regulated kinases (ERK) activation is also differentially regulated by synaptic versus extrasynaptic NMDARs: it has been shown that only synaptic NMDARs have the ability to activate ERK and that extrasynaptic receptors likely mediate ERK inactivation (Ivanov et al., 2006). Thus, the alterations in NMDAR targeting due to Pb2+ described above may have significant downstream signaling consequences in exposed neurons and modify synaptic plasticity.
The present work extends our other observations regarding the effects of Pb2+ exposure during synaptogenesis (Neal et al., 2010). In that study, we observed that Pb2+ exposure during the same time period resulted in changes in presynaptic protein expression and impaired vesicular release in hippocampal neurons (Neal et al., 2010). In particular, we observed that there was a concentration-dependent decrease in Syn levels by Pb2+, such that many synapses in Pb2+-exposed neurons lacked Syn as well as the v-SNARE synaptobrevin (also called VAMP-2). Additionally, the overall number of synaptic release sites decreased with Pb2+ exposure (Neal et al., 2010). Since our current data showed a decrease in NR2A-Syn juxtaposition, we can conclude that the reduction of synaptic sites in Pb2+-exposed neurons likely corresponds to synapses which contained NR2A-NMDARs.
In conclusion, exposure to Pb2+ during synaptogenesis alters NMDAR targeting to the PSD in an NMDAR activity-dependent manner. This reduces the levels of synaptic NR2A-NMDARs and results in a specific increase in NR2B-NMDARs in dendritic spines. Pb2+ did not alter cellular expression of NMDAR subunits, indicating that these effects were due to targeting and not altered protein levels. Furthermore, the increased levels of NR2B-NMDARs were not due to changes in spine density, since PSD-95 puncta density did not change during Pb2+ exposure. These findings suggest that inhibition of the NMDAR by Pb2+ during development may arrest or impair the critical developmental switch from predominantly NR2B- NMDARs to NR2A-NMDARs, which may have lasting consequences on neuronal function and synaptic plasticity.
Acknowledgments
We thank Dr. Richard Huganir of the Johns Hopkins University School of Medicine, Department of Neuroscience, for the generous donation of NR1 antibodies and helpful discussions of the work. We thank Jennifer Dziedzic, Michael Chang, Jason Sheppard, and Richard Cho for their technical assistance. All confocal images were taken at the Johns Hopkins School of Medicine Microscope Facility. We would like to thank Scott Kuo, Michael Delannoy, Barbara Smith, Carol Cooke, and Loza Lee for their assistance and expertise. This work was supported by NIEHS grant ES006189 to TRG and APN was funded by NIEHS T32ES07141. This work was submitted in partial fulfillment for the doctoral degree requirements for APN.
Footnotes
Publisher's Disclaimer: This is a PDF file of an unedited manuscript that has been accepted for publication. As a service to our customers we are providing this early version of the manuscript. The manuscript will undergo copyediting, typesetting, and review of the resulting proof before it is published in its final citable form. Please note that during the production process errors may be discovered which could affect the content, and all legal disclaimers that apply to the journal pertain.
Contributor Information
April P. Neal, Email: nealap@msu.edu.
Paul F. Worley, Email: pworley@jhmi.edu.
Tomás R. Guilarte, Email: tguilart@jhsph.edu.
References
- Alkondon M, Costa ACS, Radhakrishnan V, Aronstam RS, Albuquerque EX. Selective blockade of NMDA-activated channel currents may be implicated in learning deficits caused by lead. FEBS Lett. 1990;261:24–130. doi: 10.1016/0014-5793(90)80652-y. [DOI] [PubMed] [Google Scholar]
- Barria A, Malinow R. Subunit-specific NMDA receptor trafficking to synapses. Neuron. 2002;35:345–353. doi: 10.1016/s0896-6273(02)00776-6. [DOI] [PubMed] [Google Scholar]
- Chen C, Tonegawa S. Molecular genetic analysis of synaptic plasticity, activity-dependent neural development, learning, and memory in the mammalian brain. Annu Rev Neurosci. 1997;20:157–184. doi: 10.1146/annurev.neuro.20.1.157. [DOI] [PubMed] [Google Scholar]
- Chung HJ, Huang YH, Lau L, Huganir RL. Regulation of the NMDA Receptor Complex and Trafficking by Activity-Dependent Phosphorylation of the NR2B Subunit PDZ Ligand. J Neurosci. 2004;24:10248–10259. doi: 10.1523/JNEUROSCI.0546-04.2004. [DOI] [PMC free article] [PubMed] [Google Scholar]
- Cordova FM, Rodrigues LS, Giocomelli MBO, Oliveira CS, Posser T, Dunkley PR, Leal RB. Lead stimulates ERK1/2 and p38MAPK phosphorylation in the hippocampus of immature rats. Brain Res. 2004;998:65–72. doi: 10.1016/j.brainres.2003.11.012. [DOI] [PubMed] [Google Scholar]
- Durand GM, Gregor P, Zheng Z, Bennett MVL, Uhl GR, Zukin RS. Cloning of an apparent splice variant of the rat N-methyl-D-aspartate receptor NMDAR1 with altered sensitivity to polyamines and activators of protein kinase C. Proc Natl Acad Sci USA. 1992;89:9359–9363. doi: 10.1073/pnas.89.19.9359. [DOI] [PMC free article] [PubMed] [Google Scholar]
- Fletcher TL, De Camilli P, Banker G. Synaptogenesis in hippocampal cultures: Evidence indicating that axons and dendrites become competent to form synapses at different stages of neuronal development. J Neurosci. 1994;14:6695–6706. doi: 10.1523/JNEUROSCI.14-11-06695.1994. [DOI] [PMC free article] [PubMed] [Google Scholar]
- Gavazzo P, Zanardi I, Baranowska-Bosiacka I, Marchetti C. Molecular determinants of Pb2+ interaction with NMDA receptor channels. Neurochem Int. 2008;52:329–337. doi: 10.1016/j.neuint.2007.07.003. [DOI] [PubMed] [Google Scholar]
- Gilbert ME, Mack CM, Lasley SM. Chronic developmental lead exposure increases the threshold for long-term potentiation in rat dentate gyrus. Brain Res. 1996;736:118–24. doi: 10.1016/0006-8993(96)00665-8. [DOI] [PubMed] [Google Scholar]
- Guilarte TR, McGlothan JL. Hippocampal NMDA receptor mRNA undergoes subunit specific changes during developmental lead exposure. Brain Res. 1998;790:98–107. doi: 10.1016/s0006-8993(98)00054-7. [DOI] [PubMed] [Google Scholar]
- Guilarte TR, McGlothan JL. Selective decrease in NR1 subunit splice variant mRNA in the hippocampus of Pb2+-exposed rats: Implications for synaptic targeting and cell surface expression of NMDAR complexes. Brain Res Mol Brain Res. 2003;113:37–43. doi: 10.1016/s0169-328x(03)00083-4. [DOI] [PubMed] [Google Scholar]
- Guilarte TR, Miceli RC, Jett DA. Biochemical evidence of an interaction of lead at the zinc allosteric sites of the NDMA receptor complex: Effects of neuronal development. Neurotoxicology. 1995;16:63–71. [PubMed] [Google Scholar]
- Guilarte TR, Toscano CD, McGlothan JL, Weaver SA. Environmental enrichment reverses cognitive and molecular deficits induced by developmental lead exposure. Ann Neurol. 2003;53:50–56. doi: 10.1002/ana.10399. [DOI] [PubMed] [Google Scholar]
- Guilarte TR, Miceli RC, Jett DA. Neurochemical aspects of hippocampal and cortical Pb2+ neurotoxicity. Neurotoxicology. 1994;15:459–466. [PubMed] [Google Scholar]
- Hall RA, Soderling TR. Differential surface expression and phosphorylation of the N-methyl-D-aspartate receptor subunits NR1 and NR2 in cultured hippocampal neurons. J Biol Chem. 1997;272:4135–4140. doi: 10.1074/jbc.272.7.4135. [DOI] [PubMed] [Google Scholar]
- Hardingham GE, Fukunaga Y, Bading H. Extrasynaptic NMDARs oppose synaptic NMDARs by triggering CREB shut-off and cell death pathways. Nat Neurosci. 2002;5:405–414. doi: 10.1038/nn835. [DOI] [PubMed] [Google Scholar]
- Huh KH, Wenthold RJ. Turnover analysis of glutamate receptors identifies a rapidly degraded pool of the N-methyl-D-aspartate receptor subunit, NR1, in cultured cerebellar granule cells. J Biol Chem. 1999;274:151–157. doi: 10.1074/jbc.274.1.151. [DOI] [PubMed] [Google Scholar]
- Ishii T, Moriyoshi K, Sugihara H, Sakurada K, Kadotani H, Yokoi M, Akazawa C, Shigemoto R, Mizuno N, Masu M, Nakanishi S. Molecular characterization of the family of the N-methyl-D-aspartate receptor subunits. J Biol Chem. 1993;268:2836–2843. [PubMed] [Google Scholar]
- Ivanov A, Pellegrino C, Rama S, Dumalska I, Salyha Y, Ben-Ari Y, Medina I. Opposing role of synaptic and extrasynaptic NMDA receptors in regulation of the extracellular signal-regulated kinases (ERK) activity in cultured rat hippocampal neurons. J Physiol. 2006;572.3:789–798. doi: 10.1113/jphysiol.2006.105510. [DOI] [PMC free article] [PubMed] [Google Scholar]
- Kim MJ, Dunah AW, Wang YT, Sheng M. Differential roles of NR2A and NR2B containing NMDA receptors in ras-ERK signaling and AMPA receptor trafficking. Neuron. 2005;46:745–760. doi: 10.1016/j.neuron.2005.04.031. [DOI] [PubMed] [Google Scholar]
- Lee M, Yasuda R, Ehlers MD. Metaplasticity at single glutamatergic synapses. Neuron. 2010;66:859–570. doi: 10.1016/j.neuron.2010.05.015. [DOI] [PMC free article] [PubMed] [Google Scholar]
- Monaghan DT, Holets VR, Toy DW, Cotman CW. Anatomical distributions of four pharmacologically distinct 3H-L-glutamate binding sites. Nature. 1983;306:176–179. doi: 10.1038/306176a0. [DOI] [PubMed] [Google Scholar]
- Monyer H, Burnashev N, Laurie DJ, Sakmann B, Seeburg PH. Developmental and regional expression in the rat brain and functional properties of four NMDA receptors. Neuron. 1994;12:529–540. doi: 10.1016/0896-6273(94)90210-0. [DOI] [PubMed] [Google Scholar]
- Monyer H, Sprengel R, Schoepfer R, Herb A, Higuchi M, Lomeli H, Burnashev N, Sakmann B, Seebur PH. Heteromeric NMDA receptors: Molecular and functional distinction of subtypes. Science. 1992;256:1217–1221. doi: 10.1126/science.256.5060.1217. [DOI] [PubMed] [Google Scholar]
- Neal AP, Stansfield KH, Worley PF, Thompson RE, Guilarte TR. Lead exposure during synaptogenesis alters vesicular proteins and impairs vesicular release: Potential role of NMDA receptor-dependent BDNF signaling. Toxicol Sci. 2010;116:249–63. doi: 10.1093/toxsci/kfq111. [DOI] [PMC free article] [PubMed] [Google Scholar]
- Nihei MK, Desmond NL, McGlothan JL, Kuhlmann AC, Guilarte TR. N-methyl-D-aspartate receptor subunit changes are associated with lead-induced deficits of long-term potentiation and spatial learning. Neuroscience. 2000;99:233–242. doi: 10.1016/s0306-4522(00)00192-5. [DOI] [PubMed] [Google Scholar]
- Nihei MK, Guilarte TR. NMDAR-2A subunit protein expression is reduced in the hippocampus of rats exposed to Pb2+ during development. Brain Res Mol Brain Res. 1999;66:42–49. doi: 10.1016/s0169-328x(99)00005-4. [DOI] [PubMed] [Google Scholar]
- Omelchenko IA, Nelson CS, Allen CN. Lead inhibition of N-methyl-D-aspartate receptors containing NR2A, NR2C, and NR2D subunits. J Pharmacol Exp Ther. 1997;282:1458–1464. [PubMed] [Google Scholar]
- Omelchenko IA, Nelson CS, Marino JL, Allen CN. The sensitivity of N-methyl-D-aspartate receptors to lead inhibition is dependent on the receptor subunit composition. J Pharmacol Exp Ther. 1996;278:15–20. [PubMed] [Google Scholar]
- Paoletti P, Perin-Dureau F, Fayyazuddin A, Le Goff A, Callebaut I, Neyton J. Molecular organization of a zinc binding N-terminal modulatory domain in a NMDA receptor subunit. Neuron. 2000;28:911–925. doi: 10.1016/s0896-6273(00)00163-x. [DOI] [PubMed] [Google Scholar]
- Pauly T, Schlicksupp A, Neugebauer R, Kuhse J. Synaptic targeting of N-methyl-D-aspartate receptor splice variants is regulated differentially by receptor activity. Neuroscience. 2005;131:99–111. doi: 10.1016/j.neuroscience.2004.10.039. [DOI] [PubMed] [Google Scholar]
- Pérez-Otaño I, Ehlers MD. Homeostatic plasticity and NMDA receptor trafficking. Trends Neurosci. 2005;28:229–238. doi: 10.1016/j.tins.2005.03.004. [DOI] [PubMed] [Google Scholar]
- Quinlan EM, Lebel D, Brosh I, Barkai E. A molecular mechanism for stabilization of learning- induced synaptic modifications. Neuron. 2004;41:185–192. doi: 10.1016/s0896-6273(03)00874-2. [DOI] [PubMed] [Google Scholar]
- Rachline J, Perin-Dureau F, Le Goff A, Neyton J, Paoletti P. The micromolar zinc-binding domain on the NMDA receptor subunit NR2B. J Neurosci. 2005;25:308–317. doi: 10.1523/JNEUROSCI.3967-04.2005. [DOI] [PMC free article] [PubMed] [Google Scholar]
- Ruan D, Chen J, Zhao C, Xu Y, Wang M, Zhao W. Impairment of long-term potentiation and paired-pulse facilitation in rat hippocampal dentate gyrus following developmental lead exposure in vivo. Brain Res. 1998;806:196–201. doi: 10.1016/s0006-8993(98)00739-2. [DOI] [PubMed] [Google Scholar]
- Soriano FX, Martel M, Papadia S, Vaslin A, Baxter P, Rickman C, Forder J, Tymianski M, Duncan R, Aarts M, Clarke PGH, Wyllie DJA, Hardingham GE. Specific targeting of pro-death NMDA receptor signals with differing reliance on the NR2B PDZ ligand. J Neurosci. 2008;28:10696–10710. doi: 10.1523/JNEUROSCI.1207-08.2008. [DOI] [PMC free article] [PubMed] [Google Scholar]
- Toscano CD, Guilarte TR. Lead neurotoxicity: From exposure to molecular effects. Brain Res Rev. 2005;49:529–524. doi: 10.1016/j.brainresrev.2005.02.004. [DOI] [PubMed] [Google Scholar]
- Toscano CD, Hashemzadeh-Gargari H, McGlothan JL, Guilarte TR. Developmental Pb2+ exposure alters NMDAR subtypes and reduces CREB phosphorylation in the rat brain. Brain Res Dev Brain Res. 2002;139:217–226. doi: 10.1016/s0165-3806(02)00569-2. [DOI] [PubMed] [Google Scholar]
- Toscano CD, McGlothan JL, Guilarte TR. Lead exposure alters cyclic-AMP response element binding protein phosphorylation and binding activity in the developing rat brain. Brain Res Dev Brain Res. 2003;145:219–228. doi: 10.1016/j.devbrainres.2003.08.004. [DOI] [PubMed] [Google Scholar]
- Toscano CD, O’Callaghan JP, Guilarte TR. Calcium/calmodulin-dependent protein kinase II activity and expression are altered in the hippocampus of Pb2+-exposed rats. Brain Res. 2005;1044:51–8. doi: 10.1016/j.brainres.2005.02.076. [DOI] [PubMed] [Google Scholar]
- Tovar K, Westbrook GL. The incorporation of NMDA receptors with a distinct subunit composition at nascent hippocampal synapses in vitro. J Neurosci. 1999;19:4180–4188. doi: 10.1523/JNEUROSCI.19-10-04180.1999. [DOI] [PMC free article] [PubMed] [Google Scholar]
- Tsien JZ, Huerta PT, Tonegawa S. The essential role of hippocampal CA1 NMDA receptor- dependent synaptic plasticity in spatial memory. Cell. 1996;87:1327–1338. doi: 10.1016/s0092-8674(00)81827-9. [DOI] [PubMed] [Google Scholar]
- Ujihara H, Albuquerque EX. Developmental change of the inhibition by lead of NMDA-activated currents in cultured hippocampal neurons. J Pharmacol Exp Ther. 1992;263:868–875. [PubMed] [Google Scholar]
- Vanhoutte P, Bading H. Opposing roles of synaptic and extrasynaptic NMDA receptors in neuronal calcium signalling and BDNF gene regulation. Curr Opin Neurobiol. 2003;13:366–371. doi: 10.1016/s0959-4388(03)00073-4. [DOI] [PubMed] [Google Scholar]
- Zhang X, Liu A, Ruan D, Liu J. Effect of developmental lead exposure on the expression of specific NMDA receptor subunit mRNAs in the hippocampus of neonatal rats by digoxigenin-labeled in situ hybridization histochemistry. Neurotoxicol Teratol. 2002;24:149–160. doi: 10.1016/s0892-0362(01)00210-0. [DOI] [PubMed] [Google Scholar]
- Zukin RS, Bennett MVL. Alternatively spliced isoforms of the NMDAR1 receptor subunit. Trends Neurosci. 1995;18:306–313. doi: 10.1016/0166-2236(95)93920-s. [DOI] [PubMed] [Google Scholar]