

Summary
Oxidative phosphorylation (OXPHOS) and glycolysis are the two main pathways that control energy metabolism of a cell. The Warburg effect, in which glycolysis remains active even under aerobic conditions, is considered a key driver for cancer cell proliferation, malignancy, metastasis and therapeutic resistance. To target aerobic glycolysis, we exploited the complementary roles of OXPHOS and glycolysis in ATP synthesis as the basis for a chemical genetic screen, enabling rapid identification of novel small-molecule inhibitors of facilitative glucose transport. Blocking mitochondrial electron transport with antimycin A or leucascandrolide A had little effect on highly glycolytic A549 lung carcinoma cells, but adding known glycolytic inhibitors 2-deoxy-D-glucose, iodoacetate or cytochalasin B, rapidly depleted intracellular ATP, displaying chemical synthetic lethality. Based on this principle, we exposed antimycin A-treated A549 cells to a newly synthesized 955-member diverse scaffold small-molecule library, screening for compounds that rapidly depleted ATP levels. Two compounds potently suppressed ATP synthesis, induced G1 cell-cycle arrest and inhibited lactate production. Pathway analysis revealed that these novel probes inhibited GLUT family of facilitative transmembrane transporters but, unlike cytochalasin B, had no effect on the actin cytoskeleton. Our work illustrated the utility of a pairwise chemical genetic screen for discovery of novel chemical probes, which would be useful not only to study the system-level organization of energy metabolism but could also facilitate development of drugs targeting upregulation of aerobic glycolysis in cancer.
In chemical genetics, small-molecule probes rather than mutations are used to modulate cellular phenotypes, thereby offering access to biological insights that may not be obtained by conventional genetics (Stockwell, 2000; Lehar et al., 2008). Most recently, the advent of high-throughput screening has accelerated chemical probe discovery (Bredel and Jacoby, 2004). However, while significant progress toward identification of compounds perturbing many key pathways has been made, developing highly specific chemical probes remains challenging. A particularly powerful approach has been to exploit synthetic lethality, where a defined genetic defect sensitizes the cell to small molecules that target compensatory pathways (Hartwell et al., 1997). By analogy with classical genetic analysis of interacting genes, only via combining the mutation with the proper small molecule can one observe the phenotype, as either perturbation alone is insufficient (Tong et al., 2001; 2004). This approach is limited, however, by the availability of mutant cell lines and RNAi may not offer a satisfactory alternative. Alternatively, a chemical probe can substitute for the mutation, and the compensatory response of the system might then be targeted by a second small molecule, which can be selected from a chemical library. Here, the pairwise chemical perturbation can result in a unique phenotype and enable the discovery of new chemical probes. Particularly where prior genetic analysis has identified the compensatory cellular pathway, linking the small molecules to their targets is highly feasible.
Oxidative phosphorylation (OXPHOS) and glycolysis are the two main pathways that control energy metabolism in the cell. The interdependence of the two metabolic pathways has been known since Pasteur's pioneering work, which demonstrated that yeast consumed more glucose anaerobically than aerobically (Racker, 1974). Recent systematic analysis of all single and double knockouts of 890 metabolic genes in Saccharomyces cerevisiae demonstrated that genetic perturbations of OXPHOS aggravated disruption of glycolysis, because either fermentation or respiratory function were needed for ATP synthesis. (Segrè et al, 2005). Pairwise chemical perturbation of OXPHOS and glycolysis has also been explored in human cancer cell lines. The combination of small-molecule inhibitors of mitochondrial electron transport chain and glucose catabolism synergistically suppressed ATP production and impaired cellular viability (Ulanovskaya et al., 2008; Liu, et al. 2001). However, the ability to carry out chemical genetic studies of energy metabolism is currently limited by the availability of potent, specific and stable chemical inhibitors of glycolysis (Pelicano et al., 2006). Such compounds would be useful not only to study the systems-level organization of metabolism in real time, but could also open new directions for discovery of drugs targeting the upregulation of aerobic glycolysis in cancer discovered by Warburg (Warburg, 1956; Vander Heiden et al, 2009; Tennant et al., 2010; Gatenby and Gillies, 2004; DeBerardinis et al., 2008; Gohil et al., 2010).
Here we exploited dual contribution of the two main energy-producing cellular pathways to production of ATP for the development of a practical chemical genetic screen, which enabled rapid identification of new small-molecule inhibitors of facilitative glucose transport. This approach was based on the initial suppression of OXPHOS in A549 cells with a potent and specific small-molecule inhibitor of complex III. This treatment alone did not result in any observable defects in cellular viability or ATP production within the first 30 min of drug incubation. Subsequently, a second chemical perturbation of the system with a small-molecule inhibitor of glycolysis or glucose transport resulted in synergistic, rapid depletion of intracellular ATP levels. Having validated this synthetic effect using a series of known inhibitors, we subjected antimycin A-treated A549 cells to a newly synthesized 955-member small-molecule library and measured effects of each library member on ATP production. The screen identified two new compounds that potently suppressed ATP synthesis only in the presence of a mitochondrial inhibitor, induced G1 cell-cycle arrest and inhibited lactate production, which is highly indicative of blocking glycolytic pathway. We further demonstrated that the two newly identified chemical agents potently inhibited glucose cellular uptake, which is mediated by the GLUT family of facilitative transmembrane transporters. Our investigation demonstrated the utility of a pairwise chemical genetic screen for the discovery of novel chemical probes, and identified two previously unknown chemotypes that enable effective suppression of facilitative glucose transport in mammalian cells.
Results
Synergistic suppression of ATP synthesis
Glycolysis is a series of metabolic reactions that convert each glucose to two pyruvic acids and two equivalents of ATP (Figure 1a). OXPHOS produces up to 36 additional equivalents of ATP by coupling reduction of molecular oxygen to oxidation of NADH and FADH2. We have previously observed (Ulanovskaya, et al. 2008) that combining small-molecule inhibitors of OXPHOS and glycolysis resulted in rapid depletion of cellular ATP while the action of a mitochondrial inhibitor alone did not substantially impact the ATP level under the same conditions (Figure S1). Based on this observation, we profiled several pairwise combinations of known small-molecule inhibitors of OXPHOS and glycolysis to establish the generality of synthetic suppression of ATP production in mammalian cells.
Figure 1.
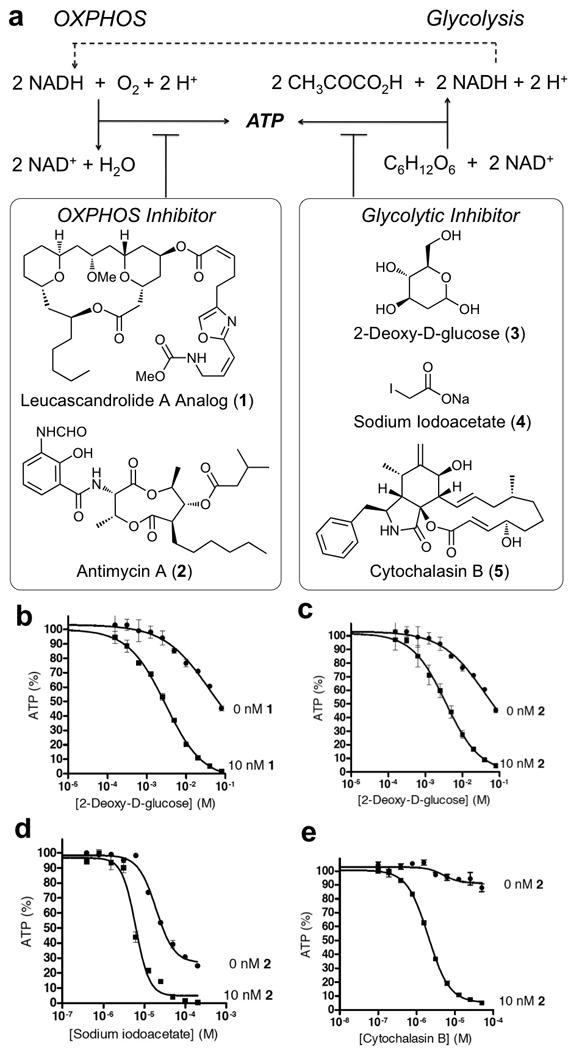
Synergistic suppression of ATP synthesis. (a) Schematic representation of the contribution of OXPHOS and glycolysis to ATP production and structures of known small-molecule inhibitors of the two energy-producing pathways, including a synthetic analog of leucascandrolide A (1), antimycin A (2), 2-deoxy-D-glucose (3), sodium iodoacetate (4) and cytochalasin B (5). (b) Suppression of ATP synthesis by 3 in the absence and presence of 1. (c) Supression of ATP synthesis by 3 in the absence and presence of 2. (d) Supression of ATP synthesis by 4 in the absence and presence of 2. (e) Supression of ATP synthesis by 5 in the absence and presence of 2. All values are presented as % of vehicle treated sample. Each value is mean ± SEM of duplicate values from a representative experiment. This figure is supported by Supplementary Figure S1.
2-Deoxy-D-glucose (3) is an established inhibitor of glycolysis that acts by blocking the activity of phosphoglucose isomerase following its initial phosphorylation by hexokinase (Brown, 1962). Treatment of A549 cells with variable concentrations of 3 resulted in partial suppression of ATP levels (Figure 1b) within the first 30 min of incubation with the drug. This effect was substantially enhanced (Figures 1b and 1c) in the presence of a chemical inhibitor of complex III – either the synthetic analog of leucascandrolide A (1) developed in our laboratory (Ulanovskaya, et al. 2008) or antimycin A (2) (Ohnishi, and Trumpower, 1980). Similarly, a more effective suppression of ATP synthesis was observed using a combination of antimycin A and sodium iodoacetate (4) (Figure 1d), which irreversibly inhibits glyceroaldehydephosphate dehydrogenase (Sabri and Ochs, 1971). The most pronounced effect on synergistic suppression of ATP synthesis was observed in the case of cytochalasin B (5), a known inhibitor of facilitative glucose transport (Deves and Krupka, 1978). While treatment of A549 cells with 5 did not substantially impact the ATP level within the first 30 min of incubation, the addition of a mitochondrial inhibitor 2 resulted in highly effective blockage of ATP synthesis at low concentrations of both 2 and 5 (Figure 1e).
These results confirmed that inhibition of mitochondrial respiration could enhance the suppression of ATP synthesis by glycolytic inhibitors independently of their mechanism of action. The detailed pattern of ATP suppression, however, appeared to be uniquely associated with a specific mode of action of each glycolytic inhibitor tested, providing a unique phenotypic readout for each compound. These data establish the potential for discovery of new glycolytic inhibitors by screening chemical libraries for small molecules that would act in concert with a mitochondrial inhibitor to block ATP synthesis, as well as identification of their cellular targets within the glycolytic pathway by examining the pattern of inhibition for each agent.
Chemical library synthesis
High-throughput organic synthesis enables construction of biogenic, structurally diverse small-molecule libraries for broad biological screening (Tan, 2005). We selected a five-membered pyrrolidinone subunit as a structural element for rapid introduction of molecular diversity due to the prevalence of this chemotype in various biologically active compounds, i.e. doxapram and lactacystin (Yost, 2006; Omura et al., 1991). Selection of such bioactive privileged structures for library design is attractive to yield collections of compounds with favorable physicochemical properties in order to enable new lead discovery (Cui et al., 2010; Lee et al., 2010). The tandem reaction sequence for library synthesis entailed intermolecular Michael addition of vinylogous amides III to a cyclic anhydride (Figure 2), followed by intramolecular amidation to give highly substituted five-membered lactams IV, which could be further diversified by activation of carboxylic acid and coupling with amines V en route to the target small-molecule library VI. The use of cyclic vinylogous amides III with varied connectivity between R1 and R2 groups would result in scaffold diversification and production of the final library with the increased level of structural diversity.
Figure 2.
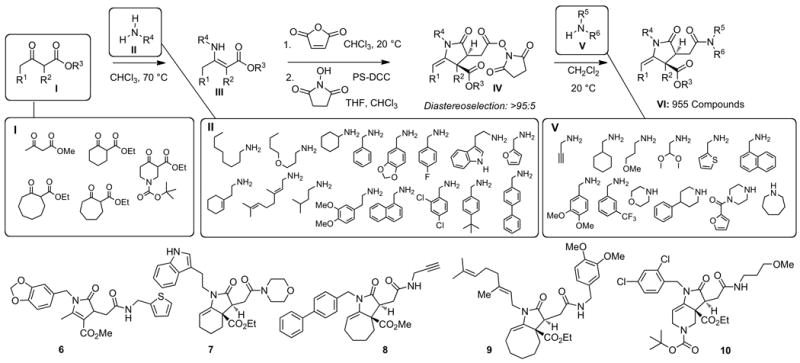
Synthesis of 955-member chemical library. The assembly process entailed a four-step synthetic sequence shown using 5 ketoesters I, 16 amines II, which were employed during the first diversification step, and 12 secondary amines V, which were used for the final amidation. For each 96-compound set, 12 randomly selected compounds were analyzed by 500 MHz 1H NMR to determine chemical purity and yield as described in Methods. Also shown are the structures of five representative library members 6-10, which were randomly selected and fully characterized by 1H NMR, 13C NMR and MS. This figure is supported by Supplementary Figure S2.
The assembly process began with condensation of 5 ketoesters I with 16 primary amines II, which readily occurred at 70 °C in CHCl3 and afforded the desired 80 vinylogous amides III in 60-90% yield after chromatographic purification (Figure 2). Construction of pyrrolidinones was achieved by treatment of vinylogous amides III with maleic anhydride (Cavé et al., 1997) in CHCl3 at 20 °C, followed by conversion of the resulting carboxylic acids into the corresponding N-hydroxysuccinimide esters IV using resin-bound carbodiimide to facilitate chromatographic purification of activated esters. Each of the esters IV was produced as a single diasteromer. The relative stereochemical relationship of the newly created stereogenic centers was verified by X-ray crystallography. The final stage of the synthesis entailed condensation of 12 amines V with 80 activated esters IV. The resulting library VI was prepared in solution on 2.5 μmol scale (1.0-1.5 mg of final products) and was rapidly purified by parallel preparative thin layer chromatography. Chromatographic analysis of all final compounds (see Supplementary Methods) established that 955 out of 960 compounds were produced successfully. In addition, NMR spectroscopy was employed to validate high chemical purity and quantify chemical yields of 120 randomly selected library members. Structures of five fully characterized library members 6-10 (Figure 2) are representative of the notable skeletal diversity, which was enabled by the selection of our unique synthetic strategy. Favorable physicochemical properties of all newly produced compounds were further confirmed by desired molecular weight and lipophilicty distributions (Figure S2).
Pairwise high-throughput chemical genetic screen
In order to identify new inhibitors of glycolysis, we subjected antimycin A-treated A549 cells to each member of the 955-member small-molecule library and measured the effects of each compound on ATP production after 30 min of drug incubation. We anticipated that synergistic suppression of ATP synthesis under such conditions could be achieved only by compounds that inhibited either glucose metabolism or its transport into the cells. The primary screen was performed with 10 nM concentration of antimycin A and a 20 μM average concentration of each individual library member. In order to identify the most potent small molecules, the initial set of active compounds was subjected for a follow-up dose-dependent analysis of suppression of ATP synthesis in the presence and absence of antimycin A. Structures of the two most potent compounds 11 and 12 are shown in Figure 3a, b. Each was resynthesized on preparative scale, purified by conventional silica gel chromatography and subjected to a series of detailed cell-based and biochemical studies. Initial structure-activity analysis (Figures S3a,b) revealed that the naphthyl moiety in 11 and 12 can be replaced with other aromatic groups without a substantial decrease in activity. However, replacement of the N-acyl piperazine with other groups in 11 could not be tolerated. Similarly, the dimethoxyphenylethyl subunit proved to be uniquely responsible for the activity of 12 within the initial collection of compounds tested.
Figure 3.
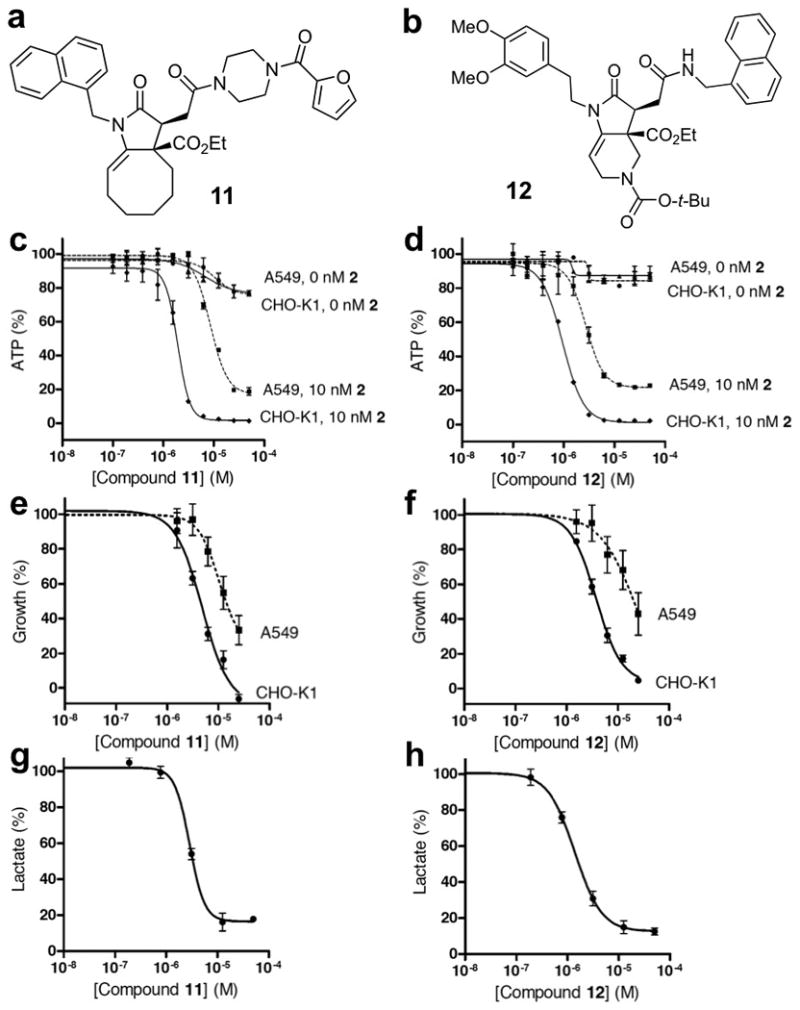
Effects of 11 and 12 on ATP synthesis, cell proliferation and lactate production. (a) Chemical structure of 11. (b) Chemical structure of 12. (c) Inhibition of intracellular ATP production upon treatment of A549 and CHO-K1 cells with 11 in the presence or absence of 10 nM antimycin A. (d) Inhibition of intracellular ATP production upon treatment of A549 and CHO-K1 cells with 12 in the presence or absence of 10 nM antimycin A. (e) Effect of 11 on growth of A549 and CHO-K1 cells. (f) Effect of 12 on growth of A549 and CHO-K1 cells. (g) Inhibition of lactate production in CHO-K1 cells upon treatment with 11. (h) Inhibition of lactate production in CHO-K1 cells upon treatment with 12. All values are presented as % of vehicle treated sample. Each value is mean ± SEM of duplicate values from a representative experiment. This figure is supported by Supplementary Figure S3.
Suppression of ATP synthesis, cell growth and lactate production
Dose-dependent inhibition of ATP production by 11 and 12 was next evaluated in several mammalian cell lines in the absence and presence of a mitochondrial inhibitor, such as antimycin A. We found that each of the two compounds did not substantially alter the level of ATP in A549 cells with normal mitochondrial activity. However, in the presence of antimycin A, the amount of ATP was depleted in A549 cells within 30 min of incubation with 11 or 12 with IC50 of 10 μM and 3 μM, respectively (Figures 3c, d). Notably, ATP levels in Chinese hamster ovary cells (CHO-K1) were highly sensitive to both compounds 11 and 12 with IC50 values of 2 μM and 1 μM, respectively (Figures 3c, d). The same profile of synergistic ATP suppression was observed in PC3 (prostate) and U373 (glioma) cell lines (Figure S3c-f). In addition, the synergistic effect of compounds 11 and 12 on suppression of ATP synthesis in the presence of antimycin A was similar to that observed by replacing glucose with pyruvate (Figure S3g). Importantly, the ATP suppression activity patterns elicited by 11 and 12 were almost identical to that observed for cytochalasin B (5) including both recapitulating the negligible effect on ATP production under normal respiration in A549 (Figure 1e), as well as the enhanced sensitivity of CHO-K1 to 5 (Figure S3h). These results suggested that the two newly identified compounds might similarly act by inhibiting glucose uptake into mammalian cells. Considering the supersensitivity of CHO-K1 cells to 11 and 12 and its history of use as an in vitro model for investigation of facilitative glucose transport (Faik et al, 1989), we selected this cell line for further study.
We next examined the effects of 11 and 12 on cell growth and viability. As expected for inhibitors of energy metabolism, both compounds inhibited growth of A549 and CHO-K1 cell lines (Figures 3e, f). The potency of 11 and 12 in growth inhibitory assays and cell-line sensitivity correlated well with the initially observed effects of the two compounds on ATP synthesis. Furthermore, the effects of 11 and 12 on cell viability appeared to be cytostatic at a range of concentrations tested. We also evaluated the effect of the two compounds on cell cycle regulation. Treatment of A549 cells with 11 or 12 for 24 h resulted in a notable increase in G1 subpopulation to 71% and 73%, respectively, compared to 62% of the G1 peak in the negative control (Figure S3k). This result was again in agreement with the impairment of energy metabolism in cells exposed to 11 or 12.
The level of excreted lactate provides a validated measure of the efficiency of glycolytic flux of mammalian cells. Indeed, efficient inhibition of lactate production was observed in CHO-K1 cells treated for 4 h (Eichner et al, 2010) with either 2-deoxy-D-glucose or cytochalasin B compared to negative controls using either DMSO or dihydrocytochalasin B (Figure S3i). Subjecting CHO-K1 cells to either 11 or 12 under the same conditions resulted in dose-dependent inhibition of cellular lactate production with IC50 values of 3 μM and 1.5 μM, respectively (Figures 3g, h). Similar effect was observed in PC3 cells (Figure S3j).
Inhibition of facilitative glucose transport
The similarity of the ATP suppression patterns of 11 and 12 to that observed for cytochalasin B (5) in two representative cell lines, as well as the absence of major glycolytic metabolites observed upon treatment of cells with 11 or 12 strongly suggested that the two compounds elicited their activities by blocking transport of glucose into the cells. Expression of the GLUT1 facilitative glucose transporter in A549 and CHO-K1 cell lines was verified by Western blot (Figure S3l). Direct drug action on mammalian glucose transporters was measured by monitoring rapid uptake of 3H-labeled 3-O-methylglucose, a radiotracer that is efficiently taken up via glucose transporters but not metabolized further, allowing the assessment of initial rate of sugar uptake. Under such conditions, 11 inhibited uptake of this labeled glucose analog by 50% at concentration of 2 μM (Figure 4a). The uptake of 3H-labeled 2-deoxy-D-glucose, a glucose analog that can be phosphorylated by hexokinase, was blocked by 11 with similar potency (Figure 4b). Similar effects were observed in highly sensitive U373 glioma cell line (Figure S4a)
Figure 4.
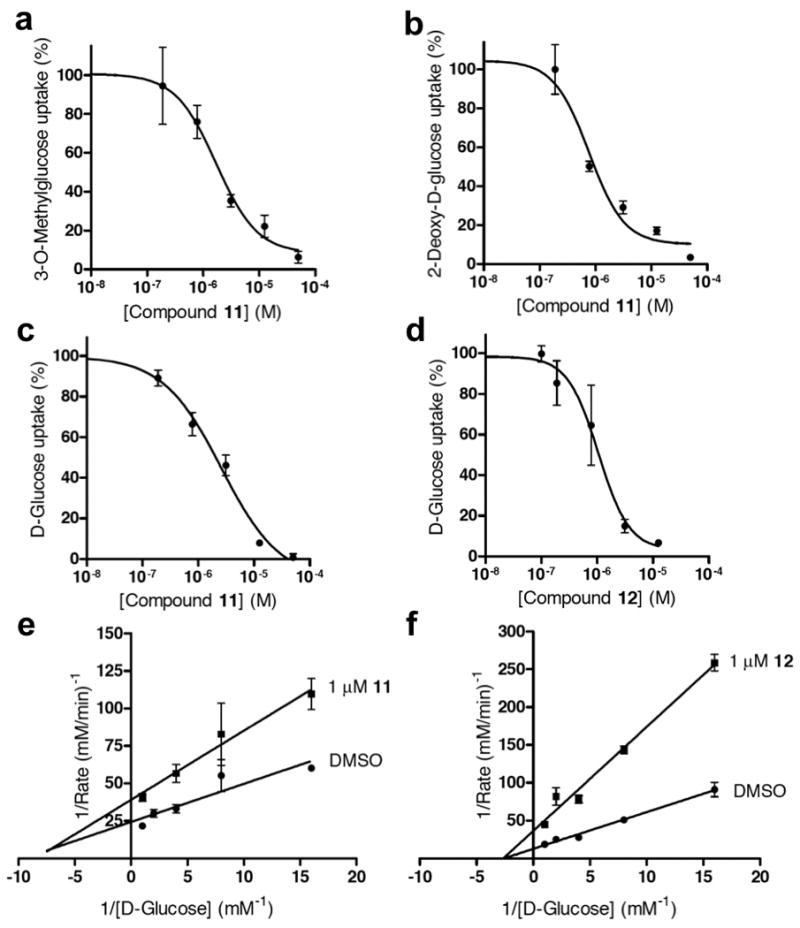
Inhibition of glucose transport by 11 and 12. (a) Inhibition of 3-O-methylglucose uptake in CHO-K1 cells by 11. (b) Inhibition of 2-deoxy-D-glucose uptake in CHO-K1 cells by 11. (c) Inhibition of D-glucose uptake in erythrocyte ghosts by 11. (d) Inhibition of D-glucose uptake in erythrocyte ghosts by 12. (e) Kinetics of the inhibition of D-glucose uptake in erythrocyte membranes by 11. Kinetic parameters: Vm = 0.052 ± 0.004 mM/min, Km = 0.19 ± 0.04 mM, Vm(app) = 0.028 ± 0.002 mM/min, Km(app) = 0.14 ± 0.03 mM. (f) Kinetics of the inhibition of D-glucose uptake in erythrocyte membranes by 12. Kinetic parameters: Vm = 0.068 ± 0.005 mM/min, Km = 0.28 ± 0.05 mM, Vm(app) = 0.030 ± 0.005 mM/min, Km(app) = 0.45 ± 0.16 mM. This figure is supported by Supplementary Figure S4.
We next evaluated the effects of 11 and 12 on uptake of D-glucose in purified sealed erythrocyte membranes (Figures 4c,d), which exclusively express GLUT1 (Carruthers et al., 2009). We employed cytochalasin B (5), a non-competitive inhibitor of glucose uptake (Deves and Krupka, 1978), and genistein, a competitive inhibitor of glucose uptake (Vera et al., 1996), as positive controls. Each elicited the expected potencies and kinetic profiles (Figure S4b,c). The effects of 11 and 12 on facilitative glucose transport by the erythrocyte membranes were consistent with a non-competitive mode of inhibition with Ki values of 1.2 μM and 0.8 μM, respectively (Figures 4e,f).
Cytochalasin B (5) is known to depolymerize F-actin (Bonder and Mooseker, 1986) at concentrations similar to those used to inhibit glucose transport (Figure S14). While this compound has been used extensively for biochemical characterization of glucose transport, the existence of alternative cellular targets of cytochalasin B substantially limits its applications of this agent in cell-based and in vivo studies of glucose transport. We examined depolymerization of the actin cytoskeleton in A549 cells and found that neither 11 nor 12 altered F-actin distribution even at the highest concentrations tested (Figure S4d-g). While other off-target effects of 11 and 12 cannot be ruled out at this point, the absence of cytoskeletal effects of the two compounds uniquely distinguishes them from cytochalasin-based inhibitors of facilitative glucose transport.
Discussion
Glucose is an essential metabolic energy source for all living organisms and a structural precursor for cellular biosynthesis of proteins, lipids and nucleic acids. A common feature of cancer cells is a dramatic increase in glucose uptake associated with the Warburg effect, providing a basis tumor imaging based on the accumulation of the PET tracer 18fluorodeoxyglucose by many tumors (Gambhir, 2004). Most vertebrate cells must transport glucose across the cell membrane, which is mediated by active and passive glucose transporters. While active glucose transport is sodium-dependent and relies on an electrochemical gradient, passive glucose transport is controlled by facilitative glucose transporters (GLUTs), which respond to the gradient of glucose concentration across the cell membrane (Manolescu et al., 2007). Among thirteen members of the mammalian GLUT family, individual isoforms are characterized by their unique tissue distributions and distinct affinities for various substrates that they transport. In addition to variable capacity to transport of D-pentoses and D-hexoses, GLUTs have also been shown to transport the oxidized form of vitamin C, dehydroascorbic acid (Vera et al., 1993).
Overexpression of glucose transporters and other glycolytic enzymes is one of the key alterations associated with the high glycolytic rate of malignant cells. GLUT1 is particularly highly expressed in several cancers including breast, brain, renal, colon, ovarian and cervical carcinoma (Yamamoto et al., 1990; Nishioka et al., 1992; Brown and Wahl, 1993; Haber, et al., 1998; Cantuaria et al., 2001; Rudlowski et al., 2003). Several studies have demonstrated a link between GLUT1 expression and chemoresistance, tumor aggressiveness, and poor survival (Hatanaka, 1974; Evans et al., 2008). Therefore, inhibition of GLUT1 function may be a promising therapeutic strategy for sensitization of highly glycolytic cancer cells to chemotherapeutic agents and for direct targeting of cancer cells. However, progress has remained limited by the currently available small-molecule inhibitors, which lack potency and/or exhibit substantial off-target effects. Thus, there is a significant need for the development of new inhibitors of glucose transport that can potently modulate this process in vitro and in vivo.
We have described a practical and general strategy for discovery of new inhibitors of glycolysis and glucose transport, which can be rapidly identified by their ability to deplete cellular ATP in cells with suppressed mitochondrial function. This pathway-based screen was designed to target multiple proteins involved in cellular glucose consumption and metabolism. Having initially validated the synthetic suppression of ATP synthesis by a combination of small-molecule inhibitors of OXPHOS and glycolysis or glucose transport, we screened a newly constructed diverse chemical library for small molecules that would act in concert with antimycin A to suppress cellular ATP production. This effort resulted in identification of two chemotypes 11 and 12 that potently inhibited ATP synthesis in A549 cells with chemically suppressed mitochondrial function. As expected, inhibition of lactate production by the two newly identified compounds was highly indicative of substantial reduction of glycolytic flux. The pattern of ATP synthesis suppression and differential cellular sensitivity strongly suggested that 11 and 12 blocked glucose transport in mammalian cell lines. Detailed examination of this effect revealed that both compounds inhibited uptake of 3-O-methylglucose and 2-deoxy-D-glucose in CHO-K1 cells. Furthermore, 11 and 12 suppressed uptake of labeled D-glucose in sealed erythrocyte membranes. The kinetic studies suggested a noncompetive inhibition of facilitative glucose transport through erythrocyte membranes with low micromolar inhibitory constants. Such potent inhibition of facilitative glucose transport was fully consistent with the ability of 11 and 12 to synthetically suppress ATP production, reduce glycolytic flux and inhibit mammalian cell growth at similarly low concentrations. It is noteworthy that the two newly identified chemotypes do not share significant structural similarity with known inhibitors of cellular glucose transport and can be efficiently accessed by short, efficient and fully diastereoselective synthetic sequences. This new class of glucose transport inhibitors provides a foundation for subsequent development of highly potent compounds that can modulate cellular glucose uptake in a selective manner, as might be necessary to target aerobic glycolysis in cancer.
Experimental Section
Chemical Library Synthesis
The following procedure represents the synthesis of the first set of 96 compounds. Eight 1.5 ml polypropylene centrifuge tubes were charged with CHCl3 (0.8 ml each), methyl acetoacetate (0.5 mmol each) and treated individually with eight primary amines (II, 0.5 mmol) at 70 °C in a sand bath. The vinylogous amides III were purified by preparative TLC (ethyl acetate: hexanes = 1:5 to 1:1), dissolved in CHCl3 (0.8 ml) and treated with maleic anhydride (0.3-0.5 mmol) at 20 °C. Upon completion of each reaction, the mixtures were diluted with CHCl3 (1.6 ml) and THF (4.8 ml), followed by treatment with N-hydroxysuccinimide (0.38-0.63 mmol) and PS-carbodiimide resin (1.1 mmol/g, 345-573 mg). The reaction mixtures were stirred for 2-4 h at 20 °C, filtered, concentrated and purified by preparative TLC (ethyl acetate: hexanes = 2:1) to give the eight corresponding succinimide esters IV, which were diluted with CH2Cl2 to final concentrations of 0.1 M. Aliquots (25 μl) of each resulting stock solutions were transferred into a polypropylene 96-well PCR plate and treated with 12 amines V (4 μmol per well) and CH2Cl2 (30 μl per well) using the plate maps shown in Supplementary Methods. Upon completion, the reaction mixtures were transferred onto preparative TLC plates using a multichannel pipettor with adjustable gaps. The plates were developed in ethyl acetate/hexanes (3:2). The products VI were detected under UV light and removed from TLC plates as circular silica gel pellets. Each compound was eluted from silica gel with ethyl acetate (0.6 ml). Following removal of the solvent in vacuo, 12 randomly selected compounds were dissolved in CD3OD (0.5 ml) and analyzed by 1H NMR. The amount of material in each sample was determined by integration using residual MeOH as a precalibrated internal standard. This protocol was used next to prepare all the remaining library members.
Cell culture
A549, CHO-K1, PC3, U373 and U87 cell lines were purchased from ATCC and were maintained in either F12-K or DMEM medium supplemented with 10% FBS and 1% Penicillin-Streptomycin-Glutamine solution.
Quantification of cellular ATP levels
Cells were seeded in 96-well plates at a density of 2,500 cells/well. The next day, cells were treated with either medium or medium containing antymicin A (final concentration = 10 nM) followed immediately by addition of graded concentrations of small molecules and incubated for 30 min. The ATPlite assay kit (PerkinElmer) was used to measure ATP levels. All assays were performed using two replicate wells for each small-molecule concentration tested.
High-throughput library screen
The effects of small molecules on ATP levels in A549 cells in the presence of 10 nM antimycin A were measured as described above. Each compound was tested at a single concentration of 20 μM. Concentration of DMSO did not exceed 1% of the total assay volume.
Cellular growth inhibition
Cells were seeded in 6-well plates at a density of 100,000 cells/well and were allowed to attach to plate surface. Then cells were washed with PBS and treated with fresh medium containing graded concentrations of small molecules. After 48 h of incubation, cells were trypsinized, stained with trypan blue and counted using Countess™ automated cell counter from Invitrogen. All assays were performed using two replicate wells for each small molecule concentration test.
Lactate production
CHO-K1 or PC3 cells were seeded in 6-well plates at a concentration of 400,000 cells/well and incubated overnight. Old medium was removed; cells were washed with PBS, and then treated with 1 ml of medium containing different concentrations of compounds. After 4 h of incubation, an aliquot of the cell culture medium was removed from each well and kept at -80 °C until processed. The amount of lactate excreted into the cell culture medium was measured using the Lactate assay kit from Biovision. All samples were done in duplicate.
Cellular uptake of radiolabeled glucose analogs
2 × 10⁶ CHO-K1 cells were washed in PBS and incubated for 15 min at 37°C in glucose uptake buffer (8.1 mM Na2HPO4, 1.4 mM KH2PO4, 0.5 mM MgCl2, 2.6 mM KCl, 136 mM NaCl, and 0.9 mM CaCl2, pH 7.4). Twenty-five microliters of a 20% perchloric acid/8% sucrose solution was added to the bottom of a 0.5-ml microfuge tube. 1-Bromododecane (200 μl) was overlaid above the perchloric acid/sucrose solution. Fifty microliters of tritiated sugar (25 μCi/ml) was overlaid above the 1-bromododecane layer. After the 37°C incubation, 100 μl of cells were added to the sugar layer and pulsed with 3-O-methylglucose and 2-deoxy-D-glucose for 30 s and 120 s, respectively. The reaction was stopped by centrifugation at 14,000 rpm for 10 min. Tubes were then snap-frozen in an ethanol/dry ice bath. The tips of the tubes were cut just above the perchloric acid/sucrose/bromododecane interface and transferred into scintillation vials containing 100 μl of 1% Triton X-100. Optiphase Supermix (PerkinElmer) was added to each vial and counted using an LS6500 scintillation counter (Beckman Coulter). Each sample was measured in triplicate. Non-specific uptake was assessed by treatment of cells with 5-50 μM cytochalasin B and was excluded from all samples. All values are presented as % of vehicle treated sample. Each value is mean ± SEM of at least duplicate values from a representative experiment.
Isolation of pink ghosts from red blood cells
Outdated red cells were obtained from blood bank. Cells were washed once in KCl buffer (10 mM Tris-HCl, 150 mM KCl, 5 mM MgCl2, 4 mM EGTA, pH 7.4), and membranes were prepared by dispersing 1 volume of cells in 24 ml ice-cold lysis buffer (10 mM Tris-HCl, 1 mM EGTA, pH 7.4). After 10 min of incubation on ice, membranes were collected at 22,000 × g/10 min. Red cell membranes were resealed by gently resuspending the pellet in 20 volumes of KCl medium followed by a 1 h incubation at 37 °C. The resulting ghosts were collected by centrifugation at 22,000 × g/20 min, resuspended in KCl medium and placed on ice until use.
D-glucose uptake in erythrocyte ghosts
All samples were done in duplicate and at ice temperature. Ghosts were diluted in KCl medium to 0.4 mg/ml, treated with small molecules and exposed to D-glucose (100 μM + 10 μCi/ml). Initial rates of glucose uptake were measured after 30 s of incubation, where uptake was linear with time and did not exceed 17% of equilibrium uptake assessed by exposing membranes to sugar for 1 h at RT. Then, 10 volumes (relative to assay volume) of stopper solution (KCl medium containing 10 μM cytochalasin B and 100 μM phloretin) were added to the assay mixture followed by centrifugation at 14,000 g/1 min and a second wash. Membranes were dissolved in 0.5 ml 0.1 N NaOH, mixed with 5 ml Optophase Supermix scintillation liquid and counted using an LS-6000IC scintillation counter (Beckman Coulter). Non-specific uptake assessed by treatment of membranes with 10 μM cytochalasin B did not exceed 6% of uptake in vehicle treated membranes and was excluded from all samples. Uptake was calculated as previously described (Helgerson et al., 1989). Initial velocity of D-glucose uptake in ghosts treated with vehicle control was 0.028 mM/min.
Kinetics of D-glucose uptake in erythrocyte ghosts
Sealed membranes were treated with small molecules and exposed to variable concentrations of D-glucose (0.0625 ÷ 1000 μM plus 10 μCi/ml). Initial rates of glucose uptake were measured as described above over intervals of 30 s to 120 s where uptake did not exceed 18% of equilibrium uptake. Michaelis-Menten parameters were estimated by non-linear curve fitting (Prism software). Kinetic constants were calculated using a single concentration of inhibitor.
Supplementary Material
Acknowledgments
This work was funded by NIH P50 GM086145 and the Chicago Biomedical Consortium with support from the Searle Funds at the Chicago Community Trust. We thank Gregory Driessens for assistance with glucose uptake experiments. We also thank Paul Schumacker and Theodore Steck for helpful discussions.
Footnotes
Publisher's Disclaimer: This is a PDF file of an unedited manuscript that has been accepted for publication. As a service to our customers we are providing this early version of the manuscript. The manuscript will undergo copyediting, typesetting, and review of the resulting proof before it is published in its final citable form. Please note that during the production process errors may be discovered which could affect the content, and all legal disclaimers that apply to the journal pertain.
References
- Bonder EM, Mooseker MS. Cytochalasin B slows but does not prevent monomer addition at the barbed end of the actin filament. J Cell Biol. 1986;102:282–288. doi: 10.1083/jcb.102.1.282. [DOI] [PMC free article] [PubMed] [Google Scholar]
- Bredel M, Jacoby E. Chemogenomics: An emerging strategy for rapid target and drug discovery. Nat Rev Genet. 2004;5:262–275. doi: 10.1038/nrg1317. [DOI] [PubMed] [Google Scholar]
- Brown J. Effects of 2-deoxyglucose on carbohydrate metabolism: review of the literature and studies in the rat. Metabolism. 1962;11:1098–1112. [PubMed] [Google Scholar]
- Brown RC, Wahl RL. Overexpression of GLUT-1 glucose transporter in human breast cancer. An immunohistochemical study. Cancer. 1993;72:2979–2985. doi: 10.1002/1097-0142(19931115)72:10<2979::aid-cncr2820721020>3.0.co;2-x. [DOI] [PubMed] [Google Scholar]
- Cantuaria G, Fagotti A, Ferrandina G, Magalhaes A, Nadji M, Angioli R, Penalver M, Mancuso S, Scambia G. GLUT-1 expression in ovarian carcinoma: association with survival and response to chemotherapy. Cancer. 2001;92:1144–1150. doi: 10.1002/1097-0142(20010901)92:5<1144::aid-cncr1432>3.0.co;2-t. [DOI] [PubMed] [Google Scholar]
- Carruthers A, DeZutter J, Gaunguly A, Devaskar SU. Will the original glucose transporter isotype stand up! Am J Physiol Endocrinol Metab. 2009;297:E836–E848. doi: 10.1152/ajpendo.00496.2009. [DOI] [PMC free article] [PubMed] [Google Scholar]
- Cavé C, Gassama A, Mahuteau J, d'Angelo J, Riche C. Condensation of chiral imines and chiral β-enaminoesters with maleic and citraconic anhydrides. Tetrahedron Lett. 1997;38:4773–4776. [Google Scholar]
- Cui J, Matsumoto K, Wang CY, Peter ME, Kozmin SA. Synthesis of High-Purity Chemical Library Reveals a Potent Inducer of Oxidative Stress. Chem Bio Chem. 2010;11:1224–1227. doi: 10.1002/cbic.201000193. [DOI] [PMC free article] [PubMed] [Google Scholar]
- DeBerardinis RJ, Lum JJ, Hatzivassiliou G, Thompson CB. The biology of cancer: Metabolic Reprogramming fuels cell growth and proliferation. Cell Metab. 2008;7:11–20. doi: 10.1016/j.cmet.2007.10.002. [DOI] [PubMed] [Google Scholar]
- Deves R, Krupka RM. Cytochalasin B and the kinetics of inhibition of biological transport. A case of asymmetric binding to the glucose carrier. Biochim Biophys Acta. 1978;510:339–348. doi: 10.1016/0005-2736(78)90034-2. [DOI] [PubMed] [Google Scholar]
- Eichner LJ, Perry MC, Dufour CR, Bertos N, Park M, St-Pierre J, Giguere V. miR-378* Mediates Metabolic Shiftin Breast Cancer Cells via the PGC-1β/ERRγ Transcriptional Pathway. Cell Metabolism. 2010;12:352–361. doi: 10.1016/j.cmet.2010.09.002. [DOI] [PubMed] [Google Scholar]
- Evans A, Bates V, Troy H, Hewitt S, Holbeck S, Chung Y, Phillips R, Stubbs M, Griffiths J, Airley R. GLUT-1 as a therapeutic target: increased chemoresistance and HIF-1-independent link with cell turnover is revealed through COMPARE analysis and metabolomic studies. Cancer Chemother Pharmacol. 2008;61:377–393. doi: 10.1007/s00280-007-0480-1. [DOI] [PubMed] [Google Scholar]
- Faik P, Morgan M, Naftalin RJ, Rist RJ. Transport and accumulation of 2-deoxy-D-glucose in wild-type and hexokinase-deficient cultured Chinese-hamster ovary (CHO) cells. Biochem J. 1989;260:153–155. doi: 10.1042/bj2600153. [DOI] [PMC free article] [PubMed] [Google Scholar]
- Gambhir SS. Molecular Imaging of Cancer with Positron Emission Tomography. Nat Rev Cancer. 2004;4:891–899. doi: 10.1038/nrc882. [DOI] [PubMed] [Google Scholar]
- Gatenby RA, Gillies RJ. Why do cancers have high aerobic glycolysis? Nat Rev Cancer. 2004;4:891–899. doi: 10.1038/nrc1478. [DOI] [PubMed] [Google Scholar]
- Gohil VM, et al. Nutrient-sensitized screening for drugs that shift energy metabolism from mitochondrial respiration to glycolysis. Nat Biotechnol. 2010;28:249–255. doi: 10.1038/nbt.1606. [DOI] [PMC free article] [PubMed] [Google Scholar]
- Haber RS, Rathan A, Weiser KR, Pritsker A, Itzkowitz SH, Bodian C, Slater G, Weiss A, Burstein DE. GLUT1 glucose transporter expression in colorectal carcinomas: a marker for poor prognosis. Cancer. 1998;83:34–40. doi: 10.1002/(sici)1097-0142(19980701)83:1<34::aid-cncr5>3.0.co;2-e. [DOI] [PubMed] [Google Scholar]
- Hartwell LH, Szankasi P, Roberts CJ, Murray AW, Friend SH. Integrating genetic approaches into the discovery of anticancer drugs. Science. 1997;278:1064–1068. doi: 10.1126/science.278.5340.1064. [DOI] [PubMed] [Google Scholar]
- Hatanaka M. Transport of sugars in tumor cell membranes. Biochim Biophys Acta. 1974;355:77–104. doi: 10.1016/0304-419x(74)90008-0. [DOI] [PubMed] [Google Scholar]
- Helgerson AL, Hebert DN, Naderi S, Carruthers A. Characterization of two independent modes of action of ATP on human erythrocyte sugar transport. Biochemistry. 1989;28:6410–6417. doi: 10.1021/bi00441a038. [DOI] [PubMed] [Google Scholar]
- Lee H, Suzuki M, Cui J, Kozmin SA. Synthesis of an Azide-Tagged Library of 2,3-Dihydro-4-quinolones. J Org Chem. 2010;75:1756–1759. doi: 10.1021/jo9025447. [DOI] [PMC free article] [PubMed] [Google Scholar]
- Lehar J, Stockwell BR, Giaever G, Nislow C. Combination chemical genetics. Nat Chem Biol. 2008;4:674–681. doi: 10.1038/nchembio.120. [DOI] [PMC free article] [PubMed] [Google Scholar]
- Liu H, Hu YP, Savarai N, Priebe W, Lampadis T. Hypersensitization of tumor cells to glycolytic inhibitors. Biochemistry. 2001;40:5542–5547. doi: 10.1021/bi002426w. [DOI] [PubMed] [Google Scholar]
- Manolescu AR, Witkowska K, Kinnaird A, Cessford T, Cheeseman C. Facilitated hexose transporters: new perspectives on form and function. Physiology. 2007;22:234–240. doi: 10.1152/physiol.00011.2007. [DOI] [PubMed] [Google Scholar]
- Nishioka T, Oda Y, Seino Y, Yamamoto T, Inagaki N, Yano H, Imura H, Shigemoto R, Kikuchi H. Distribution of glucose transporters in human brain tumors. Cancer Res. 1992;52:3972–3979. [PubMed] [Google Scholar]
- Ohnishi T, Trumpower BL. Differential effects of antimycin on ubisemiquinone bound in different environments in isolated succinate-cytochrome c reductase complex. J Biol Chem. 1980;255:3278–3824. [PubMed] [Google Scholar]
- Omura S, Fujimoto T, Otoguro K, Matsuzaki K, Moriguchi R, Tanaka H, Sasaki Y. Lactacystin, a novel microbial metabolite, induces neuritogenesis of neuroblastoma cells. J Antibiot. 1991;44:113–116. doi: 10.7164/antibiotics.44.113. [DOI] [PubMed] [Google Scholar]
- Pelicano H, Martin DS, Xu R, Huang P. Glycolysis inhibition for anticancer treatment. Oncogene. 2006;25:4633–4646. doi: 10.1038/sj.onc.1209597. [DOI] [PubMed] [Google Scholar]
- Racker E. History of the Pasteur effect and its pathobiology. Mol Cell Biochem. 1974;5:17–23. doi: 10.1007/BF01874168. [DOI] [PubMed] [Google Scholar]
- Rudlowski C, Becker AJ, Schroder W, Rath W, Buttner R, Moser M. GLUT1 messenger RNA and protein induction relates to the malignant transformation of cervical cancer. Am J Clin Pathol. 2003;120:691–698. doi: 10.1309/4KYN-QM58-62JW-2GD7. [DOI] [PubMed] [Google Scholar]
- Sabri MI, Ochs S. Inhibition of glyceraldehydes-3-phoshate dehydrogenase in mammalian nerve by iodoacetic acid. J Neurochem. 1971;18:1509–1514. doi: 10.1111/j.1471-4159.1971.tb00013.x. [DOI] [PubMed] [Google Scholar]
- Segrè D, Deluna A, Church GM, Kishony R. Modular epistasis in yeast metabolism. Nat Genet. 2005;37:77–83. doi: 10.1038/ng1489. [DOI] [PubMed] [Google Scholar]
- Stockwell BR. Chemical genetics: ligand-based discovery of gene function. Nat Rev Genet. 2000;1:116–125. doi: 10.1038/35038557. [DOI] [PMC free article] [PubMed] [Google Scholar]
- Tan DS. Diversity-oriented synthesis: exploring the intersections between chemistry and biology. Nat Chem Biol. 2005;1:74–84. doi: 10.1038/nchembio0705-74. [DOI] [PubMed] [Google Scholar]
- Tennant DA, Durán RV, Gottlieb E. Targeting metabolic transformation for cancer therapy. Nat Rev Cancer. 2010;10:267–277. doi: 10.1038/nrc2817. [DOI] [PubMed] [Google Scholar]
- Tong AH, Evangelista M, Parsons AB, Xu H, Bader GD, Pagé N, Robinson M, Raghibizadeh S, Hogue CW, Bussey H, Andrews B, Tyers M, Boone C. Systematic genetic analysis with ordered arrays of yeast deletion mutants. Science. 2001;294:2364–2368. doi: 10.1126/science.1065810. [DOI] [PubMed] [Google Scholar]
- Tong AH, et al. Global mapping of the yeast genetic interaction network. Science. 2004;303:808–813. doi: 10.1126/science.1091317. [DOI] [PubMed] [Google Scholar]
- Ulanovskaya O, Janjic J, Matsumoto K, Schumacker PT, Kron SJ, Kozmin SA. Synthesis enables identification of the cellular target of leucascandrolide A and neopeltolide. Nat Chem Biol. 2008;4:418–424. doi: 10.1038/nchembio.94. [DOI] [PMC free article] [PubMed] [Google Scholar]
- Vander Heiden MG, Cantley LC, Thompson CB. Understanding the Warburg effect: the metabolic requirements of cell proliferation. Science. 2009;324:1029–1033. doi: 10.1126/science.1160809. [DOI] [PMC free article] [PubMed] [Google Scholar]
- Vera JC, Ricas CI, Fischbarg J, Golde DW. Mammalian facilitative hexose transporters mediate the transport of dehydroascorbic acid. Nature. 1993;364:79–82. doi: 10.1038/364079a0. [DOI] [PubMed] [Google Scholar]
- Vera JC, Reyes AM, Carcamo JG, Velasques FV, Rivas CI, Zhang RH, Strobel P, Iribarren R, Scher H, Slebe JC, Golde DW. Genistein is a natural inhibitor of hexose and dehydroascorbic acid transport through the glucose transporter, GLUT1. J Biol Chem. 1996;271:8719–8724. doi: 10.1074/jbc.271.15.8719. [DOI] [PubMed] [Google Scholar]
- Warburg O. On the origin of cancer cells. Science. 1956;123:309–123. doi: 10.1126/science.123.3191.309. [DOI] [PubMed] [Google Scholar]
- Yamamoto T, Seino Y, Fukumoto H, Koh G, Yano H, Inagaki N, Yamada Y, Inoue K, Manabe T, Imura H. Over-expression of facilitative glucose transporter genes in human cancer. Biochem Biophys Res Commun. 1990;170:223–230. doi: 10.1016/0006-291x(90)91263-r. [DOI] [PubMed] [Google Scholar]
- Yost CS. A New Look at the Respiratory Stimulant Doxapram. CNS Drug Rev. 2006;12:236–249. doi: 10.1111/j.1527-3458.2006.00236.x. [DOI] [PMC free article] [PubMed] [Google Scholar]
Associated Data
This section collects any data citations, data availability statements, or supplementary materials included in this article.