Abstract
O6-alkylguanine-DNA alkyltransferase (AGT) repairs mutagenic O6-alkylguanine and O4-alkylthymine adducts present in DNA that has been exposed to alkylating agents. AGT binds DNA cooperatively and models of cooperative complexes predict that residues 1–7 of one protein molecule and 163–169 of a neighboring protein are closely juxtaposed. To test these models we used directed mutagenesis to substitute triplets of alanine for triplets of native residues across these two sequences. Six of eight designed mutants expressed AGT at detectable levels. All mutant AGTs that were expressed were folded compactly, bound DNA with stoichiometries equivalent to wild-type protein and were able to protect E. coli to varying degrees from the potent alkylating agent MNNG. All mutations attenuated DNA binding cooperativity, but unexpectedly, they also reduced AGT affinity for DNA. This suggests that the protein-protein and protein-DNA interactions of AGT are strongly coupled. When normalized for differences in AGT expression, cells expressing mutants KDC(3–5)-AAA, DCE(4–6)-AAA and KEW(165–167)-AAA were significantly more susceptible to MNNG than wild-type cells. This is the first evidence, to our knowledge, of a role for residues at the protein-protein interface and by implication, cooperative protein-protein interactions, in the cell-protective mechanisms of AGT.
O6-alkylguanine and O4-alkylthymine are mutagenic adducts that are found in DNA that has been exposed to alkylating agents (1, 2). In humans and many other organisms, O6-alkylguanine-DNA alkyltransferase (AGT, also called O6-methylguanine DNA methyltransferase, MGMT) provides a mechanism for the direct removal of these adducts (3, 4). While this activity protects normal cells from alkylating agents, it also protects tumor cells against chemotherapeutic drugs that alkylate DNA (5, 6). AGT-inhibitors have been developed that increase the efficacy of alkylating drugs in cancer chemotherapy and clinical trials of two are underway (7–10). In spite of the interest focused on AGT as a result of its relevance to cancer, much remains to be discovered about its mechanisms of interaction with the proteins and nucleic acids in its cellular environment.
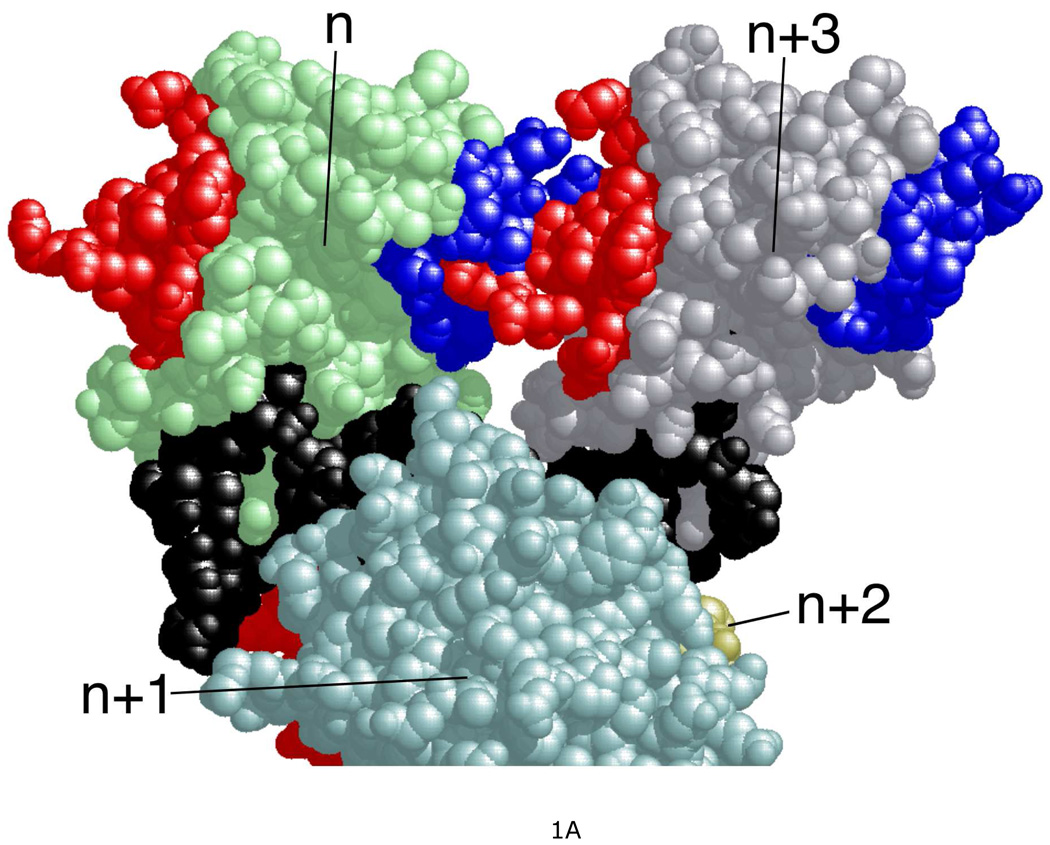
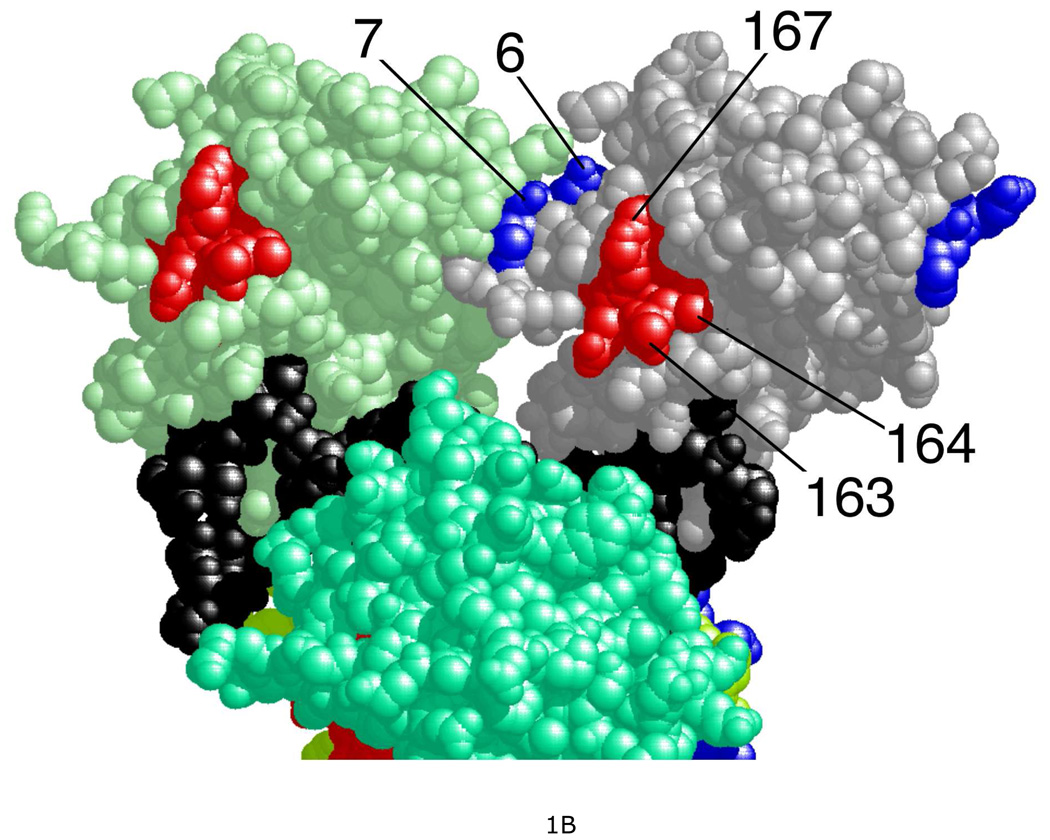
Human AGT is a small, monomeric protein (Mr = 21,519), expressed constitutively in normal cells (4, 11, 12). It repairs both single-stranded and duplex DNAs (13) and forms cooperative complexes on these DNAs with similar association constants (Ka ~104 M−1), cooperativity parameters (ω ~ 80) and binding site sizes (~4 bp(nt)/protein) (14, 15). The simplest mechanisms that account for these features are ones with substantial protein-protein contact and little distortion of the twist of double-stranded DNA. High-resolution structures of cooperative complexes are not currently available, so it has not been possible to directly verify these predictions. However crystal structures of single AGT molecules bound to DNA are available (16, 17) and have been used to build models of cooperative assemblies (18). These models feature helical arrays of proteins around a central DNA axis, with major protein-protein contacts between the amino-terminal face of the nth AGT molecule and the C-terminal face of the n + 3rd molecule (Figure 1A). Chemical cross-linking results consistent with this juxtaposition identified residues at the protein-protein interface (18). Among the most frequently-obtained cross-links were ones that coupled sequences located in chymotryptic fragments spanning residues 1–7 and 163–169 (Figure 1B). A BLAST analysis (19) indicated that with a few exceptions (K3, D4 and E6 present in mammals only), these residues are conserved in a wide range of organisms (result not shown); this outcome is consistent with an earlier sequence comparision (20). In mutagenesis experiments described below, we test whether residues in these motifs contribute to the strength of cooperative interactions in vitro and efficacy of DNA repair in vivo. In addition, as residues 1–7 and 163–169 are located far from the known DNA-binding surfaces of AGT, mutations in these regions reveal the extent to which protein-DNA and protein-protein interactions are coupled by cooperative binding.
Figure 1. Structural model of a 4:1 AGT-DNA complex.
A. Residues in the protein-protein interface. Protein molecules are labeled n, n+1, n+2, n+3; proteins n+1 and n+2 are partially cut by the lower edge of the figure. Protein n+2 is almost completely obscured by protein n+1. A 16 bp DNA molecule, bound by all four proteins in the complex, is colored black. Interface residues identified by chemical cross-linking (18) are colored blue if they are located in the N-terminal face of the protein or red if they are in the C-terminal face. B. AGT residues that are targets of mutagenesis. Parts of polypeptides 1–7 and 163–169 are shown; these were efficiently crosslinked in AGT-DNA complexes. Residues 1–5 are not shown because they were not resolved in the crystal structure of Daniels et al. (16) that is the source of the protein and DNA structures used to build this model.
EXPERIMENTAL PROCEDURES
Reagents
Agar, yeast extract and tryptone broth were obtained from Midwest Scientific. T4 polynucleotide kinase was purchased from New England Biolabs and [γ-32P]ATP was from ICN Radiochemicals. HPLC-purified oligodeoxyribonucleotides (Table S1) were purchased from Invitrogen. All other biochemicals were from Sigma.
Protein preparations
Human AGT, with wild-type sequence except for a C-terminal (His)6–tag replacing residues 202–207, was encoded on plasmid pQE-hAGT (16), kindly provided by Dr. A.E. Pegg (Penn State University). Mutants were constructed using QuikChange mutagenesis kits (Stratagene) using primers designed to substitute trios of alanine residues for trios of wild-type residues across the target sequences (amino acids 2–7 and 164–169; Table S1). Wild-type and mutant sequences were confirmed by sequencing plasmid DNA from candidate clones (performed by Seqwright DNA Technology Services). Mutant and wild-type proteins were expressed in XL1-blue E. coli (Stratagene) and purified by Talon® chromatography as described (16). Wild type protein was dialyzed against storage buffer (20 mM Tris (pH 8.0 at 20°C), 250 mM NaCl) and stored frozen at −80°C until needed. Mutant proteins were less soluble; storage buffer supplemented with arginine (440 mM) as described by Arakawa et al. (21) enhanced recovery of these proteins after freezing. Proteins stored in arginine-containing buffers were dialyzed against arginine-free experimental buffers before use; these preparations remained soluble at 4°C for several days after dialysis (result not shown). Protein concentrations were measured spectrophotometrically using ε280 = 2.64 × 10⁴ M−1cm−1 (22).
DNA substrates
Synthetic DNAs were obtained from Invitrogen. Oligo 9 (Table S1) was labeled at 5’ termini with 32P (23). Unincorporated [γ-32P] ATP was removed with Sephadex G-10 centrifuge columns (GE Healthcare) equilibrated with 10 mM Tris (pH 8.0 at 20°C), 50 mM KCl. Duplex DNA was prepared by annealing with oligo 10 (Table S1) as described (22). DNA concentrations were measured spectrophotometrically, using ε260 = 9.46 × 10³ M−1cm−1 (per base) for single-stranded DNA and ε260 =1.31 × 10⁴ M−1cm−1 (per base) for double-stranded DNA.
Electrophoretic mobility shift assays (EMSA)
Mobility shift assays were carried out at 20 ± 1°C in 10 mM Tris (pH 8.0 at 20°C), 1 mM EDTA, 50 mM KCl, 1 mM DTT pH 8.0, as previously described (15). Samples contained 32P-labeled 26-mer dsDNA (2 × 10⁻⁸ M) and 0–20µM AGT. Electrophoresis was performed in 15% polyacrylamide gels (15) at 10 Vcm−1. Electrophoretic distributions were captured on storage phosphor screens that were scanned on a Typhoon 9400 imager (GE Healthcare). Integrated band intensities were calculated using ImageQuant 5.2 software.
Binding analysis
In these assays, the total concentration of protein binding sites on DNA was always much less than that of the protein, allowing the approximation [P]total = [P]free to be used. The dependence of binding density n on the free protein concentration [P] was given by the McGhee-von Hippel isotherm (McGhee, 1974) as modified by Tsodikov et al. (2001) to account for finite lattice size (Eq. 1).
| (1) |
Here ν is the binding density (protein molecules/nucleotide), K is the association constant for a single site, ω is the cooperativity parameter (the equilibrium constant for moving a protein from an isolated DNA site to one adjacent to another protein (a singly contiguous site) or from a singly-contiguous site to a doubly-contiguous one (24)). N is the DNA length in base pairs and s the occluded site size (the size of the site, in base pairs, that one protein molecule occupies to the exclusion of others). The model embodied in this equation is one in which proteins are assumed not to bind to fractional sites of length < s base pairs located within or at the ends of DNA molecules (25).
Circular Dichroism
Spectra were obtained at 4°C using a JASCO J-810 spectropolarimeter and a cell with a path length of 0.02 cm. Secondary structure analysis was performed by the Contin/LL and Selcon3 routines, implemented in the program CDPro (26, 27) This program was obtained from http://lamar/colostate.ed/~sreeram/CDPro/main.html. The SDP48 basis set used in this analysis contains spectra of soluble, globular and denatured proteins with α- and β-structures strongly represented.
Analytical ultracentrifugation
AGT proteins were dialyzed against 50 mM sodium phosphate, pH 7.5 at 4°C and concentration adjusted to 0.16 mg/mL (7.5 µM). Sedimentation velocity measurements were carried out at 40,000 rpm and 4°C using a Beckman XL-A analytical ultracentrifuge. Sedimentation coefficient distributions c(s) and molecular weight distributions c(M) were obtained by direct boundary modeling using numerical solutions of the Lamm equation (28) implemented in the program SEDFIT (29), obtained from http://www.analyticalultracentrifugation.com/default.htm. Buffer density and viscosity values were calculated using the public domain program SEDNTERP, developed by D. Hayes, T. Laue and J. Philo (30), obtained from http://www.rasmb.bbri.org/.
Cell survival assays
Cell survival was assayed using E. coli TRG8 cells deficient in endogenous DNA alkyltransferases (ada− ogt−) (31, 32). This strain was kindly provided by Dr. A.E. Pegg (Penn State University). Cells were transformed with pQE-hAGT plasmids expressing WT or mutant AGTs and grown in shaker culture in LB broth containing 50 µg/ml ampicillin and 50 µg/ml kanamycin until A600 = 0.5. Aliquots of each culture were exposed to N-methyl-N’-nitro-N-nitrosoguanidine (MNNG) at concentrations ranging from 0 to 45 µg/mL for 30 min with shaking at 25°C. Reactions were stopped by dilution with cold M9 medium. Dilutions were plated on LB-agar plates containing 50 µg/ml ampicillin and 50 µg/ml kanamycin and incubated at 37°C for 48h. Colony numbers were determined by manual counting. Fractional survival was determined by dividing the number of colonies per ml of culture exposed to MNNG by the number of colonies per ml of culture when MNNG was absent.
Protein Expression Measurements
TRG8 cells containing pQE-hAGT plasmids were grown at 37°C in LB containing 50 µg/ml ampicillin and 50 µg/ml kanamycin. Cells were harvested by centrifugation (4000 × g for 5 min), resuspended in 5 ml of 20 mM Tris-HCl (pH 8.0 at 20°C), 250 mM NaCl 1 mg/mL lysozyme, and incubated at 4°C for 1 h. Cell suspensions were sonicated (3 × 15 sec at 15 sec intervals) then centrifuged at 4000 × g for 10 min. Supernatants were equilibrated batch wise with Talon® resin (5 mL) for 20 min. Preliminary experiments established that this ratio of resin to cell extract resulted in depletion of AGT in the supernatant to levels that were not detectable by Western blotting (result not shown). The resin was washed with 60 mL of 20 mM Tris-HCl (pH 8.0 at 20°C), 250 mM NaCl and then retained proteins were eluted with 10 mL of 20 mM Tris-HCl, 250 mM NaCl 200 mM imidizole (pH 8.0 at 20°C). Eluted proteins were concentrated to 200 µl using centrifugal concentrators (Pierce). Samples (25 µl) were denatured, resolved by SDS-PAGE (33) and detected by western blotting (34, 35) using a mouse monoclonal antibody against human AGT (ab7045 from Abcam) and anti-mouse fluorescent secondary antibody (Perkin-Elmer). Blots were developed with ECF substrate (GE Healthcare) and scanned on a Typhoon 9400 imager. Densitometry was performed using the program ImageQuant v.5.2.
RESULTS
Characterization of mutant proteins
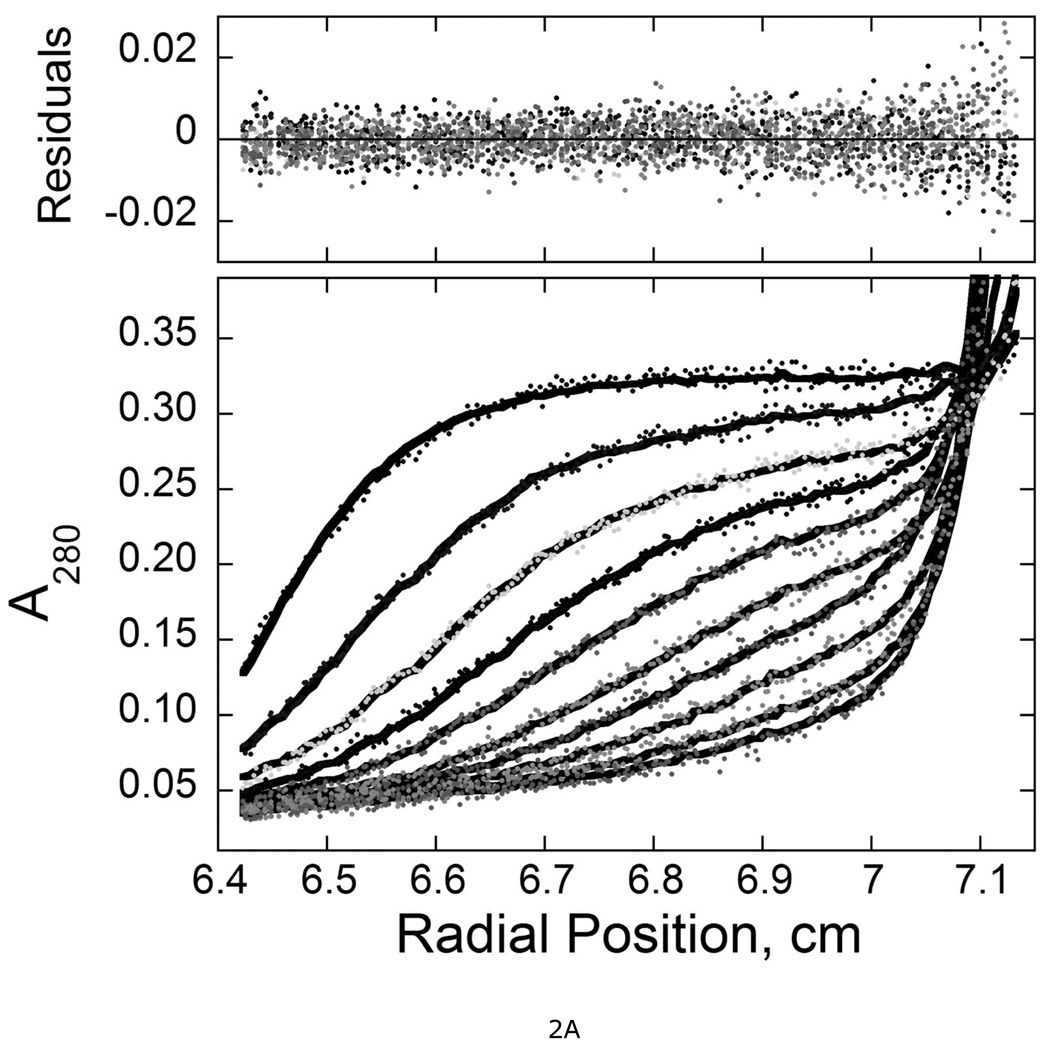
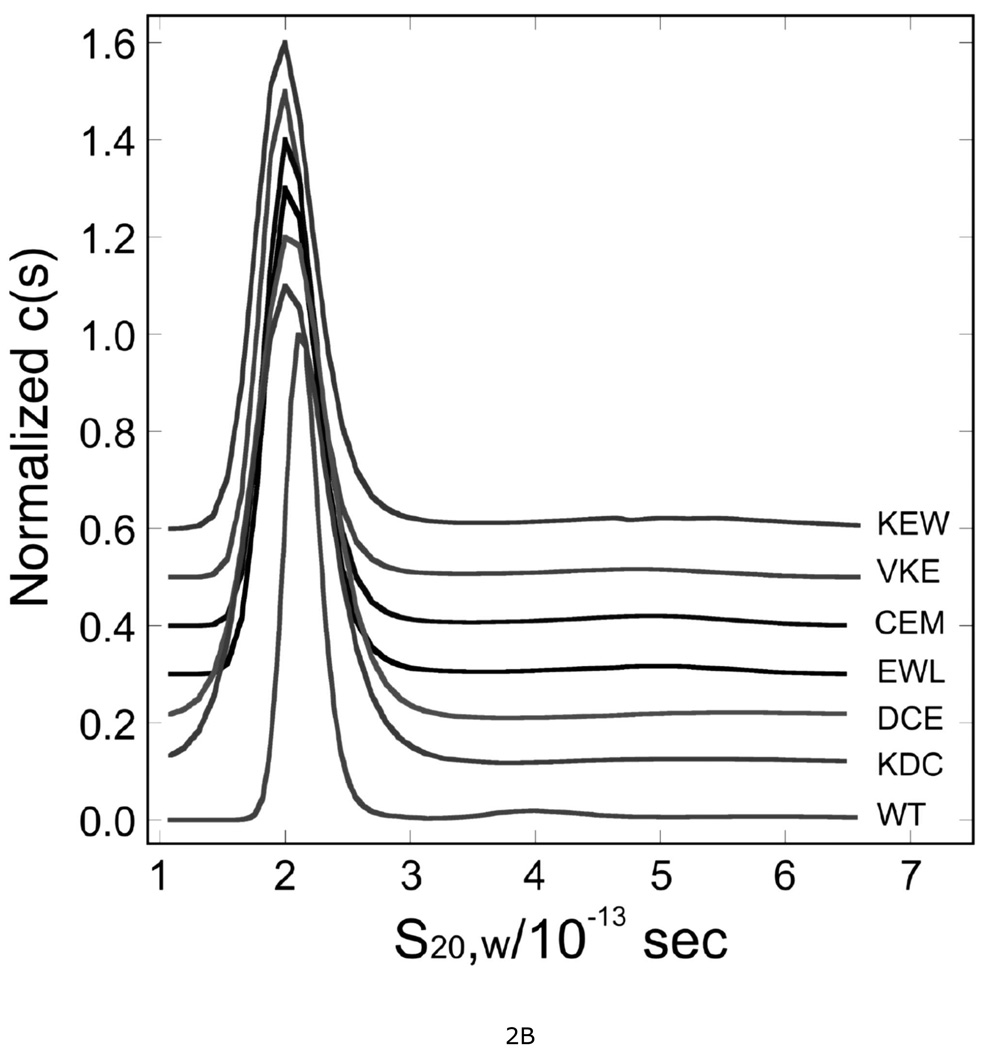
Chemical cross-linking identified AGT segments that are juxtaposed in cooperative AGT-DNA complexes (18). However, cross-linking reflects proximity and reactivity, not function. To identify residues that mediate the cooperative interaction, we performed scanning mutagenesis across two segments of AGT sequence that had been found to crosslink with high efficiency (Figure 1B). The mutations substituted triplets of alanine for triplets of wild-type amino acids, spanning residue numbers 1–7 and 163–169. Six AGT mutants (KDC(3–5)-AAA, DCE(4–6)-AAA, CEM(5–7)-AAA, VKE(164–166)-AAA, KEW(165–167)-AAA and EWL(166–168)-AAA) were obtained using primers P2–P7 listed in Table S1. Viable transformants were not obtained with plasmids mutated with primers P1 and P8, in spite of repeated attempts with different DNA preparations and different preparations of competent cells. Mutant proteins were purified to near-homogeneity (Figure S1) and were characterized by analytical ultracentrifugation. All preparations contained a single, dominant species (≥92% of total signal) that sedimented at ~2S (Fig. 2); c(M) analyses (28) showed that the dominant component in each sample had a molecular weight equal, within error, to the sequence molecular weight of AGT (Mr = 21519 (14)). These results are summarized in Table 1. All preparations contained a minor component (<7% of total signal) with a broad s-value distribution (3 ≤ s20,w ≤ 6). This could be removed by chromatography on Sephadex G-25, but reappeared after freeze-thaw or prolonged storage at 4°C, consistent with the notion that it was an aggregated form of AGT (result not shown). Comparison of c(s) distributions of wild-type and mutant proteins (Fig. 2B) showed that s-value distributions of mutant proteins were broadened in the direction of lower s-value and frictional ratios f/f0 were increased, suggesting that these proteins were somewhat less compact and/or spherically-symmetric than wild-type.
Figure 2. Sedimentation velocity analysis of wild-type and mutant AGT proteins.
A. Time-evolution of boundary sedimentation in a solution of wild type AGT in 50 mM potassium phosphate pH 7.4. Centrifugation was performed at 4°C and 40,000 rpm. Data collected as a function of time are shown in the lower frame. Scans shown here were taken 40 min apart. Data were fit (solid black curves) using numerical solutions to the Lamm equation for the continuous c(s) model implemented in the program SEDFIT (28, 47). The small, symmetrically-distributed residuals (upper panel) demonstrate that this model accounts well for the data. B. Distributions of c(s) for wild-type and mutant AGT proteins. Values of c(s) are normalized so that the maximum Δc(s) in each profile is 1 absorbance unit. Profiles are offset by 0.1 absorbance unit from their nearest neighbors for clarity. Sequences replaced by alanine triplets are indicated.
Table 1.
Hydrodynamic Properties of Wild-Type and Mutant AGT Proteins.
| Protein Identity |
Sequence MW |
MW from c(M)a |
Monomer Percentb |
S20,W/10−13 seca |
f/f0c |
|---|---|---|---|---|---|
| Wild type | 21876.1 | 22367 ± 3473 | 92.4 | 2.10 ± 0.10 | 1.265 ± 0.059 |
| KDC(3–5)-AAA | 21743 | 21816 ± 5494 | 90.2 | 2.01 ± 0.28 | 1.321 ± 0.166 |
| DCE(4–6)-AAA | 21742 | 21904 ± 5192 | 91.9 | 2.03 ± 0.28 | 1.308 ± 0.162 |
| CEM(5–7)-AAA | 21725.9 | 20911 ± 2202 | 93.1 | 2.00 ± 0.28 | 1.328 ± 0.167 |
| VKE(164–166)-AAA | 21732.9 | 21514 ± 3084 | 91.9 | 1.98 ± 0.17 | 1.337 ± 0.124 |
| KEW(165–167)-AAA | 21645.9 | 20921 ± 3231 | 92.7 | 1.97 ± 0.20 | 1.351 ± 0.126 |
| EWL(166–168)-AAA | 21660.9 | 21850 ± 3106 | 94.0 | 2.00 ± 0.259 | 1.328 ± 0.153 |
Circular dichroism (CD) spectroscopy was used to characterize global structural differences between wild-type and mutant proteins. All proteins had well-developed negative CD bands at 208 and 222 nm that are consistent with the presence of α-helical structure (Figure S2), but CD amplitudes in this wavelength range differ considerably. Spectrum analysis using the CDPRO program (26, 27), showed that mutants KDC(3–5)-AAA, CEM(5–7)-AAA and VKE(164–166)-AAA had residue-fractions of helix and sheet motifs similar to wild type AGT (summarized in Table S2). Mutants KEW(165–167)-AAA, EWL(166–168)-AAA and especially DCE(4–6)-AAA contained less helix and correspondingly more β- and unassigned structures than wild-type. It is notable that while all mutant proteins had smaller s20,w values than wild-type AGT, the protein with the CD spectrum most different from wild-type (DCE(4–6)-AAA) differed least in s-value. The simplest model consistent with this outcome is one in which both CD and s20,w differences reflect local conformational differences and not globally different protein folds. This interpretation is supported by DNA-binding, expression and DNA-repair results described below.
Mutations change both binding cooperativity and DNA-affinity
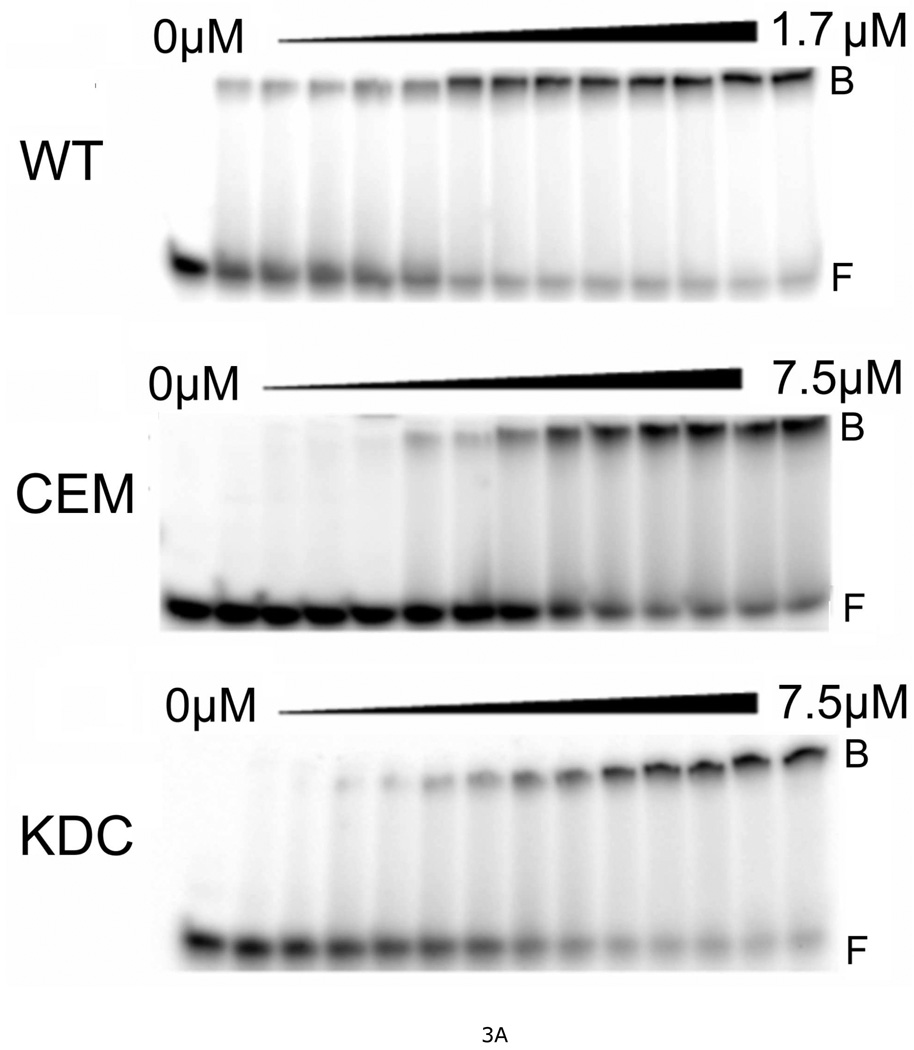
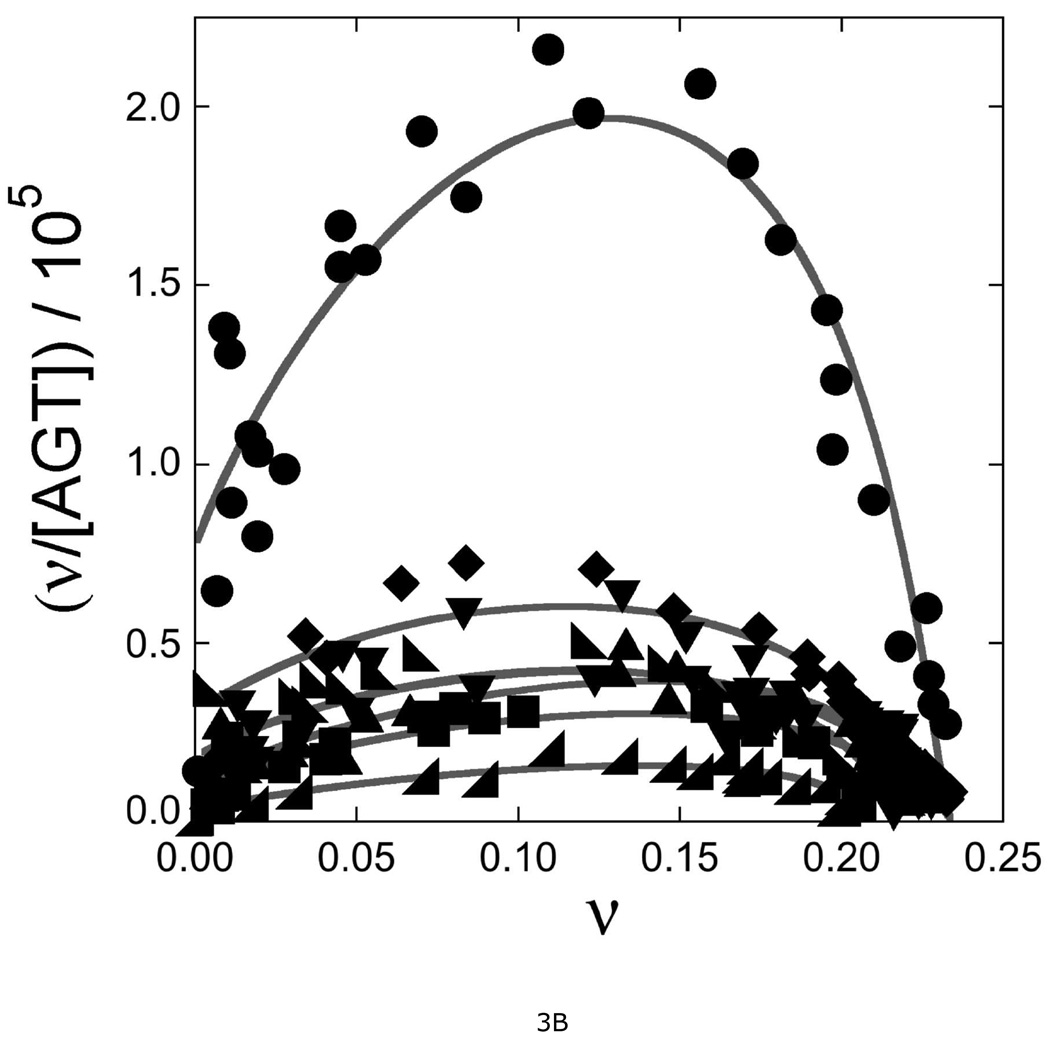
Electrophoretic mobility shift assays (EMSA) were carried out according to standard methods (22), using a 26 bp DNA as the binding substrate (Fig. 3A). All proteins were active in DNA binding, giving single-step transitions from free DNA to saturated complexes. Previously, we found that this DNA accommodates 6 wild-type AGT molecules at saturation, corresponding to an average binding site size of 4.3 bp/protein (15). Using the same serial-dilution approach, we found that mutant AGT proteins bind with similar stoichiometries (Table 2). This formation of a multi-protein complex from free DNA without significant accumulation of lower-stoichiometry species is evidence of positively-cooperative binding (14, 15). Scatchard plots for wild-type and mutant proteins are shown in Fig. 3B; the concave-downward curvature of these graphs is further evidence of positive cooperativity (24). Values of association constant (K) and cooperativity parameter (ω) were obtained by fitting these data with Eq. 1 (results summarized in Table 2). For wild-type AGT, values of K and ω were similar to ones previously reported for binding a double-stranded 16-mer DNA under the same buffer conditions (18). All mutant proteins bound DNA with significantly lower overall affinities (values of K•ω) attributable, in part, to reduced binding cooperativity. This was an expected result of disruption of contacts across the protein-protein interface. However, significant reductions in K were also observed. This was unexpected, because the DNA-binding surfaces seen in crystal structures (16, 17) are distant from the protein-interfaces identified by cross-linking (18). An additional unexpected result is a correlation of K and ω values among mutant proteins (described below). Together these results suggest that the protein-protein and protein-DNA interactions of AGT are strongly coupled. Mechanisms that might couple these interactions are considered below.
Figure 3. Measurement of DNA-binding affinities for wild-type and mutant AGT proteins.
A. Representative EMSA analyses. Titrations of 32P-labeled double-stranded 26-mer DNA (2 × 10⁻⁷M) with wild-type AGT, CEM(5–7)-AAA and KDC(3–5)-AAA mutants. Protein concentrations ranged from 0 (first lane at left in each panel) to 1.7µM (wild-type AGT) or 7.5µM (mutant proteins). Binding reactions were carried out at 20 ± 1°C in 10 mM Tris (pH 8.0 at 20°C), 50 mM KCl, 0.1 mM DTT. Band designations: B, bound DNA; F, free DNA. Although these images have been cropped and labeled for clarity, no additional bands were detectable between the origin of electrophoresis and the ionic front. B. Scatchard plots for AGT binding to duplex 26mer DNA. Data derived from mobility shift assays, including those shown in panel A. Symbols: (●) data for wild-type AGT; (♦) data for KDC(3–5)-AAA AGT; (▼) data for CEM(5–7)-AAA) AGT; (◣) data for VKE(164–166)-AAA AGT; (▲) data for EWL(166–168)-AAA AGT; (■) data for DCE(4–6)-AAA AGT; (◢) data for KEW(165–167)-AAA AGT. The smooth curves are fits of Equation 1 to these data sets; fitting parameters are summarized in Table 2.
Table 2.
DNA-Binding Characteristics Of Wild-Type And Mutant AGT Proteins.
| Protein | Saturating AGT/DNA Stoichiometrya |
Binding Site Size (n), bp/protein |
K(rel)b | ω(rel)b | K(rel) × ω(rel)b |
|---|---|---|---|---|---|
| WT | 6.19 ± 0.07 | 4.2 ± 0.04 | 1 | 1 | 1 |
| KDC(3–5)-AAA | 6.19 ± 0.09 | 4.2 ± 0.06 | 0.17 ± 0.04 | 0.37 ± 0.04 | 0.07 ± 0.03 |
| DCE(4–6)-AAA | 6.04 ± 0.08 | 4.3 ± 0.07 | 0.11 ± 0.03 | 0.48 ± 0.10 | 0.05 ± 0.02 |
| CEM(5–7)-AAA) | 6.19 ± 0.09 | 4.2 ± 0.06 | 0.22 ± 0.03 | 0.31 ± 0.05 | 0.08 ± 0.02 |
| VKE(164–166)-AAA | 5.8 ± 0.07 | 4.5 ± 0.06 | 0.21 ± 0.03 | 0.38 ± 0.06 | 0.08 ± 0.03 |
| KEW(165–167)-AAA | 5.5 ± 0.06 | 4.7 ± 0.05 | 0.04 ± 0.02 | 0.67 ± 0.11 | 0.02 ± 0.01 |
| EWL(166–168)-AAA | 6.04 ± 0.03 | 4.3 ± 0.04 | 0.13 ± 0.02 | 0.52 ± 0.08 | 0.07 ± 0.02 |
Determined by serial dilution as described (15). Error ranges are 95% confidence limits of data sets containing 14–28 independent measurements.
Values determined using Eq. 1 using data sets containing 14–28 independent measurements. Values normalized to K(wild-type) = 9.2 ± 1.1 × 10⁴ M−1, ω(wild-type) = 57.2 ± 4.3 and K•ω(wild-type) = 5.3 ± 1.1 × 10⁶M−1. Error ranges are 95% confidence limits.
DNA repair and AGT expression in an in vivo model system
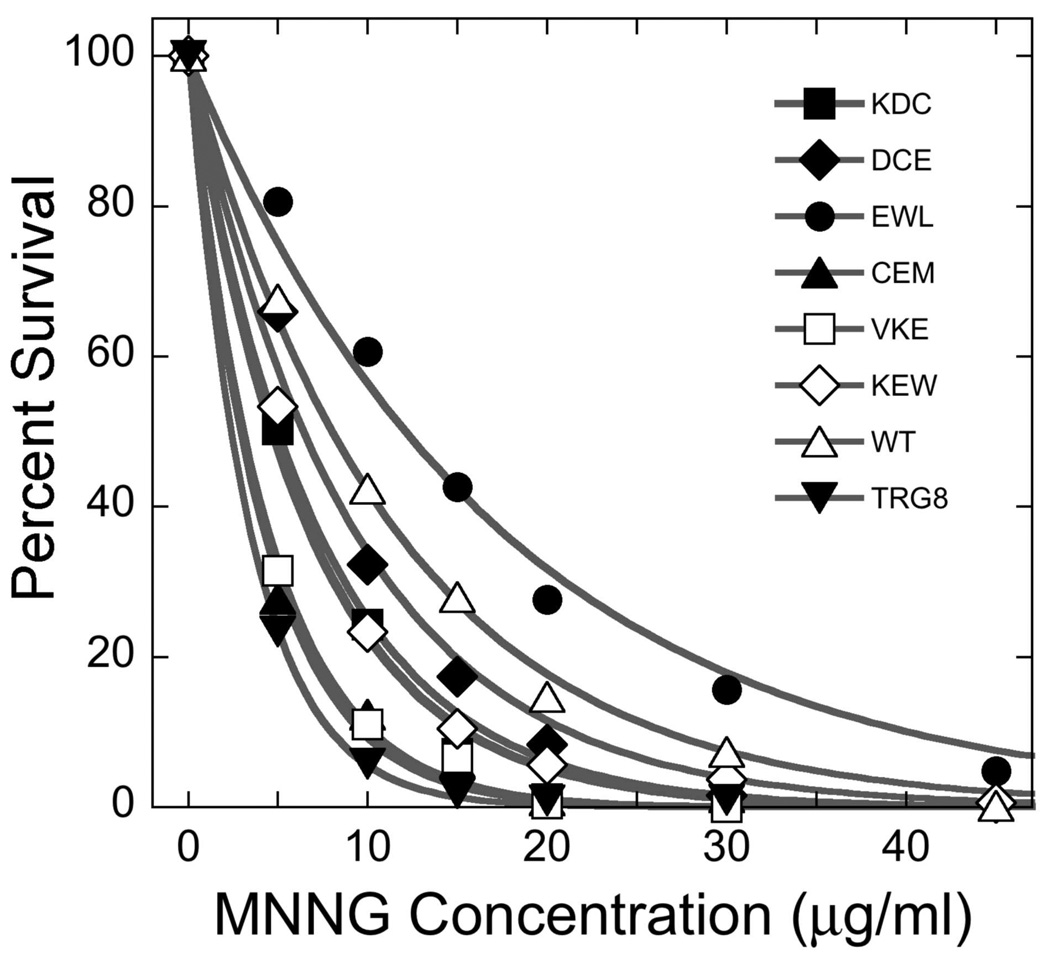
As shown above, mutations in AGT’s protein-protein interfaces can reduce DNA-affinity and binding cooperativity, but these results do not indicate whether such mutations influence cellular protection against DNA-alkylating agents. To answer this question, we took advantage of a model system consisting of E. coli cells deleted of their endogenous alkyltransferases Ada and Ogt (36). The expression of human AGT in these cells protects them from the potent alkylating agent MNNG (N-methyl-N'-nitro-N-nitroso-guanidine). E. coli TRG8 (ada− ogt−) cells and TRG8 transformed with pQE-hAGT plasmids were exposed to MNNG (0–45 µg/mL) and plated for colony-counting as described. Increasing MNNG-exposure reduced survival of all cells, with alkyl-transferase-deficient TRG8 cells being the most sensitive to MNNG (Figure 4). All plasmids encoding mutant AGT proteins conferred resistance to MNNG, but the degree of resistance, measured by LD50 ranged widely (Table 3). The protection afforded by pQE-hAGT-(CEM(5–7)-AAA) or - VKE(164–166)-AAA plasmids was barely detectible and that provided by pQE-hAGT-KDC(3–5)-AAA, -DCE(4–6)-AAA and -KEW(165–167)-AAA while substantial, was less than that of pQE-hAGT-(wild-type). Intriguingly, the protection conferred by pQE-hAGT-EWL(166–168)-AAA was significantly greater than that afforded by the wild-type plasmid.
Figure 4. MNNG survival assays.
Liquid cultures of TRG8 cells expressing wild-type or mutant AGT proteins were exposed to 0–45µg/mL MNNG for 30 min. Serial dilutions were plated and colonies were counted after 24h of culture at 37°C. Percent survival was calculated as 100 × C(MNNG)/C(control), where C(MNNG) is the number of colonies per mL of culture exposed to MNNG and C(control) is the corresponding number of colonies in parallel cultures not exposed to MNNG. The smooth curves are fits of a single-exponential decay function to the data.
Table 3.
Expression of AGT and Cell Sensitivity to MNNG.
| Parameter | KDC (3–5)- AAA |
DCE (4–6)- AAA |
CEM (5–7)- AAA |
VKE (164–166)- AAA |
KEW (165–167)- AAA |
EWL (166–168)- AAA |
|---|---|---|---|---|---|---|
| LD50 (MNNG)a µg/mL | 4.6 ± 0.2 | 6.4 ± 0.3 | 2.8 ± 0.1 | 3.0 ± 0.1 | 5.0 ± 0.1 | 12.0 ± 0.4 |
| E(rel)b = E(mutant)/E(wild-type) | 0.99 ± 0.03 | 1.4 ± 0.05 | 0.37 ± 0.07 | 0.32 ± 0.08 | 1.28 ± 0.05 | 2 ± 0.08 |
| S(rel)c = S(mutant)/S(wild-type) [MNNG] = 30µg/mL | 0.47 ± 0.06 | 0.66 ± 0.09 | 0.28 ± 0.11 | 0.3 ± 0.09 | 0.5 ± 0.09 | 1.5 ± 0.09 |
| Relative protectiond P(rel) = S(rel)/E(rel) | 0.48 ± 0.07 | 0.47 ± 0.11 | 0.84 ± 0.27 | 1.07 ± 0.37 | 0.39 ± 0.06 | 0.75 ± 0.07 |
LD50 (wild-type) was 7.9 ± 0.2 µg/mL. Values ± 95% confidence limits determined by fitting data to a single exponential decay function (shown in Fig. 4).
Relative expression, measured by Western blot assay. Densitometry performed with ImageQuant v.5.2 program (GE Healthcare).
Relative cell survival, measured by colony count after exposure to MNNG (30µg/mL). Error ranges are 95% confidence intervals on at least 3 independent cell dilutions.
Error ranges propagated from those given for S(rel) and E(rel).
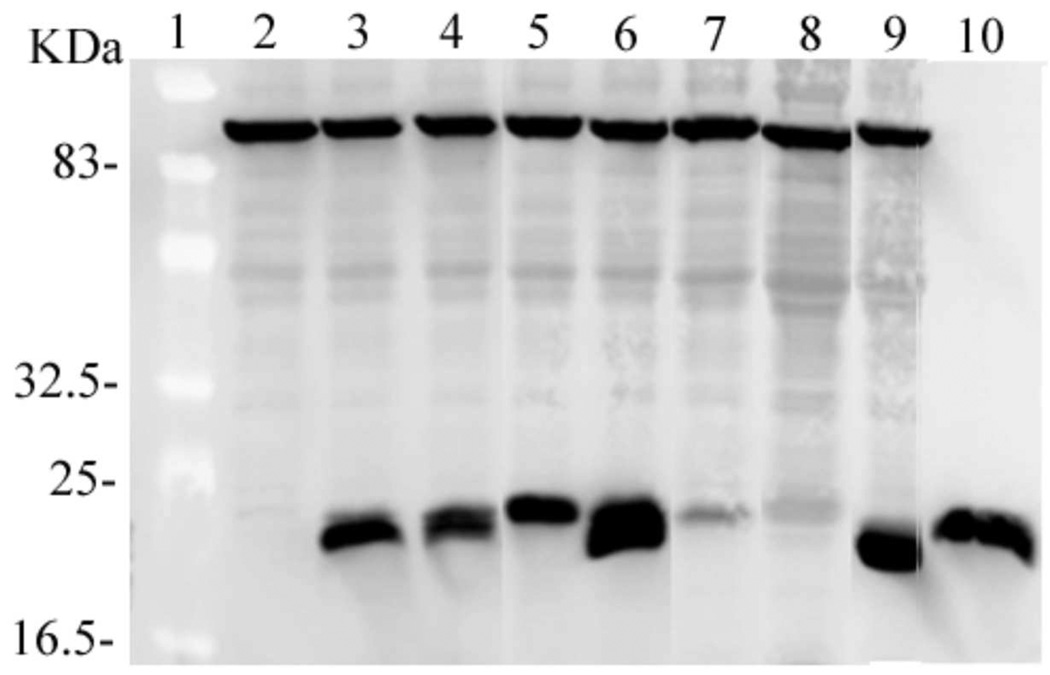
If resistance to MNNG is conferred on TRG8 cells by AGT expression, cell survival is likely to depend on the level of AGT-expression in each cell population as well as on the activities of AGT molecules present. Western blots detected with anti-AGT antibody provided estimates of the relative amounts of AGT in cells harboring wild-type and mutant plasmids. In the analysis shown in Figure 5, lanes 2–9 contained identical volumes of partially-purified cell extract (25 µL). An E. coli protein (Mr~85,000) that is present in TRG8 extracts but not XL-1 blue extracts, cross-reacts with the primary antibody. The intensity of this band provides a visible indication of the relative amounts of E. coli protein applied to each lane. The intensities of the strongly-reacting bands that migrate with Mr~21,000 represent the relative amounts of AGT proteins present (purified wild-type AGT is shown in lane 10 for comparison). The slight differences in electrophoretic mobility of these bands are reproducible; we attribute them to differences in charge and mass caused by our mutations. On the basis of relative band intensities, KDC(3–5)-AAA and DCE(4–6)-AAA proteins are present in quantities similar to wild-type AGT, CEM(5–7)-AAA and VKE(164–166)-AAA are present in smaller amounts and EWL(166–168)-AAA and KEW(165–167)-AAA are present in greater amounts than wild-type AGT (Table 3).
Figure 5. Expression of wild-type and mutant AGT proteins in E. coli TRG8.
Analysis by SDS-PAGE and western blot. Lane 1, molecular weight standards (10 µg total protein). Bands do not stain but can be seen as lighter zones against the background. Lane 2, proteins from TRG8 cells containing no plasmid (25 µl); lane 3, proteins from TRG8 cells containing pQE-hAGT-wild-type (25 µl); lane 4, proteins from cells containing pQE-hAGT-KDC(3–5)-AAA (25 µl); lane 5, proteins from cells containing pQE-hAGT-DCE(4–6)-AAA (25 µl); lane 6, proteins from cells containing pQE-hAGT-EWL(166–168)-AAA (25 µl); lane 7, proteins from cells containing pQE-hAGT-CEM(5–7)-AAA (25 µl); lane 8, AGT proteins from cells containing pQE-hAGT-VKE(164–166)-AAA (25 µl); lane 9, proteins from cells containing pQE-hAGT-KEW(165–167)-AAA (25 µl). Lane 10 contains wild-type AGT purified from XL1-blue E. coli cells (20 µg).
The expression of mutant proteins at different levels prevents direct interpretation of MNNG-protection in terms of AGT function. An alternate approach is to normalize survival and expression values to those found in cells expressing wild-type AGT and to compare these relative values. Thus, relative survival S(rel) = S(mutant)/S(wild-type) where S(mutant) and S(wild-type) are the proportions of mutant and wild-type cells that survive a given MNNG exposure. Similarly, relative expression E(rel) = E(mutant)/E(wild-type) where E(mutant) and E(wild-type) are the relative amounts of AGT detected by western blot as described above. The protection factor P = S(rel)/E(rel) reflects the relative protection afforded by mutant protein expression, corrected for differences in AGT expression between cell populations. Values of S(rel), E(rel) and P are given in Table 3. Measured in this way, mutants KDC(3–5)-AAA and DCE(4–6)-AAA, expressed at levels similar to that of wild-type AGT, gave significantly less protection than the wild-type protein. In contrast, the CEM(5–7)-AAA and VKE(164–166)-AAA mutants were poorly-expressed, but on a molecule-for-molecule basis were nearly as effective in protection as wild-type protein. Mutant KEW(165–167)-AAA) provided less protection than the wild-type protein and mutant EWL(166–168)-AAA gave a protein that was expressed at higher levels, but protected slightly less well than wild-type AGT. Together, these results suggest possible roles for residues K3 and/or D4 and for K165, E166 and/or W167 in protecting cells against MNNG.
DISCUSSION
Previous cross-linking studies showed that AGT residues 1–7 and 163–169 are juxtaposed across an intermolecular protein-interface that is present in AGT-DNA complexes (18). We hypothesized that the interactions of residues in this interface contribute importantly to binding cooperativity (ω) and thus to overall DNA binding affinity (K•ω). We further expected that changes in affinity for DNA would affect DNA repair activities and thus the resistance of cells to alkylating agents. The experiments described here test these hypotheses by examining the consequences of changing AGT residues 3–5, 4–6, 5–7 and 164–166, 165–167 and 166–168 to sets of alanine triplets. We found that these mutations produced proteins with reduced-but-detectable DNA binding cooperativities and affinities, and that expression of these proteins conferred MNNG-resistance on E. coli cells that lack endogenous DNA alkyltransferases. Together, these results confirm that functional determinants of cooperative binding are present within sequence positions 3–7 and 164–168 in the wild-type protein and they strongly support models in which cooperative interactions involving these determinants play key roles in binding affinity and DNA repair.
Alanine is often used in mutagenesis studies because its small side chain interacts minimally with others and is reasonably well tolerated in both hydrophobic and hydrophilic environments (37, 38). However, alanine has a high helix propensity (39, 40) so an AAA substitution in a non-helical region might bias local conformation in favor of helix formation. CD analyses showed that our mutations were either neutral (KDC(3–5)-AAA, CEM(5–7)-AAA and VKE(164–166)-AAA) or reduced net helical content (DCE(4–6)-AAA, KEW(165–167)-AAA and EWL-(166–168)-AAA). Since residues 163–169 form an alpha helix in the isolated protein (16), this result suggests that interactions with surrounding residues can dominate local helix-propensity in this region of AGT. A variety of other data is also consistent with the idea that structural perturbations are focused in the regions immediately surrounding the changed amino acids. The mutant AGT proteins have frictional ratios typical of compact, globular proteins and the uniformity of s20,w values is inconsistent with gross disruption of the native fold by any of these mutations. The retention of DNA binding activity indicates that mutations in the protein-interface do not fatally compromise the fold of the DNA-binding surface. Residual binding cooperativity indicates that the protein-protein interfaces retain structures that allow them to interact with neighboring AGT molecules in spite of the presence of mutations. Finally, the ability of all mutant proteins to provide at least minimal protection against MNNG is most simply explained by the retention of DNA-repair activity that requires a native fold (41).
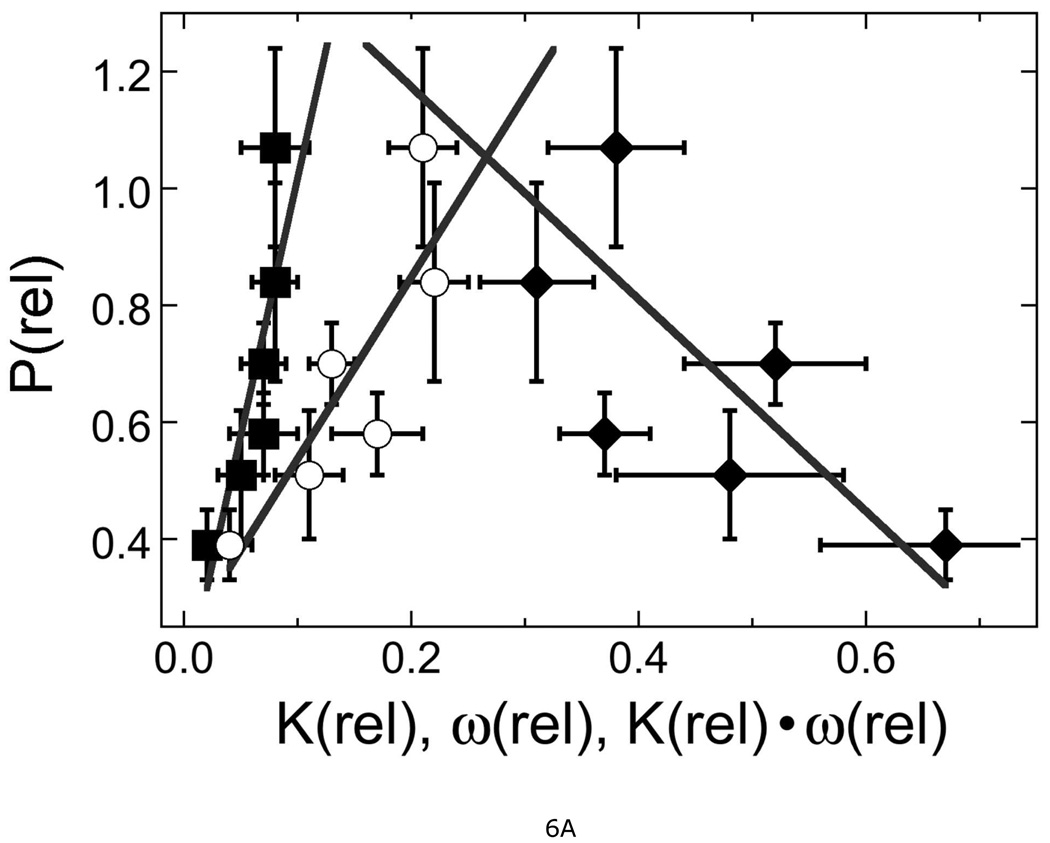
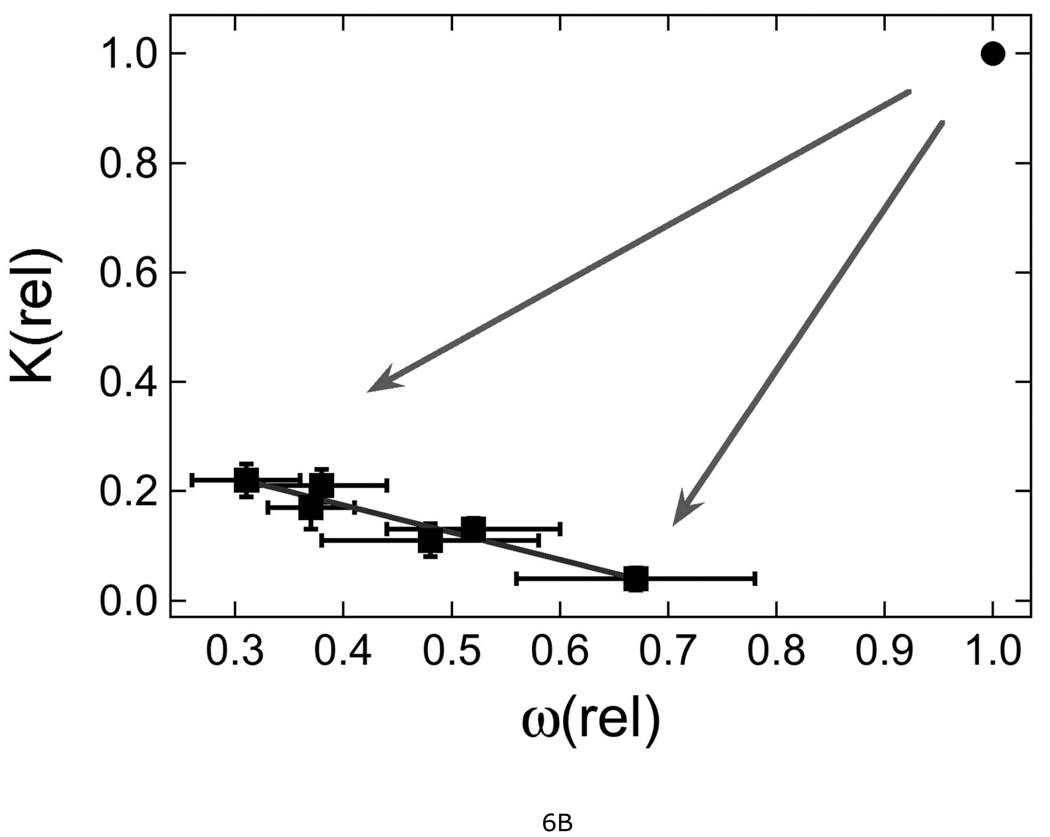
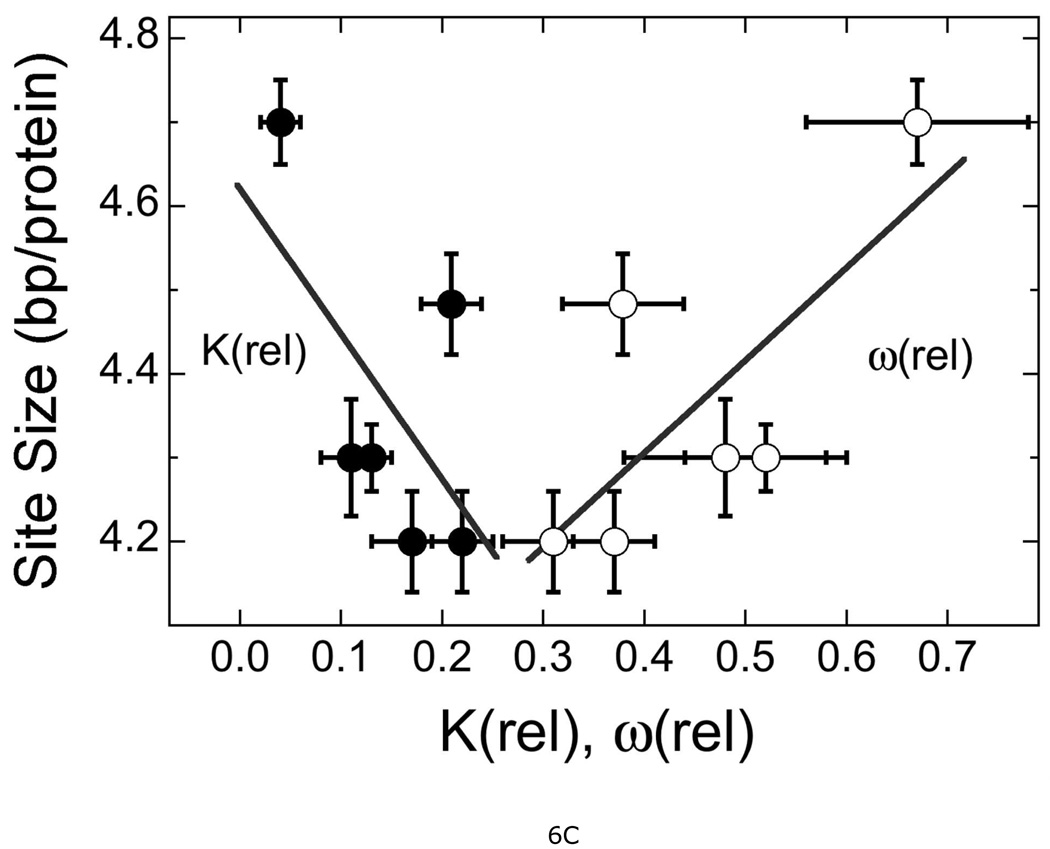
It is striking that mutations in the protein-protein interface reduce DNA association constants with respect to that of wild-type AGT. This result is intriguing because the known DNA-binding surfaces are far from the known protein-interfaces (18). Our mutations include ones that change the N-terminal protein-interaction surface and others that change the C-terminal protein-interaction surface (Fig. 1); although they have similar effects, their locations in different domains argue against a single mechanism coupling conformational changes at the protein-interfaces to ones at the DNA-interface. Instead, we favor a model in which protein-protein interactions help to position AGT monomers so that DNA-binding residues are correctly oriented with respect to their cognate DNA surfaces (18). Mutations that weaken protein contacts should increase conformational degeneracy, either by increasing flexibility at the protein-protein interface or by providing an alternate set of protein-protein interactions. Increased degeneracy at the protein-DNA interface is likely to weaken DNA contacts. This process may account for the reductions in both ω and K (shown in Fig. 6B, arrows) that distinguish the mutants from wild-type protein. In addition to weakening protein-protein interactions, some mutations may distort the protein-interface, repositioning one protein with respect to its neighbor. A repositioning that gives poor juxtaposition of protein and DNA should reduce K; such a mechanism could account for the anti-correlation among values of K and ω shown in Fig. 6B. The correlation of ω with binding site size (Fig. 6C) is consistent with protein-repositioning along the DNA contour as stronger protein-protein interactions increasingly bias binding distributions toward spacings that are optimal for the protein-protein contacts, but not the DNA-protein contacts. We have previously found that wild-type AGT binds relaxed, B-form DNA in preference to supercoiled forms (18) and on these DNAs, the optimal binding periodicity is ~4 bp/protein (15). Larger protein-protein separations are expected to mis-position some AGT molecules with respect to the minor groove of relaxed DNA and thus require DNA unwinding or protein distortion to restore the protein-DNA register. The energetic costs of DNA unwinding and/or protein distortion may account for the decrease of K with increasing binding site shown in Figure 6C. A comparison of DNA bending and twisting by wild-type and mutant proteins will provide an additional test of this protein-repositioning model; measurements needed for this comparison are underway.
Figure 6. Correlations between relative protection, DNA binding constant and cooperativity.
A. Dependence of relative protection P(rel) with relative DNA binding constant K(rel), relative cooperativity ω(rel) and the product K(rel) × ω(rel). P(rel) was calculated from cell survival data obtained with 30 µg/mL MNNG. The lines are linear least squares fits to the data for mutant proteins. Symbols: (■) correlation with K(rel), correlation coefficient R = 0.93; (♦) correlation with ω(rel), R = 0.82; (○) correlation with K(rel) × ω(rel), R = 0.92. B. Correlation of K(rel) with ω(rel). Data from Table 2. The arrows indicate the reduction of both K(rel) and ω(rel) as a result of mutation. The point at K(rel) = 1.0 is that for wild-type protein, for comparison. The line is a least squares fit to the data for mutant proteins, returning R = 0.96. C. Correlation of statistical binding site size with K(rel) and ω(rel). Symbols: (●) correlation with K(rel), R = 0.69; (○) correlation with ω(rel), R = 0.80. The error bars show 95% confidence limits.
How might changes in cooperativity and DNA-binding affinity influence protection from MNNG? In the simplest repair models, AGT binds DNA and induces a conformation change that flips a base into the protein’s active site, where alkyl-transfer takes place (12, 16). If DNA repair within the cell is dominated by binding equilibria, an increase in overall affinity (K•ω) should increase repair efficiency and resistance to MNNG. On the other hand, if stronger binding is a result of reduced dissociation rates, and if repair efficiency is limited by the rate of protein translocation, increasing K or ω may slow protein-exchange between available sites and reduce MNNG-resistance. A correlation plot (Figure 6A) shows that MNNG-resistance increases rapidly with K, less rapidly with K•ω, and decreases with increasing ω. On this basis, our working hypothesis is a hybrid of these limiting models. We propose that repair is enhanced by increasing the equilibrium stability of DNA complexes, but that stabilization by cooperative interactions comes at the cost of slowing AGT’s translocation between binding sites. Comparison of the translocation kinetics of these mutant proteins with those of wild-type AGT would test this feature of our model.
Although cooperative DNA binding has been observed in vitro (14, 15, 18), the roles of cooperativity in the cellular functions of AGT remain to be discovered. AGT’s ability to repair both single-stranded and duplex DNAs (42, 43), and its nearly-identical affinities for DNAs with these secondary structures (14, 15), may be relevant. We propose that protein-protein interactions compensate for the small association constants (K~104 M−1) that accompany the low structural specificity of the protein-DNA interactions. The combination of K•ω produces an aggregate association constant of ~106 M−1 that may be at the low-end of the affinity range compatible with DNA binding in vivo (44). In this scenario, reductions in ω would be expected to cause reductions in overall affinity, DNA repair efficiency and ultimately, the reduction in resistance to MNNG described above. Cooperativity may contribute importantly to the lesion search mechanism as well. AGT binds O6-methylguanine-containing DNAs with affinities that differ little from those for the same sequences containing guanine (22). In one possible search model, access to DNA is controlled by chromatin remodeling, associated with DNA replication (18). Values of AGT’s cooperativity (30 ≤ ω ≤ 150) are sufficient to ensure cooperative binding to open DNA segments of ≤150 bp; this corresponds well with the separation expected of nucleosomes in de-condensed chromatin (45, 46). Because replication is processive, the movement of AGT with the remodeled zone could allow the surveillance of nearly the entire genome. This model predicts that AGT will co-localize with chromatin-remodeling enzymes in the cell and that AGT-mediated repair may be especially concentrated in chromatin regions undergoing DNA replication. Experiments to test these predictions are underway.
This report provides the first evidence, to our knowledge, that mutations affecting the DNA binding cooperativity of AGT can produce changes in cellular resistance to alkylating agents. These findings support the notion that cooperative interactions play an important role in DNA repair by AGT and suggest that the disruption of this cooperativity might be a useful strategy to enhance the efficacy of DNA-alkylating agents used in cancer chemotherapy.
Supplementary Material
ACKNOWLEDGEMENTS
We thank Dr. Anthony Pegg (Penn State University) for the wild-type AGT-expression plasmid and the TRG-8 cells used in these studies. Dr. Manana Melikishvili and Mr. Lance Hellman provided valuable assistance with analytical ultracentrifugation CD spectroscopy. Excellent technical support was provided by Ms. Suzanne Humphreys.
ABBREVIATIONS
- AGT
O6 alkylguanine-DNA alkyltransferase
- MNNG
N-methyl-N'-nitro-N-nitrosoguanidine.
Footnotes
Supported by NIH grant GM-070662 (to M.G.F.)
Supporting Information Available
Table S1: Table of oligonucleotides used in this study.
Table S2: Results of circular dichroism analyses obtained with the CDpro program.
Figure S1: SDS-PAGE analysis of representative AGT preparations.
Figure S2: Circular dichroism spectra of wild-type and mutant AGT proteins.
This material is available free of charge via the Internet at http://pubs.acs.org.
REFERENCES
- 1.Loveless A. Possible relevance of O6 alkylation of dexoyguanosine to the mutagenicity and carcinogenicity of nitrosamines and nitrosamides. Nature (London) 1969;223:206–207. doi: 10.1038/223206a0. [DOI] [PubMed] [Google Scholar]
- 2.Snow ET, Mitra S. Do carcinogen-modified deoxynucleotide precursors contribute to cellular mutagenesis? Cancer Invest. 1987;5:119–125. doi: 10.3109/07357908709018466. [DOI] [PubMed] [Google Scholar]
- 3.Pegg AE. Mammalian O6-alkylguanine-DNA alkyltransferase: regulation and importance in response to alkylating carcinogens and therapeutic agents. Cancer Res. 1990;50:6119–6129. [PubMed] [Google Scholar]
- 4.Margison GP, Santibáñez-Koref MF. O6-Alkylguanine-DNA alkyltransferase: role in carcinogenesis and chemotherapy. BioEssays. 2002;24:255–266. doi: 10.1002/bies.10063. [DOI] [PubMed] [Google Scholar]
- 5.Gerson SL. Clinical relevance of MGMT in the treatment of cancer. J. Clin. Oncol. 2002;20:2388–2399. doi: 10.1200/JCO.2002.06.110. [DOI] [PubMed] [Google Scholar]
- 6.Pegg AE. Repair of O6-alkylguanine by alkyltransferases. Mutat Res. 2000;462:83–100. doi: 10.1016/s1383-5742(00)00017-x. [DOI] [PubMed] [Google Scholar]
- 7.Liu L, Gerson SL. Targeted modulation of MGMT: clinical implications. Clin Cancer Res. 2006;12:328–331. doi: 10.1158/1078-0432.CCR-05-2543. [DOI] [PubMed] [Google Scholar]
- 8.Ranson M, Middleton MR, Bridgewater J, Lee SM, Dawson M, Jowle D, Halbert G, Waller S, McGrath H, Gumbrell L, McElhinney RS, Donnelly D, McMurry TB, Margison GP. Lomeguatrib, a potent inhibitor of O6-alkylguanine-DNA-alkyltransferase: phase I safety, pharmacodynamic, and pharmacokinetic trial and evaluation in combination with temozolomide in patients with advanced solid tumors. Clin Cancer Res. 2006;12:1577–1584. doi: 10.1158/1078-0432.CCR-05-2198. [DOI] [PubMed] [Google Scholar]
- 9.Hegi ME, Liu L, Herman JG, Stupp R, Wick W, Weller M, Mehta MP, Gilbert MR. Correlation of O6-methylguanine methyltransferase (MGMT) promoter methylation with clinical outcomes in glioblastoma and clinical strategies to modulate MGMT activity. J Clin Oncol. 2008;26:4189–4199. doi: 10.1200/JCO.2007.11.5964. [DOI] [PubMed] [Google Scholar]
- 10.Verbeek B, Southgate TD, Gilham DE, Margison GP. O6-Methylguanine-DNA methyltransferase inactivation and chemotherapy. Br. Med. Bull. 2008;85:17–33. doi: 10.1093/bmb/ldm036. [DOI] [PubMed] [Google Scholar]
- 11.Pegg AE, Xu-Welliver M, Loktionova NA. The DNA repair protein O6-alkylguanine-DNA alkyltransferase as a target for cancer chemotherapy. In: M. Ehrlich E, editor. DNA alterations in cancer: genetic and epigenetic changes. Natick, MA: Eaton Publishing; 2000. pp. 471–488. [Google Scholar]
- 12.Tubbs JL, Pegg AE, Tainer JA. DNA binding, nucleotide flipping, and the helix-turn-helix motif in base repair by O6-alkylguanine-DNA alkyltransferase and its implications for cancer chemotherapy. DNA Repair (Amst) 2007;6:1100–1115. doi: 10.1016/j.dnarep.2007.03.011. [DOI] [PMC free article] [PubMed] [Google Scholar]
- 13.Pegg AE. Properties of mammalian O6-alkylguanine-DNA alkyltransferases. Mutation Res. 1990;233:165–175. doi: 10.1016/0027-5107(90)90160-6. [DOI] [PubMed] [Google Scholar]
- 14.Rasimas JJ, Kar SR, Pegg AE, Fried MG. Interactions Of Human O6-Alkylguanine-DNA Alkyltransferase (AGT) With Short Single-Stranded DNAs. J. Biol. Chem. 2007;282:3357–3366. doi: 10.1074/jbc.M608876200. [DOI] [PMC free article] [PubMed] [Google Scholar]
- 15.Melikishvili M, Rasimas JJ, Pegg AE, Fried MG. Interactions of human O6-alkylguanine-DNA alkyltransferase (AGT) with short double-stranded DNAs. Biochemistry. 2008;47:13754–13763. doi: 10.1021/bi801666c. [DOI] [PMC free article] [PubMed] [Google Scholar]
- 16.Daniels DS, Woo TT, Luu KX, Noll DM, Clarke ND, Pegg AE, Tainer JA. DNA binding and nucleotide flipping by the human DNA repair protein AGT. Nat. Struct. Mol. Biol. 2004;11:714–720. doi: 10.1038/nsmb791. [DOI] [PubMed] [Google Scholar]
- 17.Duguid EM, Rice PA, He C. The Structure of the Human AGT Protein Bound to DNA and its Implications for Damage Detection. J. Mol. Biol. 2005;350:657–666. doi: 10.1016/j.jmb.2005.05.028. [DOI] [PubMed] [Google Scholar]
- 18.Adams CA, Melikishvili M, Rodgers DW, Rasimas JJ, Pegg AE, Fried MG. Topologies of complexes containing O6-alkylguanine-DNA alkyltransferase and DNA. J Mol Biol. 2009;389:248–263. doi: 10.1016/j.jmb.2009.03.067. [DOI] [PMC free article] [PubMed] [Google Scholar]
- 19.Altschul SF, Madden TL, Schaffer AA, Zhang J, Zhang Z, Miller W, Lipman DJ. Gapped BLAST and PSI-BLAST: a new generation of protein database search programs. Nucleic Acids Res. 1997;25:3389–3402. doi: 10.1093/nar/25.17.3389. [DOI] [PMC free article] [PubMed] [Google Scholar]
- 20.Pegg AE, Dolan ME, Moschel RC. Structure, function and inhibition of O6-alkylguanine-DNA alkyltransferase. Prog. Nucl. Acid Res. and Mol. Biol. 1995;51:167–223. doi: 10.1016/s0079-6603(08)60879-x. [DOI] [PubMed] [Google Scholar]
- 21.Arakawa T, Ejima D, Tsumoto K, Obeyama N, Tanaka Y, Kita Y, Timasheff SN. Suppression of protein interactions by arginine: a proposed mechanism of the arginine effects. Biophys Chem. 2007;127:1–8. doi: 10.1016/j.bpc.2006.12.007. [DOI] [PubMed] [Google Scholar]
- 22.Rasimas JJ, Pegg AE, Fried MG. DNA-binding mechanism of O6-alkylguanine-DNA alkyltransferase. Effects of protein and DNA alkylation on complex stability. J Biol Chem. 2003;278:7973–7980. doi: 10.1074/jbc.M211854200. [DOI] [PubMed] [Google Scholar]
- 23.Maxam A, Gilbert WS. A new method for sequencing DNA. Proc. Natl. Acad. Sci. U.S.A. 1977;74:560–565. doi: 10.1073/pnas.74.2.560. [DOI] [PMC free article] [PubMed] [Google Scholar]
- 24.McGhee J, von Hippel PH. Theoretical aspects of DNA-protein interactions: co-operative and non-co-operative binding of large ligands to a one-dimensional homogeneous lattice. J. Mol. Biol. 1974;86:469–489. doi: 10.1016/0022-2836(74)90031-x. [DOI] [PubMed] [Google Scholar]
- 25.Tsodikov OV, Holbrook JA, Shkel IA, Record MT., Jr Analytic binding isotherms describing competitive interactions of a protein ligand with specific and nonspecific sites on the same DNA oligomer. Biophys. J. 2001;81:1960–1969. doi: 10.1016/S0006-3495(01)75847-X. [DOI] [PMC free article] [PubMed] [Google Scholar]
- 26.Sreerama N, Woody RW. Estimation of protein secondary structure from circular dichroism spectra: comparison of CONTIN, SELCON, and CDSSTR methods with an expanded reference set. Anal Biochem. 2000;287:252–260. doi: 10.1006/abio.2000.4880. [DOI] [PubMed] [Google Scholar]
- 27.Sreerama N, Woody RW. Computation and analysis of protein circular dichroism spectra. Methods Enzymol. 2004;383:318–351. doi: 10.1016/S0076-6879(04)83013-1. [DOI] [PubMed] [Google Scholar]
- 28.Dam J, Schuck P. Calculating sedimentation coefficient distributions by direct modeling of sedimentation velocity concentration profiles. Methods Enzymol. 2004;384:185–212. doi: 10.1016/S0076-6879(04)84012-6. [DOI] [PubMed] [Google Scholar]
- 29.Schuck P. Size distribution analysis of macromolecules by sedimentation velocity ultracentrifugation and Lamm equation modeling. Biophysical Journal. 2000;78:1606–1619. doi: 10.1016/S0006-3495(00)76713-0. [DOI] [PMC free article] [PubMed] [Google Scholar]
- 30.Laue TM, Shah BD, Ridgeway TM, Pelletier SL. Computer-Aided Interpretation of Analytical Sedimentation Data For Proteins. In: Harding SE, Rowe AJ, Horton JC, editors. Analytical Ultracentrifugation in Biochemistry and Polymer Science. Cambridge, England: The Royal Society of Chemistry; 1992. pp. 90–125. [Google Scholar]
- 31.Crone TM, Kanugula S, Pegg AE. Mutations in the Ada O6-alkylguanine-DNA alkyltransferase conferring sensitivity to inactivation by O6-benzylguanine and 2,4-diamino-6-benzyloxy-5-nitrosopyrimidine. Carcinogenesis. 1995;16:1687–1692. doi: 10.1093/carcin/16.8.1687. [DOI] [PubMed] [Google Scholar]
- 32.Crone TM, Goodtzova K, Pegg AE. Amino acid residues affecting the activity and stability of human O6-alkylguanine-DNA alkyltransferase. Mutation Res. 1996;363:15–25. doi: 10.1016/0921-8777(95)00058-5. [DOI] [PubMed] [Google Scholar]
- 33.Laemmli UK. Cleavage of structural proteins during the assembly of the head of bacteriophage T4. Nature. 1970;227:680–685. doi: 10.1038/227680a0. [DOI] [PubMed] [Google Scholar]
- 34.Burnette WN. "Western blotting": electrophoretic transfer of proteins from sodium dodecyl sulfate--polyacrylamide gels to unmodified nitrocellulose and radiographic detection with antibody and radioiodinated protein A. Anal Biochem. 1981;112:195–203. doi: 10.1016/0003-2697(81)90281-5. [DOI] [PubMed] [Google Scholar]
- 35.Towbin H, Staehelin T, Gordon J. Immunoblotting in the clinical laboratory. J Clin Chem Clin Biochem. 1989;27:495–501. [PubMed] [Google Scholar]
- 36.Crone TM, Pegg AE. A single amino acid change in human O6-alkylguanine-DNA alkyltransferase decreasing sensitivity to inactivation by O6-benzylguanine. Cancer Res. 1993;53:4750–4753. [PubMed] [Google Scholar]
- 37.Faham S, Yang D, Bare E, Yohannan S, Whitelegge JP, Bowie JU. Side-chain contributions to membrane protein structure and stability. J Mol Biol. 2004;335:297–305. doi: 10.1016/j.jmb.2003.10.041. [DOI] [PubMed] [Google Scholar]
- 38.Hristova K, White SH. An experiment-based algorithm for predicting the partitioning of unfolded peptides into phosphatidylcholine bilayer interfaces. Biochemistry. 2005;44:12614–12619. doi: 10.1021/bi051193b. [DOI] [PubMed] [Google Scholar]
- 39.Strehlow KG, Baldwin RL. Effect of the substitution Ala----Gly at each of five residue positions in the C-peptide helix. Biochemistry. 1989;28:2130–2133. doi: 10.1021/bi00431a025. [DOI] [PubMed] [Google Scholar]
- 40.O'Neill KT, Degrado WF. A thermodynamic scale for the helix-forming tendencies of the commonly occurring amino acids. Science. 1990;250:646–651. doi: 10.1126/science.2237415. [DOI] [PubMed] [Google Scholar]
- 41.Rasimas JJ, Dalessio PA, Ropson IJ, Pegg AE, Fried MG. Active-site alkylation destabilizes human O6-alkylguanine DNA alkyltransferase. Protein Sci. 2004;13:301–305. doi: 10.1110/ps.03319404. [DOI] [PMC free article] [PubMed] [Google Scholar]
- 42.Liem LK, Wong CW, Lim A, Li BFL. Factors influencing the repair of the mutagenic lesion O6-methylguanine in DNA by human O6-methylguanine-DNA methyltransferase. J. Mol. Biol. 1993;231:950–959. doi: 10.1006/jmbi.1993.1344. [DOI] [PubMed] [Google Scholar]
- 43.Luu KX, Kanugula S, Pegg AE, Pauly GT, Moschel RC. Repair of oligodeoxyribonucleotides by O6-alkylguanine-DNA alkyltransferase. Biochemistry. 2002;41:8689–8697. doi: 10.1021/bi025857i. [DOI] [PubMed] [Google Scholar]
- 44.Yang SW, Nash HA. Comparison of protein binding to DNA in vivo and in vitro: defining an effective intracellular target. EMBO J. 1995;14:6292–6300. doi: 10.1002/j.1460-2075.1995.tb00319.x. [DOI] [PMC free article] [PubMed] [Google Scholar]
- 45.Blank TA, Becker PB. Electrostatic Mechanism of Nucleosome Spacing. J. Mol. Biol. 1995;252:305–313. doi: 10.1006/jmbi.1995.0498. [DOI] [PubMed] [Google Scholar]
- 46.Schalch T, Duda S, Sargent DF, Richmond TJ. X-ray structure of a tetranucleosome and its implications for the chromatin fibre. Nature. 2005;436:138–141. doi: 10.1038/nature03686. [DOI] [PubMed] [Google Scholar]
- 47.Brown PH, Balbo A, Schuck P. On the analysis of sedimentation velocity in the study of protein complexes. Eur Biophys J. 2009;38:1079–1099. doi: 10.1007/s00249-009-0514-1. [DOI] [PMC free article] [PubMed] [Google Scholar]
Associated Data
This section collects any data citations, data availability statements, or supplementary materials included in this article.


