Abstract
Parallel excitation employs multiple transmit channels and coils, each driven by independent waveforms, to afford the pulse designer an additional spatial encoding mechanism that complements gradient encoding. In contrast to parallel reception, parallel excitation requires individual power amplifiers for each transmit channel, which can be cost-prohibitive. Several groups have explored the use of low-cost power amplifiers for parallel excitation, however, such amplifiers commonly exhibit nonlinear memory effects that distort RF pulses. This is especially true for pulses with rapidly-varying envelopes, which are common in parallel excitation. To overcome this problem, we introduce a technique for parallel excitation pulse design that yields pulses with smoother envelopes. We demonstrate experimentally that pulses designed with the new technique suffer less amplifier distortion than unregularized pulses and pulses designed with conventional regularization.
Introduction
Small, low-cost, low-power amplifiers are currently under investigation for use in parallel transmit arrays (1–6). These amplifiers are an attractive alternative to the larger, more expensive multi-stage amplifiers traditionally used in single-channel transmit, since they afford scalability in the number of transmit channels, and improve power efficiency and decoupling of transmit elements. They can also be flexibly positioned, e.g., on the coils themselves. However, such amplifiers are commonly single-stage and do not possess envelope feedback control. As a result, they exhibit strong envelope memory effects, effectively applying a non-linear low-pass filter to the RF envelope. This is problematic for multidimensional parallel excitation pulses (7–9) that can possess rapidly-varying envelopes that are heavily distorted by the amplifiers.
To overcome envelope memory effects and other distortions, one can use current-sensor feedback to iteratively correct a pulse based on observations of the amplifier’s output at the coil (10). While this and other correction techniques promise to reduce the error between the target and actual amplifier output, to be successful they require that the target pulse be realizable, which may not be the case for pulses designed with conventional parallel pulse design methods. We introduce a new regularization technique for parallel excitation pulse design that improves realizability of the pulses. The regularization is based on a model of how power amplifier envelope memory effects distort the pulses. We demonstrate experimentally that pulses designed with the new regularization are transmitted with higher fidelity than unregularized and conventionally-regularized pulses.
Theory
Regularized parallel RF pulse design
A set of small-tip-angle parallel RF pulses can be designed by solving a regularized least-squares problem such as (9):
| [1] |
where Nc is the number of transmit channels, the vector d contains samples of the desired excitation pattern (flip angle magnitude and magnetization phase), si,j is coil i’s transmit sensitivity at voxel j, and A is a non-uniform discrete Fourier transform matrix (11). Note that throughout this article, lowercase bold variables denote column vectors, while uppercase bold variables denote matrices. The diagonal matrix W = diag (w (x⃗j))2) contains samples of the excitation error weighting function w (x⃗). In this work, w (x⃗) is constructed to achieve maximum pass- and stopband flip angle ripple levels set by the pulse designer (12). The regularization parameter β balances excitation accuracy, as quantified by the first term in the cost function of Eq. [1], with an undesirable quality that is quantified by the regularization function R (b1, …, bNc).
Conventionally, for ease of implementation Tikhonov regularization is used so that R (b1, …, bNc) is a convex, quadratic function of the pulses. For example, excitation error can be balanced with integrated RF power using (7, 9):
| [2] |
Local RF magnitude can be controlled using (11):
| [3] |
where Λi = diag (λi,j) are regularization parameters that control the magnitude of individual RF samples. Alternatively, excitation error can be balanced with pulse roughness using:
| [4] |
where R is a first or second order finite differencing matrix whose rows contain shifted copies of the vectors (first order) or (second order). This regularizer encourages smoothness in both real and imaginary parts of the pulses, and will be referred to as complex roughness regularization. The case β = 0 corresponds to an unregularized problem, which will be referred to as minimum excitation error pulse design.
Automatic regularization parameter selection
This work compares the effectiveness of regularization strategies for parallel RF pulse design. To ensure a fair comparison, all designed pulses should meet the same excitation accuracy requirement while minimizing their respective regularization functions. Meeting these conditions involves selecting regularization parameters β so that the excitation error term in Eq. [1] is approximately the same in each case. Alternatively, the problem of minimizing the regularization function while maintaining a given accuracy level can be stated as the following optimization problem:
| [5] |
where δ is the maximum flip angle ripple allowed, and may be different in the pass- and stopbands, and Ns is the number of points in the design grid. When R (b1, …, bNc) is quadratic, Eq. [5] is a quadratic program (13). Solving this problem with the regularization function of Eq. [2] yields minimum integrated power pulses; using the complex roughness regularization function of Eq. [4] yields minimum complex roughness pulses.
One straightforward method to obtain an approximate solution to Eq. [5] is given by the following algorithm:
-
Step 1
Solve Eq. [1] for .
-
Step 2Check if the pulse set is sufficiently accurate:
[6] If yes: exit.
If no: decrement β, go to Step 1.
β is initialized to a large value that is guaranteed to yield pulses that fail Step 2, and is decremented by dividing it with a constant value greater than one. In general, pulse design via the optimization problem in Eq. [5] is attractive since it obviates the need to select a regularization parameter, albeit at the cost of increased computation time.
Power amplifier envelope memory effects
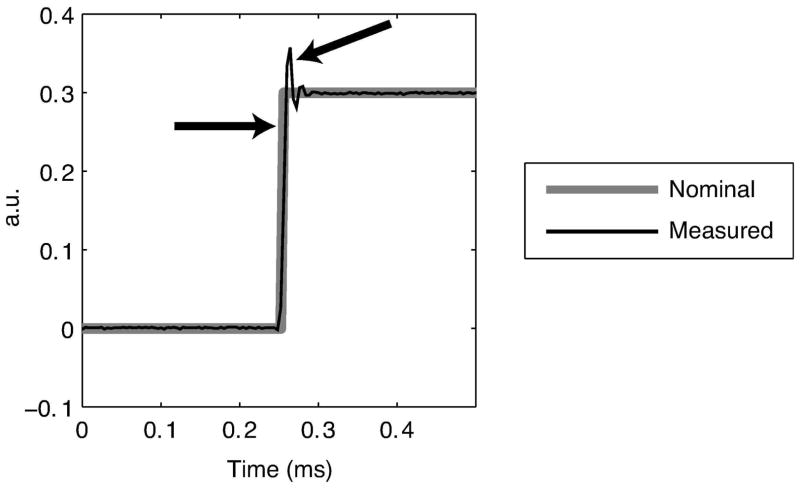
Ideally, the output voltage of a power amplifier used for RF excitation is equal to the input multiplied by a complex (i.e., amplitude and phase) gain factor. In reality, due to power amplifier memory effects, the output is a distorted, nonlinear function of the input. Figure 1 shows an example of the distortion incurred for a step pulse, measured for one channel of a parallel transmit array using current sensors on the coil, which was driven by a 300 W power amplifier (system described further in Methods). As indicated in the figure, the amplifier outputs trail, over- and undershoot the nominal outputs. These distortions occur because the amplifier was unable to track rapid changes in the RF envelope. Such distortions are collectively known as power amplifier memory effects. Power amplifier memory effects are low-pass in nature, and arise due to non-ideal device physics such as thermal hysteresis and semiconductor trapping effects, as well as amplifier bias fluctuations resulting from limited power supply and bias circuitry bandwidth (14).
Figure 1.
Examples of RF power amplifier-induced envelope distortion. The current measured in a coil driven by a 300 W amplifier both trails and overshoots the nominal waveform at the step.
There are two main types of distortion models that have been explored in the power amplifier literature (15, 16): physical models that are based on the individual electronic elements comprising the amplifier, and behavioral models that treat the amplifier as a black box and may be developed using system identification techniques. In this work, to maintain generality we adopt a simple behavioral convolution-based power amplifier model. For a (sampled) ideal output RF waveform b[n], we model the actual amplifier output b̃[n] as:
| [7] |
where h[n] is the amplifier’s (causal) envelope low-pass impulse response of length L, which may be complex-valued, and b[n] is zero for n < 0. We assume without loss of generality that h[n] is scaled so that it sums to one, or equivalently, so that it’s DC Fourier coefficient is one. This model corresponds to an extension of a Hammerstein amplifier model (comprised of a nonlinearity followed by a linear filter), with polynomial order one (17–19). Note that Eq. [7] does not account for instantaneous AM/AM and AM/PM nonlinearities that can be significant in the amplifiers of interest for parallel excitation; we implicitly assume that these effects are either negligible or have been compensated using a lookup table or equivalent strategy to preemphasize the RF prior to amplification. The experiments presented in this work used lookup table preemphasis to compensate instantaneous nonlinearities.
Envelope roughness regularization
Given the model (Eq. [7]) of the nonlinear behavior of the power amplifiers employed in parallel excitation systems, it is desirable to design accurate parallel RF pulses that suffer the least amplifier-induced distortion possible, or equivalently, whose envelopes lie within the passband of the low-pass filter h[n]. To quantify distortion, the difference between a target and actual amplified pulse is examined:
| [8] |
where δ [n] is a Kronecker delta function, and hr[n] = δ [n] − h[n] is a high-pass envelope regularization filter that will be used for pulse design. The mean-squared waveform error across all transmit channels is proportional to:
| [9] |
where Nt is the pulse length in samples, and Ri is a convolution matrix whose rows contain shifted versions of . Because the are high-pass filters (where each is a vector in time), Eq. [9] is a measure of the total envelope roughness across transmit channels. Note that each channel may have a unique regularization filter. Equation [9] can be used as a regularization function R (b1, …, bNc) to design accurate pulses that suffer minimal amplifier distortion; solving Eq. [5] with this substitution yields minimum envelope roughness pulses.
To design minimum envelope roughness pulses, the envelope roughness-regularized pulse design problem (Eq. [1] with Eq. [9] substituted) must be solved. However, this problem is non-convex because Eq. [9] is a non-convex function of the pulses . To solve it, an auxiliary conjugate phase vector φi is defined for each transmit channel i, and a series of convex optimization problems is solved according to the following algorithm:
-
Step 1Set k:= 1 and:
[10] -
Step 2Solve the following problem for :
[11] -
Step 3Update the conjugate phase vectors:
[12] -
Step 4
Set k:= k + 1, go to Step 2.
The following sections describe experiments demonstrating that minimum envelope roughness parallel excitation pulses designed with the regularization function in Eq. [9] suffer reduced amplifier-induced distortions compared to unregularized (minimum excitation error) and minimum complex roughness pulses.
Experimental Methods
Parallel excitation system
Imaging was performed on a GE 1.5 T Signa Excite scanner (GE Healthcare, Waukesha, WI, USA). The parallel excitation system was comprised of Nc = 4 surface coils driven by in-house built 300W MOSFET push-pull linear class AB power amplifiers. A vector-modulator system was used to modulate a hard pulse provided by the scanner with each transmit channel’s RF waveform (20). Signal vector decoupling (21, 22) was used to decouple the array elements, and lookup table AM/AM and AM/PM correction and vector iterative predistortion (10) were applied to reduce amplifier distortions prior to imaging the excitation patterns. The post-correction pulses were measured for error calculation and comparison. A 12 cm 1% CuSO4 in H2O disk phantom was used to simplify imaging by obviating slice-selection. maps (dimensions 64×64, Ns = 4096) were measured in the phantom using a multi-tip magnetization preparation-based technique (23), and a field map (ΔB0) was measured using two images acquired with a small TE difference (24). Figure 2 shows the magnitude of the maps, and the ΔB0 map. The ΔB0 map was incorporated into the system matrix A for pulse design (9). The maps are well-localized to the coil locations on the top, left, bottom and right of the phantom, indicating that good decoupling was achieved.
Figure 2.
magnitude maps for 4 coils and the ΔB0 map measured on a 12cm disk phantom. The maps are notched at the top of the phantom due to an air bubble.
Regularization filter measurement
Prior to pulse design and imaging, the actual envelope regularization filter was measured for each amplifier in the array. Using coil current sensors to receive, 160 cosine pulses with frequencies distributed uniformly between DC and 125 kHz, and duration 2 ms were played through each channel while simultaneously recording the current sensor output. Invoking the envelope distortion model (Eq. 7), each amplifier’s envelope impulse response hi (15 sample length) was obtained using a least-squares fit to the measurements, and was calculated from that. The measured filters were normalized for sinc spectral weighting imparted by the digital-to-analog converter.
Pulse design and excitation pattern imaging
The target excitation pattern for pulse design was a 3.4 cm square passband with flip angle 15°. The maximum passband ripple was set to 0.59° and the maximum stopband ripple was 0.145°, i.e., 4 times lower in the stopband. These parameters and the excitation trajectory bandwidth yielded a transition region between the square passband and the stopband with a width of 0.757 cm (12). The square placement and bandwidths are illustrated in Fig. 3, which shows the excitation error weighting function w (x⃗) for pulse design. The excitation trajectory was a 6-turn spiral-in with a resolution of 0.5 cm, an excitation FOV of 6 cm (2× acceleration), a maximum slew rate of 14.5 G/cm/ms, and a 3.25 ms duration (Nt = 813). Prior to pulse design, the trajectory was measured using the method of Ref. (25), and all pulses were designed on the measured trajectory.
Figure 3.
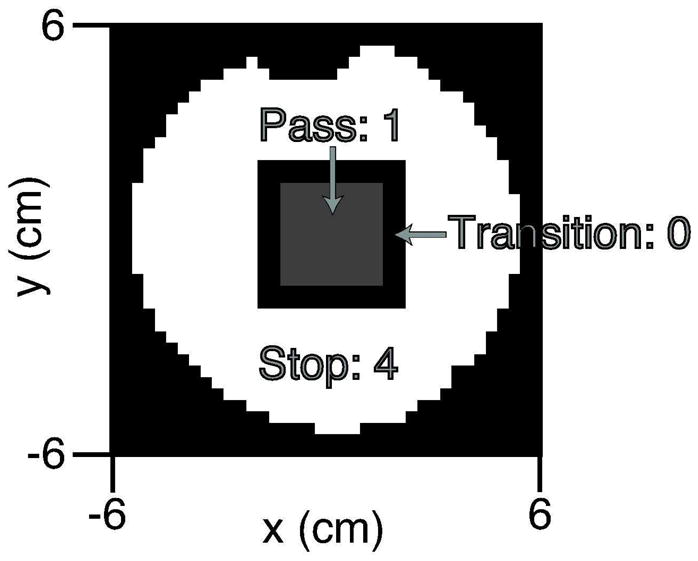
Excitation error weighting w (x⃗) used in pulse design.
Three sets of pulses were designed. The first was a set of minimum excitation error pulses, designed with β = 0. The second was a set of minimum complex roughness pulses, designed with a first-order finite difference regularization filter. This set was included because minimum complex roughness pulse design will likely yield the smoothest envelopes possible with conventional Tikhonov regularization. The third set of pulses were minimum envelope roughness pulses, designed using the same first-order finite difference regularization filter as in the minimum complex roughness case, for all channels. This filter was chosen because it is compact, and as will be shown, it is a good approximation to the measured . To ensure a fair comparison between these pulse sets, each time β was decremented, the Conjugate Gradient (CG) iterations were re-initialized with zero pulses. This way, each pulse set was designed with a total of 1000 CG iterations. In practice, one could reduce computation time significantly by reducing the number of CG iterations per β value and initializing the CG iterations for each β value with the pulses yielded by the previous value. A non-uniform Fast Fourier Transform algorithm (26) was used to compute products with the matrix A. β was initialized to 0.005 for the minimum roughness sets, and was decremented via division by 1.2 at each outer iteration. In the minimum envelope roughness case, the CG algorithm was interrupted every 100 iterations to update the conjugate phase vectors . Because the CG algorithm’s search direction was lost in this interruption, to ensure a fair comparison the algorithm was also interrupted every 100 iterations in designing the other two sets.
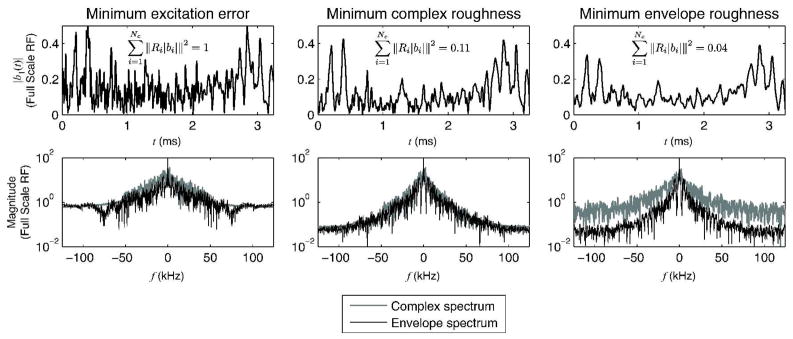
Table 1 lists the simulated peak passband/stopband ripples and weighted mean-squared excitation error (MSEE) (equal to the excitation error term in Eq. [1]) for each pulse set. Figure 4 plots coil 1’s pulse and indicates the mean-squared envelope roughness of each set, normalized by that of the minimum excitation error set. The minimum complex roughness set has a mean-squared envelope roughness that is 11% that of the minimum excitation error set, and the minimum envelope roughness set has a mean-squared envelope roughness that is 4% that of the minimum excitation error set. Figure 4 also shows that minimum envelope roughness pulse design can produce pulses with wide complex spectrums, while reducing energy in the high frequencies of the envelopes’ spectrums.
Table 1.
Simulated excitation error metrics for each pulse set.
| Metric | Min. exc. error | Min. comp. rough. | Min. env. rough. |
|---|---|---|---|
| Peak passband ripple | 0.537° | 0.585° | 0.584° |
| Peak stopband ripple | 0.131° | 0.142° | 0.142° |
| Weighted MSEE | 0.00256 | 0.00323 | 0.00321 |
| RMS stopband error | 0.0397° | 0.0447° | 0.0445° |
Figure 4.
Coil 1’s pulse for each design case. (Top row) The minimum envelope roughness pulse has the smoothest envelope, and the set achieves the lowest mean-squared roughness. (Bottom row) The minimum complex roughness pulse has reduced energy in the high frequencies of both its complex spectrum and its envelope spectrum, compared to the minimum excitation error set. The minimum envelope roughness pulse’s complex spectrum has a similar energy distribution to the minimum excitation error pulse, but its envelope spectrum is dramatically reduced at high frequencies, and is narrower than that of the minimum complex roughness pulse.
Excitation patterns were imaged using a 2DFT GRE sequence (128×128 matrix, TE = 7 ms, TR = 500 ms, 4 NEX). Reception was performed with an 8-channel cardiac array, and the reconstructed images were combined via sum-of-squares (27). Excitation patterns were obtained by dividing each acquired image by a polynomial fit (S (x⃗)) to a uniform excitation image in order to remove image intensity variations introduced by the receive coils, and were normalized to possess mean passband magnitudes equal to the target flip angle of 15°. To compare the excitation accuracy across pulse sets, the RMS stopband excitation error was calculated for each pulse set, and was defined for an excitation pattern E (x⃗) as:
| [13] |
where m (x⃗) is a binary stopband mask, and σ̂ is an estimate of the noise standard deviation, measured from spatial locations outside the phantom. RMS stopband excitation error is a natural distortion measure for pulse comparison, since stopband excitation is the MR imaging equivalent of spectral leakage, the minimization of which is a central goal of power amplifier modeling. The simulated RMS stopband excitation errors (calculated using Eq. [13] with S (x⃗) = 1 and σ̂ = 0) for each pulse set are listed in Table 1. The experimental weighted mean-squared excitation error for each pulse set was measured, defined as the excitation error term in Eq. [1] with noise normalization in analogy to the stopband RMS error calculation. Experimental peak passband and stopband ripples were also calculated for each pulse set, as the average of the five largest absolute errors to reduce the influence of noise.
Experimental Results
Regularization filter measurement
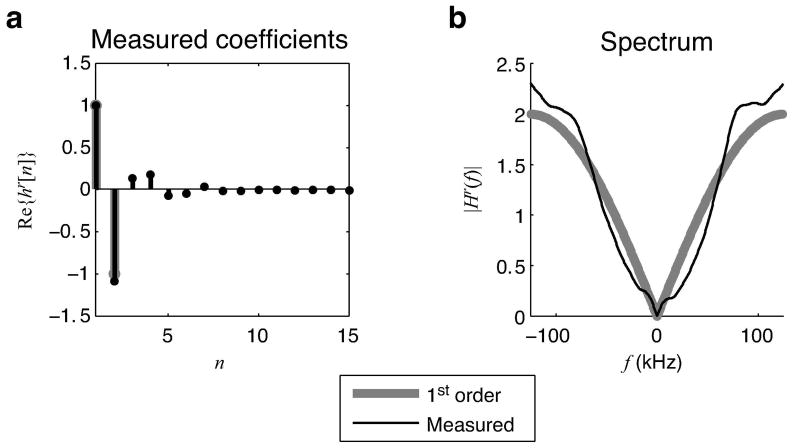
Figure 5 shows the measured regularization filter and its frequency response for one amplifier in the parallel transmit array. The measured filter coefficients and spectrum are close to those of the first-order finite differences filter used in the imaging experiments, validating that filter choice. Similar filters were measured for all amplifiers in the array.
Figure 5.
(a,b) The real part of the coefficients and the magnitude spectrum of the measured regularization filter for one transmit channel closely match the first order finite differences filter, suggesting that the latter is a reasonable choice for envelope roughness regularization. The imaginary part of the measured filter was negligible, with a peak value of 0.0231.
Pulse measurement
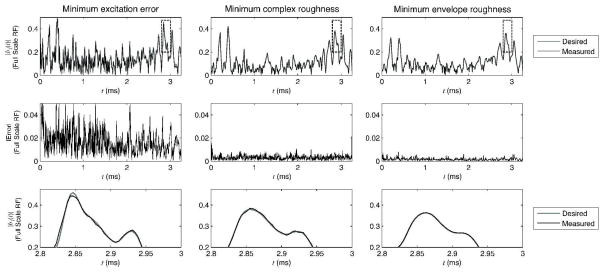
Figure 6 shows the pulse envelopes and complex error magnitude for one transmit channel, measured using coil current sensors. The minimum envelope roughness pulses achieve the lowest error, with an RMSE across transmit channels of 0.0046, while the minimum excitation error and minimum complex roughness pulses achieve RMSE’s of 0.11 and 0.0083, respectively.
Figure 6.
Comparison of RF fidelity for one transmit channel. The top row shows the measured envelopes superimposed on desired envelopes. The middle row plots the magnitude of the complex differences between desired and measured pulses, which are largest for the minimum excitation error pulse, and smallest for the minimum envelope roughness pulse. The bottom row shows the zoomed region outlined by the dashed boxes in the top row. The measured minimum excitation error and minimum complex roughness pulses both contain visible under- and overshoots, while the measured minimum envelope roughness pulse most closely tracks its desired envelope.
Excitation pattern imaging
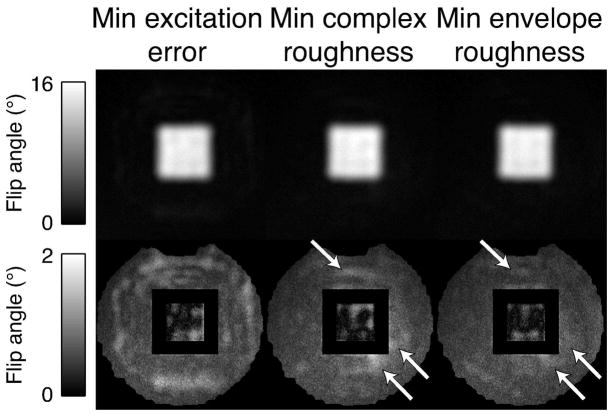
Figure 7 shows excitation patterns acquired with each pulse set; the measured peak pass-band/stopband ripples, weighted mean-squared excitation errors and RMS stopband excitation errors for each set are listed in Table 2. Rapid variations in the envelopes of the minimum excitation error pulses are not tracked accurately by the RF amplifiers, resulting in significant excitation error that is most easily visualized in the stopband outside the excited square. In comparison, the smoother envelopes of the minimum complex roughness pulses are easier for the amplifiers to track, resulting in a 21.1% lower RMS stopband excitation error in that case. The minimum envelope roughness set achieves the lowest RMS stopband error, 39.1% lower than that of the minimum excitation error pulses. A pattern acquired with minimum envelope roughness pulses designed using the measured regularization filter (not shown) achieved a stopband RMS signal decrease of 33.3%, a mean-squared excitation error of 2.20, and peak passband/stopband ripples of 1.03°/1.28°.
Figure 7.
Top row: Excitation patterns acquired with minimum excitation error pulses, minimum complex roughness pulses, and minimum envelope roughness pulses. Bottom row: excitation errors, masked by passband and stopband masks. The minimum envelope roughness set achieves the lowest RMS stopband excitation error; white arrows indicate areas with significant error reductions compared to the minimum complex roughness pattern.
Table 2.
Experimental excitation error metrics for each pulse set.
| Metric | Min. exc. error | Min. comp. rough. | Min. env. rough. |
|---|---|---|---|
| Peak passband ripple | 1.41° | 1.23° | 1.11° |
| Peak stopband ripple | 1.59° | 1.70° | 1.29° |
| Weighted MSEE | 4.98 | 3.15 | 1.83 |
| RMS stopband error | 0.418° | 0.330° | 0.255° |
Discussion and Conclusions
Numerical optimization-based pulse design methods are currently favored for designing multidimensional parallel excitation pulses. However, as was demonstrated experimentally, without regularization these methods can produce pulses with highly oscillatory envelopes that suffer significant distortion when played through amplifiers that exhibit strong envelope memory effects. The goal of this work was to introduce and validate a model-based regularization approach, minimum envelope roughness pulse design, that mitigates envelope memory effects. Minimum envelope roughness pulse design uses a regularization function constructed from a power amplifier envelope distortion model comprised of a nonlinear envelope detection stage, followed by a filtering stage. It was demonstrated experimentally that minimum envelope roughness pulses are transmitted with significantly higher fidelity, and excite patterns with significantly lower stopband signal, compared to both unregularized (minimum excitation error) parallel excitation pulses and minimum complex roughness pulses designed using conventional quadratic regularization.
The most common form of regularization currently in use in parallel excitation pulse design is integrated power regularization (implemented by Eq. [2]). Compared to minimum excitation error pulses, one would expect this form of regularization to reduce envelope roughness somewhat. To test this, minimum integrated power pulses were also designed for our experimental scenario (results not shown). The pulses possessed a mean-squared envelope roughness that was 65% that of the minimum excitation error pulses. While this is a significant reduction in envelope roughness, it is a much larger roughness than that achieved by either minimum complex roughness (11%) or minimum envelope roughness (4%) pulses. Therefore, while minimum integrated power pulses should suffer less amplifier-induced distortion than minimum excitation error pulses, it is likely that they would still incur significantly higher excitation error than minimum complex roughness and minimum envelope roughness pulses.
Experimental results were presented for a representative acceleration factor of two for a four channel transmit array, and in this configuration it was found that the proposed regularization resulted in large improvements in both measured pulse fidelity and excitation pattern accuracy. As with any regularization technique, for a given desired level of excitation accuracy, the impact of envelope roughness regularization will vary with acceleration factor, or equivalently, with the degree to which the pulse design problem is underdetermined. For example, at a very high acceleration factor of four for this array, the target excitation accuracy cannot be achieved, so little is to be gained by envelope roughness or any other form of regularization (results not shown). Conversely, for a minimum acceleration factor of one, the pulse design problem is very underdetermined, so the proposed regularization reduces envelope roughness to 0.22% that of unregularized minimum excitation error pulses, which is a much larger reduction in envelope roughness than that seen at 2× acceleration.
As an alternative to regularization, one could incorporate waveform distortion into the RF excitation model; this would be equivalent to pre-emphasizing the RF to overcome distortion. This approach was not taken here because it would complicate the forward system model for parallel excitation and preclude the use of a ‘linear’ Conjugate Gradient algorithm for RF design, and because it may require more rigorous amplifier modeling than the regularization approach to mitigate distortion effectively.
It was shown experimentally that first-order finite differences are a reasonable choice of regularization filter under the distortion model for the parallel transmit amplifiers used in this work. Good correspondence of measured regularization filters with first-order finite differences is an interesting result, as these filters do not penalize the instantaneous polarity changes in the envelope’s first derivative that occur at zero-crossings in the real and imaginary components of an RF waveform, any more than they penalize other time points with the same first derivative magnitude. This is significant because zero crossings are prevalent in commonly-used RF pulses, such as sinc pulses. A measured regularization filter that heavily penalized these features (for example, second-order finite differences) would be a counter-intuitive result, as it would suggest that the amplifiers employed in MRI perform poorly when amplifying the most commonly-used pulses. It was found that minimum envelope roughness pulses designed using measured regularization filters incurred higher stop-band RMS and mean-squared excitation errors than minimum envelope roughness pulses designed with first-order finite differences (though the errors were still significantly lower than for minimum complex roughness and minimum excitation error pulses, and the peak passband/stopband ripples were slightly lower than those of the first-order finite difference-based minimum envelope roughness pulses). This counter-intuitive result can be partially explained by differences in simulated mean-squared excitation error: pulses designed using the measured filters incurred a somewhat higher simulated error of 0.00344, compared to 0.00321 for first-order finite differences. The cause could also have been physical in nature, such as differences in amplifier heating between regularization filter measurement and imaging.
Minimum envelope roughness RF pulse design will be most useful in designing two-dimensional parallel excitation pulses, particularly when amplifiers lacking envelope feedback are used. However, it may find applications in other imaging scenarios that use pulses with rapidly-varying envelopes, such as RF encoding (28). The method can also be extended to optimal control-based large tip angle parallel excitation pulse designs (29, 30).
Acknowledgments
Support
This work was supported by NIH grants R01 EB008108, R21 EB007715, and R01 EB005307.
References
- 1.Scott GC, Overall W, Pauly JM, Stang P, Kerr AB. A vector modulation transmit array system. Proceedings 14th Scientific Meeting, International Society for Magnetic Resonance in Medicine; Seattle. 2006. p. 128. [Google Scholar]
- 2.Nam H, Grissom WA, Wright SM. Application of RF current sources in transmit SENSE. Proceedings 14th Scientific Meeting, International Society for Magnetic Resonance in Medicine; Seattle. 2006. p. 2562. [Google Scholar]
- 3.Heilman JA, Gudino N, Riffe MJ, Vester M, Griswold MA. Preamp-like decoupling and amplitude modulation in CMCD amplifiers for transmit arrays. Proceedings 16th Scientific Meeting, International Society for Magnetic Resonance in Medicine; Toronto. 2008. p. 1097. [Google Scholar]
- 4.Gudino N, Heilman J, Riffe M, Flask C, Griswold MA. 7T current-mode class-D (CMCD) RF power amplifier. Proceedings 17th Scientific Meeting, International Society for Magnetic Resonance in Medicine; Honolulu. 2009. p. 397. [Google Scholar]
- 5.Gudino N, Heilman J, Griswold MA. High-bandwidth, high-efficiency RF amplitude modulation for on-board transmit amplifiers. Proceedings 17th Scientific Meeting, International Society for Magnetic Resonance in Medicine; Honolulu. 2009. p. 4769. [Google Scholar]
- 6.Lee W, Boskamp E, Grist T, Kurpad KN. Transmit B1 field pattern control using RF current source technique. Proceedings 17th Scientific Meeting, International Society for Magnetic Resonance in Medicine; Honolulu. 2009. p. 399. [DOI] [PubMed] [Google Scholar]
- 7.Katscher U, Börnert P, Leussler C, van den Brink JS. Transmit SENSE. Magn Reson Med. 2003 Jan;49(1):144–150. doi: 10.1002/mrm.10353. [DOI] [PubMed] [Google Scholar]
- 8.Zhu Y. Parallel excitation with an array of transmit coils. Magn Reson Med. 2004 Apr;51(4):775– 784. doi: 10.1002/mrm.20011. [DOI] [PubMed] [Google Scholar]
- 9.Grissom WA, Yip CY, Zhang Z, Stenger VA, Fessler JA, Noll DC. Spatial domain method for the design of RF pulses in multicoil parallel excitation. Magn Reson Med. 2006 Sep;56(3):620–9. doi: 10.1002/mrm.20978. [DOI] [PubMed] [Google Scholar]
- 10.Stang P, Kerr AB, Grissom WA, Pauly JM, Scott GC. Vector iterative pre-distortion: An auto-calibration method for transmit arrays. Proceedings 17th Scientific Meeting, International Society for Magnetic Resonance in Medicine; Honolulu. 2009. p. 395. [Google Scholar]
- 11.Yip CY, Fessler JA, Noll DC. Iterative RF pulse design for multidimensional, small-tip-angle selective excitation. Magn Reson Med. 2005 Oct;54(4):908–917. doi: 10.1002/mrm.20631. [DOI] [PubMed] [Google Scholar]
- 12.Grissom WA, Kerr AB, Holbrook AB, Pauly JM, Butts-Pauly K. Maximum linear-phase spectral-spatial radiofrequency pulses for fat-suppressed proton resonance frequency-shift MR thermometry. Magn Reson Med. 2009;62(5):1242–1250. doi: 10.1002/mrm.22118. [DOI] [PMC free article] [PubMed] [Google Scholar]
- 13.Boyd S, Vandenberghe L. Convex Optimization. Cambridge; Cambridge, UK: 2004. [Google Scholar]
- 14.Cripps SC. RF Power Amplifiers for Wireless Communications. 2. Artech House, Inc; Norwood, MA: 2006. [Google Scholar]
- 15.Isaksson M, Wisell D, Rönnow D. A comparative analysis of behavioral models for RF power amplifiers. IEEE Trans Microw Theory Tech. 2006;54(1):348–359. [Google Scholar]
- 16.Pedro JC, Maas SA. A comparative overview of microwave and wireless power-amplifier behavioral modeling approaches. IEEE Trans Microw Theory Tech. 2005;53(4):1150–1163. [Google Scholar]
- 17.Ibanez-Diaz J, Pantaleon C, Santamaria I, Fernandez T, Martinez D. Nonlinearity estimation in power amplifiers based on subsampled temporal data. IEEE Trans Inst Meas. 2001;50(4):882–887. [Google Scholar]
- 18.Baudoin G, Jardin P, Marsalek R. Power amplifier linearisation using pre-distortion with memory. 13th International Czech-Slovak Scientific Conference RADIOELEKTRONIKA; Citeseer. 2003. pp. 193–196. [Google Scholar]
- 19.Jeruchim MC, Balaban P, Shanmugan KS. Simulation of Communication Systems, Second Edition: Modeling, Methodology and Techniques. New York: Plenum; 2000. [Google Scholar]
- 20.Stang P, Kerr AB, Pauly JM, Scott GC. An extensible transmit array system using vector modulation and measurement. Proceedings 16th Scientific Meeting, International Society for Magnetic Resonance in Medicine; Toronto. 2008. p. 145. [Google Scholar]
- 21.Kerr AB, Grissom WA, Stang P, Scott GC, Pauly JM. B1 mapping and parallel excitation using vector decoupling. Proceedings 17th Scientific Meeting, International Society for Magnetic Resonance in Medicine; Honolulu. 2009. p. 2618. [Google Scholar]
- 22.Scott GC, Stang P, Kerr AB, Pauly JM. General signal vector decoupling for transmit arrays. Proceedings 16th Scientific Meeting, International Society for Magnetic Resonance in Medicine; Toronto. 2008. p. 146. [Google Scholar]
- 23.Kerr AB, Watkins R, Giaquinto R, Pauly JM, Zhu Y, Cunningham C. Rapid slice-selective B1 mapping for transmit SENSE. Proceedings 16th Scientific Meeting, International Society for Magnetic Resonance in Medicine; Toronto. 2008. p. 355. [Google Scholar]
- 24.Schneider E, Glover G. Rapid in vivo proton shimming. Magn Reson Med. 1991 Apr;18(2):335–347. doi: 10.1002/mrm.1910180208. [DOI] [PubMed] [Google Scholar]
- 25.Duyn JH, Yang Y, Frank JA, van der Veen JW. Simple correction method for k-space trajectory deviations in MRI. J Magn Reson. 1998;132(1):150–153. doi: 10.1006/jmre.1998.1396. [DOI] [PubMed] [Google Scholar]
- 26.Fessler JA, Sutton BP. Nonuniform fast Fourier transforms using min-max interpolation. IEEE Trans Sig Proc. 2003;51(2):560–574. [Google Scholar]
- 27.Roemer PB, Edelstein WA, Hayes CE, Souza SP, Mueller OM. The NMR phased array. Magn Reson Med. 1990 Nov;16(2):192–225. doi: 10.1002/mrm.1910160203. [DOI] [PubMed] [Google Scholar]
- 28.Kyriakos WE, Hoge WS, Mitsouras D. Generalized encoding through the use of selective excitation in accelerated parallel MRI. NMR Biomed. 2006 May;19(3):379–392. doi: 10.1002/nbm.1047. [DOI] [PubMed] [Google Scholar]
- 29.Xu D, King KF, Zhu Y, McKinnon GC, Liang Z-P. Designing multichannel, multidimensional, arbitrary flip angle RF pulses using an optimal control approach. Magn Reson Med. 2008;59(3):547–560. doi: 10.1002/mrm.21485. [DOI] [PMC free article] [PubMed] [Google Scholar]
- 30.Grissom WA, Xu D, Kerr AB, Fessler JA, Noll DC. Fast large-tip-angle multidimensional and parallel RF pulse design in MRI. IEEE Trans Med Imag. 2009 Oct;28(10):1548–1559. doi: 10.1109/TMI.2009.2020064. [DOI] [PMC free article] [PubMed] [Google Scholar]


