

Abstract
Precise regulatory mechanisms are required to appropriately modulate the cellular levels of transcription factors controlling cell fate decisions during blood cell development. Here, we show that miR-126 is a novel physiological regulator of the proto-oncogene c-myb during definitive hematopoiesis. We show that knockdown of miR-126 results in increased c-Myb levels and promotes erythropoiesis at the expense of thrombopoiesis in vivo. We further provide evidence that specification of thrombocyte versus erythrocyte cell lineages is altered by the concerted activities of the miRNAs miR-126 and miR-150. Both microRNAs are required but not sufficient individually to precisely regulate the cell fate decision between erythroid and megakaryocytic lineages during definitive hematopoiesis in vivo. These results support the notion that microRNAs not only act to provide precision to developmental programs but also are essential determinants in the control of variable potential functions of a single gene during hematopoiesis.
Keywords: miR-126, miR-150, c-myb, thrombocyte, hematopoiesis, zebrafish
Introduction
The determination of hematopoietic lineages heavily relies upon regulation at the transcriptional level, and the functional roles of many transcription factors that are essential for hematopoietic specification have been well established. 1–4 Throughout hematopoietic development, the cellular levels of these transcription factors undergo dynamic changes that affect lineage specification as well as the proliferation and maturation of a given cell type 5. The c-Myb protein is a major hematopoietic transcription factor whose levels must be precisely controlled during normal blood cell development and whose aberrant expression contributes to leukemogenesis. 6–10 C-Myb functions at multiple stages of blood cell development from hematopoietic stem cells (HSCs) and progenitor cells to fully differentiated cell types, and can affect the definitive specification of lymphoid, myeloid, erythroid and megakaryocyte lineages. Given the spatio-temporal diversity of its developmental roles, the mechanisms controlling the timing and levels of c-Myb activity must be precise and tightly maintained. While the c-Myb protein has a very short half-life, the regulatory control of its degradation, synthesis and mRNA stability remains poorly understood.
MicroRNAs (miRNAs) provide an elegant mechanism that affords finely tuned control of protein levels by controlling translational efficacy and mRNA stability 11. These noncoding small RNA molecules are quickly becoming recognized as key regulators of diverse cellular functions, including the specification and differentiation of hematopoietic cells 12. The c-myb 3′UTR contains predicted target sites for more than a dozen miRNAs 13–15. Up to date, regulation of c-Myb by two of these miRNAs has been experimentally validated. The overexpression of miR-15 inhibits c-myb 3′UTR-dependent luciferase activity in vitro and contributes to the inhibition of erythroid and myeloid colony formation 16. Overexpression studies of miR-150 in vitro, using a luciferase reporter gene containing the c-myb 3′UTR, also result in a reduction in luciferase activity. miR-150 deficient mice show an increase in B1 cells which are known to require c-Myb 17; an increase in c-Myb protein level was also seen in miR-150 deficient activated B cells. These findings support the role of miR-150/c-myb interactions in B-cell maintenance and differentiation 18. Gain- and loss-of-function analyses have shown that the miR-150/c-myb interaction is also essential for the lineage decision of megakaryocyte-erythrocyte progenitor (MEP) cells to form either megakaryocytes or erythrocytes in vitro 19. Overall, these observations indicate that variations in the levels of c-Myb may be differentially controlled by multiple miRNAs to execute lineage–specific developmental programs at critical junctions during hematopoiesis. Nevertheless, possible combinatorial effects of multiple miRNAs regulating c-Myb within the same developmental context have yet to be addressed experimentally.
Zebrafish and mammalian hematopoiesis are highly conserved on molecular and cellular levels and the phases corresponding to mammalian embryonic and fetal hematopoiesis occur rapidly in the zebrafish with definitive hematopoiesis predominating by 5 days post-fertilization (dpf). Therefore zebrafish provide an ideal system to study the function of miRNAs on different cell lineages at specific hematopoietic stages 20. Furthermore, zebrafish are amenable to transient gene knockdown assays using antisense morpholinos and forced mRNA expression analyses, which provide major advantages for studying mechanisms of miRNA activities regulating embryonic development 21, 22. Hematopoietic development in zebrafish occurs in 4 distinct waves, the first two are termed ‘primitive’, generating macrophages and erythrocytes prior to 30 hours post fertilization (hpf). Two ‘definitive’ waves follow; first, erythromyeloid progenitors form at 30 hpf within the caudal hematopoietic tissue (CHT) or posterior blood island (PBI). At 32–36 hpf the second wave generates HSCs from endothelial cells lining the ventral wall of the dorsal aorta, a region thought to be comparable to the mammalian aorta-gonad-mesonephros (AGM).23, 24 These HSCs subsequently colonize the CHT and the adult hematopoietic organs, the kidney and thymus 25–27.
C-Myb is largely dispensable for primitive hematopoiesis but is essential for definitive blood formation and the normal development of erythroid and megakaryocyte lineages 28. Importantly, c-Myb is also required in non-hematopoietic tissues and c-Myb loss- or gain-of-function assays in vivo result in severe developmental malformation and embryonic lethality which can preclude hematopoietic analysis 29. One approach to circumvent this is by manipulating tissue-specific regulators of c-Myb, which allow analysis of c-Myb’s functions within a specific developmental context.
In this study we demonstrate the direct regulation of c-Myb by miR-126 and the importance of the miR-126/c-myb interaction during definitive hematopoiesis in the zebrafish in vivo. We show that precisely regulated levels of c-Myb are responsible for determining the lineage decision between megakaryocyte/thrombocyte and erythrocyte cell fates in the zebrafish. Furthermore, we show that regulation of this cell fate decision depends upon the concerted actions of both miR-126 and miR-150 assigning a permissive role to miR-126 to promote megakaryocyte/thrombocyte lineage commitment in vivo.
Materials and Methods
Zebrafish
Wild-type AB stocks of Danio rerio, the transgenic lines Tg(c-myb:EGFP) 30, Tg(gata1:dsRed) 31, Tg(cd41:EGFP) 32 and the mutant line Nacre 33 were maintained by standard methods 34.
Morpholinos and miRNA Duplexes
Morpholinos (Gene Tools, LLC, Philomath, OR, USA) were designed to target the mature miR-126 (MO126) and miR-150 (MO150), the Drosha and Dicer sites of pri-miR-126 (MOMB), the putative miR-126 seed sequence in the zf c-myb 3′UTR (c-myb-TPmiR126) and the translational start site of c-myb (MOmyb). The standard control MO from Gene Tools was used as a control (MOctrl). Synthetic miRNA duplexes for miR-126, 150 and 451 were purchased from Dharmacon (Dharmacon Inc, Lafayette, CO, USA) miR-451 was used as a negative control miRNA for target validation studies (miR-ctrl). MOp53 was co-injected with other morpholinos to abrogate non-specific morpholino toxicity 35. Morpholino and miRNA sequences are provided in Table 1. Morpholinos, miRNA duplexes and mRNAs were injected into the yolk of 1-cell stage embryos. MOs were injected at 8ng (MO126, MOctrl), 0.6ng (MO150), 0.8ng(for fluorescence quantification) or 2ng (for ISH analyses) (c-myb-TPmiR126), 3ng(MOMB), 2ng (MOmyb) and 1.6ng (MOp53); MiRNA duplexes were injected at 5-10μM; mRNAs were transcribed from linearized pCS2+ and injected at 350ng/μl (EGFP-c-myb-3′UTRwt and mut), 80ng/μl (mCherry), 100ng/μl (c-myb).
Table 1.
Morpholino and miRNA sequences
| MO | morpholino sequence |
|---|---|
| 126 | 5′-GCACTATTACTCACGGTACGA-3′ |
| MB | 5′-TGCATTATTACTCACGGTACGAGTTTGAGTC-3′ |
| 150 | 5′-CACTGGTACAAGGATTGGGAGA-3′ |
| Ctrl (standard) | 5′-CCTCTTACCTCAGTTACAATTTATA -3′ |
| Ctrl (random) | 5′-GCAAAGAGCAGTTTTATGTACCTCC-3′ |
| c-myb-TPmiR126 | 5′-TGTACCACGAGTGTAGGGACTGTTC-3′ |
| p53 | 5′-GCGCCATTGCTTTGCAAGAATTG-3′ |
| miR | MiRNA duplex (active strand) sequence |
| 126 | 5′-UCGUACCGUGAGUAAUAAUGC-3′ |
| 150 | 5′-UCUCCCAACCCUUGUACCAGUG-3′ |
| Ctrl (451) | 5′-AAACCGUUACCAUUACUGAGUU-3′ |
Ctrl, control; MB, multiblocker; miR, micro RNA; MO, morpholino; TP, target protector
Whole-Mount In Situ Hybridization
WISH for mRNAs was performed as described previously 36.
Cloning of zebrafish c-myb cDNA and 3′UTR and site-directed Mutagenesis
Full-length cDNA of zebrafish c-myb and c-myb 3′UTR were isolated from total RNA by one-step RTPCR (Qiagen, Valencia, CA, USA) and cloned into pCRII, verified by sequencing and subsequently subcloned. Primers for full-length zf-c-myb amplification included a 5′ BamHI site and a 3′ EcoRI site to be subcloned into the pCS2+ expression vector. Primers for the c-myb 3′UTR included a 5′ XhoI site and a 3′ XbaI site to be subcloned into a pCS2-EGFP expression vector C-terminal to the EGFP open reading frame. pCS2+. Mutated c-myb 3′UTR was generated using a site-directed mutagenesis kit (Stratagene, Santa Clara, CA, USA). Oligo sequences are provided in Table 2.
Table 2.
Primer sequences
| Gene | Primer | Sequence |
|---|---|---|
| zf-c-myb cDNA | Fwd | 5′-ATGGCGAGGCGGCACAGACACAGT-3′ |
| Rev | 5′-TCATATGACCAGAGCTCGCGAAGA-3′ | |
| zf-c-myb 3 ′ UTR | Fwd | 5′-ACGAGAGACATAATGAGAC-3′ |
| Rev | 5′-GTCTTTGGTTCCTTGAATG-3′ | |
| zf-c-myb 3 ′ UTR mutated | Fwd | 5′-GAGGAACAGTCCCTACACGGTCCTACATTATTTGGGAGAGGCTG-3′ |
| Rev | 5′-CAGCCTCTCCCAAATAATGTAGGACCGTGTAGGGACTGTTCCTC-3′ | |
| zf-gapdh | Fwd | 5′-GGCAGAAGGCGGCAAACT-3′ |
| Rev | 5′-CTGGGTCCCTCTCGCTATAGAC-3′ | |
| zf-c-myb | Fwd | 5′-AGGGAATCGTCTGCTCTTCCG-3′ |
| Rev | 5′-CAGCAGTTGAACACATGGGAAC-3′ |
Cell Sorting
Embryos (~150) were collected from Tg(c-myb:EGFP), Tg(cd41:EGFP) Tg(gata1:dsRed) and Tg(gata1:dsRed/cd41:EGFP) at 36 hpf and 4 dpf 31, 32 respectively and disaggregated into a single cell suspension as previously described 26. Sorting of c-myb:EGFP+, cd41:EGFP+ and gata1:dsRed+ cells was performed on a BD FACSAria (Becton Dickenson, Franklin lakes, NJ, USA) and FACS analysis on gata1:dsRed/cd41:EGFP embryo suspensions was collected on a FACScaliber (Becton Dickenson, Franklin lakes, NJ, USA) and analyzed using Flowjo software (Treestar Inc, Ashland, OR, USA).
RNA Isolation and qRTPCR
Total RNA from whole embryos or sorted cells was extracted with TRIzol (Invitrogen, Carlsbad, CA, USA). qRTPCR was performed using miRScipt Reverse Transcription and SYBR Green PCR and miRScript Primer Assays (Qiagen) according to the manufacturers protocol. All qRTPCR reactions were performed in triplicates in 2 independent experiments. Gene expression changes were quantified based on the delta-delta CT method using the relative expression software tool (REST) 37. Oligo sequences are provided in Table 2.
Protein Analysis
Embryos (50 or more) were lysed in 2μl/embryo lysis buffer (1% Nonidet P40, 0.1% SDS, 100mM NaCl, 50mM Tris pH 7.4, 10mM EDTA, 0.2mM PMSF, complete mini protein inhibitor cocktail (Roche, Indianapolis, IN, USA)), incubated on ice for 5 min. and spun down at 12500g and 4°C for 10 min. Protein concentration of the supernatant was determined using the DC Protein Assay Reagents Package (Bio-Rad, Hercules, CA, USA). For SDS-PAGE, 100μg protein was combined with 4x denaturing Laemmli buffer, heated at 70°C for 10 minutes and loaded on NuPAGE Novex Bis-Tris Mini Gels (Invitrogen) and separated according to the manufacturer’s protocol. Membranes were blocked with 5% milk powder in TBST (0.1%) and probed with primary antibody overnight at 4°C (mouse anti-c-Myb- MCA1793; 1:500 (AbD Serotec, Raleigh, NC), rabbit anti-beta-Tubulin; 1:10000- ab6046 (Abcam, Cambridge, MA, USA)). Membranes were then washed in TBST and probed with anti-rabbit or anti-mouse HRP-coupled secondary antibodies; 1:5000 (Perkin-Elmer Life Science, Waltham, MA, USA) for one hour. After washing in TBST proteins were detected by ECL (Pierce, Rockford, IL, USA).
Fluorescence Quantification Assays
To determine miRNA regulation of the c-myb 3′UTR in live zebrafish embryos we quantified the relative fluorescence upon co-injections of mRNA of the c-myb 3′UTR fused to EGFP, mCherry and various miRs and MOs. Co-injection of mCherry-encoding RNA with the c-myb 3′UTR:GFP mRNA was used in all conditions as an intra-embryo injection control. Relative fluorescence was calculated to account for normal variations observed in expression levels of injected mRNAs between embryos (related to minor variations in injection and translation efficiency). All experiments were performed in triplicate. Five representative embryos from each injection set were selected and imaged on a Zeiss Axio Imager Z1 microscope (Carl Zeiss, USA) using a Hamamatsu Orca-ER (Hamamatsu, Bridgewater, NJ, USA) digital camera and Openlab software (Improvision, Perkin-Elmer). To calculate relative fluorescence for each embryo, identical selections from three different body regions were chosen from individual embryos and measured for the sum of their pixel intensity using Volocity software (Improvision). Relative fluorescence was determined for each embryo (ΣGFP / ΣmCherry). These values were then averaged for all embryos analyzed for a given injection condition, normalized to the average relative fluorescence of the control miRNA-injected embryos, and compared to each other to determine the effect of a given injection condition on fluorescence intensity resulting in a readout for miRNA-mRNA interaction in vivo.
Results
In order to identify novel miRNAs regulating c-Myb, we analyzed the c-myb 3′UTR for potential target sites of miRNAs expressed in HSCs. We were particularly interested in miR-126 because it is highly expressed in normal human and murine HSC and acute myeloid leukemia (AML) leukemia–initiating cells 38–41 and is part of a distinct micro-RNA overexpression signature in core binding factor leukemias 40. Our analysis revealed a putative miR-126 target site within 120 bp downstream of the c-myb stop codon with a perfect seed match that was conserved in three mammalian and two teleost fish species (Fig. 1A,B). Consistent with these findings, the sequence of mature miR-126 was also conserved among these organisms (Fig. 1B), as well as the sequence of miR-150 (Fig. 1C). Notably, mammalian 3′UTRs contained at least two putative miR-150 target sites, while zebrafish and medaka 3′UTRs had a single perfect seed match for miR-150 (Fig. 1A).
Figure 1. Cross-species sequence conservation of miR-126, miR-150 and their target sites within the c-myb 3′UTR.
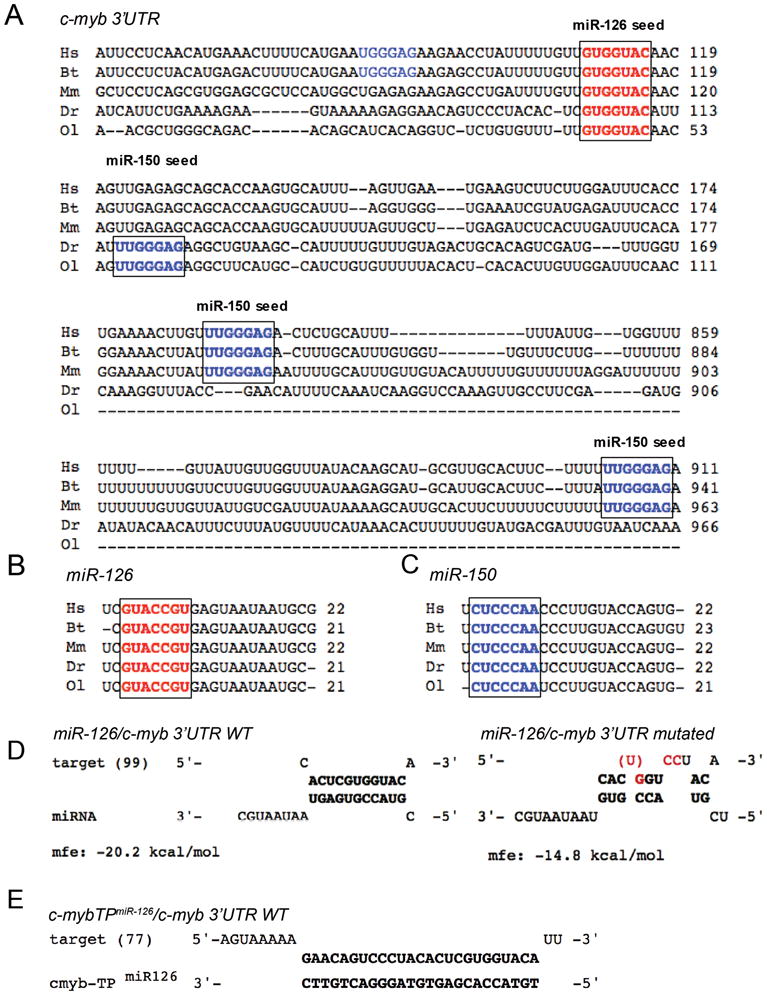
(A) 3′UTR sequences of c-myb flanking miR-126 (bold red) and mir-150 (bold and non-bold blue) target (‘seed’) sites were aligned among human (Hs), cattle (Bt), mouse (Mm), zebrafish (Dr) and medaka (Ol). Numbers indicate nucleotide positions following the STOP codon. For the single miR-126 site, nucleotide sequence and location within the 3′UTR are highly conserved among all species. For miR-150, two sites are highly conserved among human, cattle and mouse (bold blue); one additional site may be present in human and cattle (non-bold blue). Both fish 3′UTRs contain only one highly conserved miR-150 target site (bold blue). (B, C) The sequence of mature miR-126 (B) and miR-150 (C) is highly conserved among these species. The ‘seed’ sequence is highlighted (bold red) for miR-126 or (bold blue) for miR-150. UTR sequences were obtained from the ENSEMBL database (www.ensembl.org).
(D) We applied the web-based RNAhybrid tool to predict miRNA/mRNA interactions in zebrafish based on the minimum free energy hybridization of the wildtype (WT) or mutated c-myb 3′UTR and miR-126 54. The 5′-nucleotide position of the c-myb 3′UTR is indicated in brackets. Mutated or deleted nucleotides are highlighted in red. (E) To confirm that the putative miR-126 target site is used in vivo, the target protector morpholino c-myb-TPmiR126 was designed 100% complementary to the putative miR-126 target site within the zf-c-myb 3′UTR. If the predicted target site is used, competition of the c-myb-TPmiR126 morpholino and miR-126 for the same binding site will result in reduced or abolished regulation of c-myb by miR-126.
mfe, minimum free energy.
We evaluated the function of the putative miR-126 target site using an in vivo reporter assay in zebrafish embryos 22. Figure 2A illustrates our reporter assay where mRNA encoding the wild-type zebrafish c-myb 3′UTR fused to EGFP was co-injected with mCherry mRNA into embryos at the one cell stage. The co-injected mCherry mRNA controlled for injection variability. Changes in levels of EGFP expression relative to mCherry expression were assessed in the presence of various miRNA duplexes (Fig. 2B). Co-injection of miR-126 resulted in a statistically significant decrease (35%) in c-myb 3′UTR-EGFP fluorescence compared to co-injected control miRNAs and indicated potent negative regulatory function (Fig. 2B,C). Expression of miR-150 yielded a similar 30% reduction in EGFP fluorescence. To confirm the specificity of these observations we also performed assays using EGFP fused to a mutated 3′UTR that contained four nucleotide substitutions within the miR-126 target seed sequence, or a target protector morpholino (c-myb-TPmiR126)), which competes with miR-126 for the specific target sequence in the c-myb 3′UTR (Figs. 1D,E and 2)42. In both cases, GFP fluorescence was restored to control levels (Fig. 2B, C). Interestingly, the co-expression of both miR-126 and miR-150 showed no additive effect on the reduction of GFP fluorescence when compared with either of the miRs expressed independently. Target protector morpholinos provide an exquisite means to inhibit specific mRNA/miRNA interactions during zebrafish embryonic development without affecting other potential target mRNAs or miRNAs. Given that the miR-126 and miR-150 target sites in both fish species are in close physical proximity within the 3′UTR, we verified that c-myb-TPmiR126 blocked the miR-126 effects but did not interfere with miR-150-mediated regulation of c-Myb (Fig. 2B, C). Our findings show that miR-126 can interact in vivo with its predicted target site within the c-myb 3′UTR to attenuate translation of an upstream coding region.
Figure 2. MiR-126 targets the zebrafish c-myb 3′UTR in vivo.

(A) Schematic of the in vivo miRNA/mRNA interaction reporter assay 42. Wild-type or mutated c-myb 3′UTR fused to EGFP mRNA is co-injected into fertilized zebrafish embryos with mCherry mRNA (internal injection control) and miR duplexes or morpholinos. At 18hpf the relative fluorescence intensity levels (GFP/RFP) are measured and normalized to control injections. (B) Upper panel: Live images of co-injected embryos in brightfield, RFP filter and EGFP filter. (C) Lower panel: Quantification of relative fluorescence. Co-injection of wild-type c-myb 3′UTR with miR-126 duplex resulted in a 35% decrease of relative EGFP fluorescence compared to the control miRNA (miR-ctrl). A similar reduction was observed with miR-150, a known regulator of c-myb 18. Conversely, injection of a c-myb 3′UTR containing four point mutations in the putative miR-126 target site or co-injection with a c-myb-TPmiR126 target protector morpholino abolished the regulation of c-myb 3′UTR by miR-126. The c-myb-TPmiR126 target protector morpholino showed no effect on miR-150 mediated c-myb 3′UTR regulation. The combination of miR-126 and miR-150 did not yield stronger regulation than when expressed individually. Injection conditions and relative fluorescence values are indicated. Error bars represent standard deviation.
**P=0.0026 (two-tailed student’s t-test); mCherry, mCherry fluorescent protein; GFP, green fluorescent protein.
To demonstrate the physiological relevance of the miR-126/c-myb interaction, we analyzed c-Myb expression in zebrafish embryos and sorted zebrafish hematopoietic stem/progenitor cells. As in mammals, c-Myb is broadly and dynamically expressed in many tissues, including HSCs of the developing hematopoietic system 20. Definitive c-myb+/runx1+ HSCs appear at approximately 36 hpf within the AGM 43, and 4 hours later begin to migrate into the kidney and thymus, the adult hematopoietic organs, and the posterior blood island (PBI) 25–27. In order to analyze c-myb mRNA levels in hematopoietic stem cells (HSCs) upon knockdown or forced expression of miR-126 in vivo, we used fluorescent-activated cell sorting (FACS) to isolate EGFP+ HSCs from embryos of the transgenic zebrafish line Tg(cmyb:EGFP), which drives EGFP under the control of the zebrafish c-myb promoter 30. MiR-126 knock-down was validated by qRT-PCR using a combination of morpholinos targeting either the mature form of miR-126 (MO126) or a multiblocker morpholino targeting the Drosha and Dicer cleavage sites within the primary miR-126 transcript (MOMB) or both. (Fig. 3B) The combination of both resulted in a robust reduction of mature miR-126 (Fig. 3A,B). A recent report indicated that miR-126 knockdown in zebrafish embryos resulted in a loss of vascular integrity and hemorrhage 44. However, at the morpholino concentrations used in this study, knockdown of miR-126 did not yield any obvious defects in circulation and embryos were viable through 4 dpf with intact circulation (Fig. 4; Suppl. Movies). In contrast, enforced expression of miR-126 by injection of a synthetic miR-126 duplex resulted in gross developmental malformations and circulation failure by 25 hpf, most likely due to the inhibition of c-Myb and other miR-126 target genes during development. Despite their morphological defects, c-myb:EGFP+ cells were formed in these embryos and were FACS sorted to provide data on c-Myb mRNA and protein levels 31 (Fig. 3A). The c-myb:EGFP+ cells from these embryos at 36 hpf revealed an expected inverse correlation of miR-126 to c-myb mRNA levels. However, the observed differences in mRNA levels were not statistically significant (Fig. 3A), suggesting that miR-126 primarily regulates c-Myb protein synthesis, rather than mRNA stability. To test this comprehensively, c-Myb protein levels were analyzed in lysates from whole zebrafish embryos at 24 hpf (Fig. 3C). Enforced expression of the miR-126 duplex reduced c-Myb protein to nearly undetectable levels, while the knockdown of miR-126 by morpholinos effectively increased c-Myb protein levels. A similar increase in c-Myb protein levels was observed when the c-myb-TPmiR126 was used to block the miR-126 target site in the c-myb 3′UTR to disrupt endogenous miR-126/c-myb interactions. We also assayed miR-150 function, which has been shown to regulate c-Myb in human and murine cells 19. The morpholino knockdown of miR-150 resulted in an increase in c-Myb protein while overexpression of miR-150 caused a reduction in c-Myb protein levels, validating a physiological role of the miR-150/c-myb interaction in the zebrafish. Our results indicate that both miR-126 and miR-150 directly regulate c-Myb protein levels in vivo during embryogenesis.
Figure 3. In vivo manipulation of miR-126 levels in zebrafish embryos and regulation of regulates c-Myb in zebrafish embryos and HSCs.

(A) Hematopoietic stem cells were isolated from a transgenic zebrafish line Tg(c-myb:EGFP) at 36 hpf and c-myb mRNA and miR-126 levels were analyzed by qRTPCR. Knockdown or enforced expression of miR-126 reduced or increased mature miR-126 levels in HSCs compared to control morpholino (MOctrl) injections and normalized to gapdh mRNA levels. Although c-myb mRNA levels mirrored miR-126 levels, the changes were not statistically significant. Average values of two independent experiments in triplicate are shown with the standard deviation of biological replicates indicated. Relative expression levels are depicted in logarithmic scale.
(B) miR-126 levels in zebrafish embryos at 24hpf were determined by qRTPCR normalized to control injections and zf-gapdh. Injection of miR-126 duplex (5μM) resulted in an almost 80-fold increase of mir-126 levels. Injection of a morpholino targeting the mature miR-126 (MO126, 2mM), or a multiblocker-morpholino targeting the Drosha and Dicer sites in the pre-miR-126 (MOMB, 0.8mM) or a combination of MO126 and MOMB (MO126MB) yielded a 2.6-fold, 4.9-fold or 12-fold reduction of mature miR-126 levels, respectively. Relative expression levels are depicted in logarithmic scale.
(C) Increased c-Myb protein levels are observed with the functional inhibition of miR-126 using a combination of MO126 and MOMB (MO126MB) or the target protector (c-myb-TPmiR126), and by the functional knockdown of miR-150. The enforced expression of miR-126 or miR-150 results in a marked reduction of c-Myb relative to MOctrl injections. β-Tubulin expression was used as a loading control.
Figure 4. MiR-126 is essential for thrombocyte-erythrocyte lineage determination.

Panels A–L show the distribution of thrombocytes and erythrocytes by in situ hybridization assays for mRNAs of the thrombopoetin receptor (tpoR) and the erythrocyte-specific solute carrier 4a1 (slc4a1). All images depict the PBI of zebrafish larvae at 96 hpf. Functional knockdown of miR-126 by MO126MB or c-mybTPmiR126 resulted in increased erythrocytes and decreased thrombocytes. Concomitant knockdown of c-Myb protein with a translational start site morpholino (MOmyb) could rescue this effect. Enforced expression of miR-150 resulted in a reciprocal increase in thrombocytes and decreased erythrocytes. Importantly, enforced expression of miR-150 failed to rescue the miR-126 knockdown phenotype, suggesting that both miRNAs are required at this lineage fate junction. Black arrowheads indicate thrombocytes. Elevated or reduced staining for tpoR and slc4a1 is indicated with green or red arrows, respectively. Wild-type levels of thrombocytes and erythrocytes are indicated by black horizontal arrows. Panel M shows a representative FACS plot and the ratio of gata1:dsRed+/cd41:EGFP+ cells from double transgenic animals determined by FACS analysis. The balance of erythroid-thrombocyte lineage cells is increased in MO126MB and c-mybTPmiR126 compared to control. The shift favoring erythropoiesis was rescued by MOmyb but not by miR-150 overexpression, which alone caused a reciprocal decrease in the erythroid-thrombocyte cell ratio. Representative data of 4 experiments (N) qRT-PCR for miR150 and miR126 in gata1:dsRed+ cells from Tg(gata1:dsRed) and EGFP+ cells from Tg(cd41:EGFP) at 2dpf, 3dpf and 4dpf. Data is depicted as the ratio of miR126:miR150 (each normalized to gapdh). While the ratio miR126:miR150 is relatively unchanged in gata1:dsRed+ cells between 2–4 days of development, in cd41:EGFP+ cells miR126 concentration continuously increases to an almost 10 fold excess over miR150 at 4dpf.
Zebrafish thrombocytes represent the functional equivalent of mammalian platelets 45. Despite this functional similarity, little is known about the ontogeny of thrombocytes in zebrafish. Megakaryocytes, the precursors of mammalian platelets, have not been identified in the zebrafish kidney marrow 20, 46. Nonetheless, many genes essential for megakaryocyte development are present in zebrafish, suggesting that their developmental program is conserved. As a novel regulator of c-Myb, we examined the role of the miR-126/c-myb interaction during thrombocyte-erythrocyte lineage commitment. In situ hybridization assays for mature markers of thrombocytes (tpoR), and erythrocytes (slc4a1) were performed after experimentally altering miR-126 and miR-150 levels (Fig. 4A–L). Functional knockdown of miR-126 by morpholinos targeting the microRNA or inhibition by the target protector morpholino, c-myb-TPmiR126, resulted in an increase in erythrocytes and a decrease in thrombocytes compared to control (Fig. 4A–F). To further demonstrate the dependence of this phenotype on the c-Myb pathway, we concurrently knocked down c-Myb expression by morpholino. While complete loss of c-Myb leads to severe morphological defects 47 titrating its knockdown demonstrated the ability to rescue the erythrocyte-thrombocyte phenotype (Fig. 4G,H). Consistent with studies in mammalian cells 48, forced expression of miR-150 resulted in an opposite effect, reducing c-Myb and increasing thrombocytes while decreasing erythrocyte numbers (Fig. 4I,J). Interestingly, the miR-126 loss-of-function phenotype was dominant over the miR-150 gain-of-function, in that over-expression of miR-150 could not rescue the miR-126 knockdown phenotype (Fig. 4K,L). These findings were confirmed independently by FACS analyses using a double transgenic reporter line Tg(cd41:EGFP):Tg(gata1:dsRed) that expressed EGFP in thrombocytes and dsRed in erythroid cells (Fig. 4M) The ratio of gata1:dsRed+ erythroid cells compared to CD41:EGFP+ thrombocytes was 7:1 in the control injected embryos. This increased to 10:1 when miR-126 was knocked down. Interestingly we see an even further increase in the ratio of gata1:dsRed/CD41:EGFP in the c-myb-TPmiR126 condition. This may reflect more complete inhibition of the interaction between miR126 and its binding site by blocking this directly compared to morpholino knockdown of miR-126 where residual miR may be present. Knockdown of c-Myb combined with knockdown of miR-126 completely abrogated the effects of the miR-126 knockdown, and supporting the in situ experiments, overexpression of miR-150 alone reduced the ratio of gata1:dsRed/CD41:EGFP by half (7:1 to 3.5:1), while it failed to do so in combination with miR-126 knockdown.
Unfortunately, the converse experiments could not be performed because either the overexpression of miR-126 or the knockdown of miR-150 resulted in severe developmental defects that precluded analysis at later developmental stages (Fig. S1 and data not shown). For each of these two miRNAs a number of additional mRNAs contain putative seed sequences. For example, the TargetScan algorithm13 for target prediction yields 18 putative targets for human miR-126 under the most stringent search parameters. For human miR-150 a total of 142 genes are predicted targets containing at least one seed sequence. Thus, the developmental effects of miR-126 overexpression and miR150 knockdown during embryogenesis are likely to arise from altered expression of not only c-Myb but one or more of their other target genes.
Since both miR-126 and miR150 target c-myb and result in altered megakaryocyte-erythroid cell fate, we addressed the relative expression levels of miR-126 and miR-150 in developing zebrafish thrombocytes and erythroid cells using quantitative RT-PCR on RNA extracted from sorted Tg(cd41:EGFP) and Tg(gata:dsRed) from 2dpf to 4dpf. We determined that the level of miR-126 is 6 fold higher at 3dpf and 10 fold higher at 4dpf in cd41-EGFP+ thrombocytes compared to miR-150 while in contrast the levels of both miRs were similar in gata1:dsRed erythroid cells (Fig 4N).
Discussion
In this study, we have identified miR-126 as a physiological regulator of c-Myb. We show that it is the specific interaction of miR-126 and c-myb at the identified target site that permits post-transcriptional regulation of c-Myb levels. Our observations indicate that the level of c-Myb in hematopoietic tissue is dynamically regulated by the activities of miR-126 and miR-150, and that these effects on c-Myb result in control of the thrombocyte-erythrocyte lineage decision by multipotential progenitor cells. Thus, our data support the conservation of miRNA regulatory mechanisms of c-Myb function during mammalian and zebrafish hematopoiesis. Our data suggest that these microRNAs may act through a sequential rather than an additive mechanism to control the levels of c-Myb and that regulation of c-Myb during the thrombocyte-erythrocyte lineage decision depends preferentially on miR-126 or miR-150 at different developmental stages. Indeed, the level of miR-126 exceeds miR-150 levels at 3dpf six fold and is 10 fold higher at 4dpf in cd41-EGFP+ thrombocytes while in contrast the levels of both miRs were similar in gata1:dsRed erythroid cells. . While our study did not address more specific aspects of vessel formation it is notable that miR-126 has been demonstrated to play a role in vascular development 44, 49. Hemorrhages are a prominent feature of the phenotype observed in miR-126 knockdown in the studies by Fish et al and Nicoli et al. In view of our findings this may be a result of both loss of vascular integrity and thrombocytopenia. In addition, both microRNAs have many predicted targets, including others in the c-Myb pathway. For example, miR-126 has been suggested to target Tom1 (Target of myb 1), which in turn is suggested to activate c-Myb transcriptional activity via modulation of NF-kappaB signaling 50–52. On the other hand, miR-150 is predicted to target Pim1, another positive regulator of c-Myb 53. Hence, in addition to directly regulating c-Myb the complementary but different effects of these two miRNAs may be mediated, at least in part, by other target genes that in turn affect c-Myb function. In summary, this paper adds another level of complexity in the c-myb regulatory pathway, and underscores the importance of animal models where specific subsets of cells can be tracked during development.
Supplementary Material
Acknowledgments
We thank R. Hoffmans, U. Pyati and N. Bushati for critical comments on the manuscript and L. Zon for the Tg(c-myb:EGFP) zebrafish line. This work was supported by the NIH grant CA93152 (A.T.L). E.M.P. is the recipient of a Clinical Research Training Fellowship from Leukemia & Lymphoma Research UK. N.B is a Special Fellow of the Leukemia & Lymphoma Society.
Footnotes
Conflicts of Interest
The authors declare no conflicts of interest
References
- 1.Zhu J, Emerson SG. Hematopoietic cytokines, transcription factors and lineage commitment. Oncogene. 2002 May 13;21(21):3295–3313. doi: 10.1038/sj.onc.1205318. [DOI] [PubMed] [Google Scholar]
- 2.Cantor AB, Orkin SH. Transcriptional regulation of erythropoiesis: an affair involving multiple partners. Oncogene. 2002 May 13;21(21):3368–3376. doi: 10.1038/sj.onc.1205326. [DOI] [PubMed] [Google Scholar]
- 3.Friedman AD. Transcriptional regulation of granulocyte and monocyte development. Oncogene. 2002 May 13;21(21):3377–3390. doi: 10.1038/sj.onc.1205324. [DOI] [PubMed] [Google Scholar]
- 4.Ye M, Graf T. Early decisions in lymphoid development. Curr Opin Immunol. 2007 Apr;19(2):123–128. doi: 10.1016/j.coi.2007.02.007. [DOI] [PubMed] [Google Scholar]
- 5.Rosenbauer F, Tenen DG. Transcription factors in myeloid development: balancing differentiation with transformation. Nat Rev Immunol. 2007 Jan 30;7(2):105–117. doi: 10.1038/nri2024. [DOI] [PubMed] [Google Scholar]
- 6.Greig K, Carotta S, Nutt S. Critical roles for c-Myb in hematopoietic progenitor cells. Seminars in Immunology. 2008 Aug 1;20(4):247–256. doi: 10.1016/j.smim.2008.05.003. [DOI] [PubMed] [Google Scholar]
- 7.O'Neil J, Tchinda J, Gutierrez A, Moreau L, Maser RS, Wong KK, et al. Alu elements mediate MYB gene tandem duplication in human T-ALL. The Journal of experimental medicine. 2007 Dec 24;204(13):3059–3066. doi: 10.1084/jem.20071637. [DOI] [PMC free article] [PubMed] [Google Scholar]
- 8.Ramsay R, Gonda T. MYB function in normal and cancer cells. Nature reviews. 2008 Jul 1;8(7):523–534. doi: 10.1038/nrc2439. [DOI] [PubMed] [Google Scholar]
- 9.Lahortiga I, De Keersmaecker K, Van Vlierberghe P, Graux C, Cauwelier B, Lambert F, et al. Duplication of the MYB oncogene in T cell acute lymphoblastic leukemia. Nat Genet. 2007 May 1;39(5):593–595. doi: 10.1038/ng2025. [DOI] [PubMed] [Google Scholar]
- 10.Clappier E, Cuccuini W, Kalota A, Crinquette A, Cayuela J-M, Dik WA, et al. The C-MYB locus is involved in chromosomal translocation and genomic duplications in human T-cell acute leukemia (T-ALL), the translocation defining a new T-ALL subtype in very young children. Blood. 2007 Aug 15;110(4):1251–1261. doi: 10.1182/blood-2006-12-064683. [DOI] [PubMed] [Google Scholar]
- 11.Bushati N, Cohen SM. microRNA Functions. Annual review of cell and developmental biology. 2007;23:175–205. doi: 10.1146/annurev.cellbio.23.090506.123406. [DOI] [PubMed] [Google Scholar]
- 12.Garzon R, Croce CM. MicroRNAs in normal and malignant hematopoiesis. Curr Opin Hematol. 2008 Jul;15(4):352–358. doi: 10.1097/MOH.0b013e328303e15d. [DOI] [PubMed] [Google Scholar]
- 13.Lewis BP, Shih IH, Jones-Rhoades MW, Bartel DP, Burge CB. Prediction of mammalian microRNA targets. Cell. 2003 Dec 26;115(7):787–798. doi: 10.1016/s0092-8674(03)01018-3. [DOI] [PubMed] [Google Scholar]
- 14.Krek A, Grun D, Poy MN, Wolf R, Rosenberg L, Epstein EJ, et al. Combinatorial microRNA target predictions. Nat Genet. 2005 May;37(5):495–500. doi: 10.1038/ng1536. [DOI] [PubMed] [Google Scholar]
- 15.Griffiths-Jones S, Grocock RJ, van Dongen S, Bateman A, Enright AJ. miRBase: microRNA sequences, targets and gene nomenclature. Nucleic Acids Res. 2006 Jan 1;34(Database issue):D140–144. doi: 10.1093/nar/gkj112. [DOI] [PMC free article] [PubMed] [Google Scholar]
- 16.Zhao H, Kalota A, Jin S, Gewirtz AM. The c-myb Protooncogene and microRNA (miR)-15a comprise an active autoregulatory feedback loop in human hematopoietic cells. Blood. 2008 Sep 25; doi: 10.1182/blood-2008-01-136218. [DOI] [PMC free article] [PubMed] [Google Scholar]
- 17.Thomas MD, Kremer CS, Ravichandran KS, Rajewsky K, Bender TP. c-Myb is critical for B cell development and maintenance of follicular B cells. Immunity. 2005 Sep;23(3):275–286. doi: 10.1016/j.immuni.2005.08.005. [DOI] [PubMed] [Google Scholar]
- 18.Xiao C, Calado D, Galler G, Thai T, Patterson H, Wang J, et al. MiR-150 Controls B Cell Differentiation by Targeting the Transcription Factor c-Myb. Cell. 2007 Oct 5;131(1):146–159. doi: 10.1016/j.cell.2007.07.021. [DOI] [PubMed] [Google Scholar]
- 19.Lu J, Guo S, Ebert BL, Zhang H, Peng X, Bosco J, et al. MicroRNA-mediated control of cell fate in megakaryocyte-erythrocyte progenitors. Dev Cell. 2008 Jun;14(6):843–853. doi: 10.1016/j.devcel.2008.03.012. [DOI] [PMC free article] [PubMed] [Google Scholar]
- 20.De Jong J, Zon L. Use of the zebrafish system to study primitive and definitive hematopoiesis. Annual Review of Genetics. 2005 Dec 1;39(1):481–501. doi: 10.1146/annurev.genet.39.073003.095931. [DOI] [PubMed] [Google Scholar]
- 21.Nasevicius A, Ekker SC. Effective targeted gene 'knockdown' in zebrafish. Nat Genet. 2000 Oct;26(2):216–220. doi: 10.1038/79951. [DOI] [PubMed] [Google Scholar]
- 22.Giraldez AJ, Mishima Y, Rihel J, Grocock RJ, Van Dongen S, Inoue K, et al. Zebrafish MiR-430 Promotes Deadenylation and Clearance of Maternal mRNAs. Science. 2006 Apr 7;312(5770):75–79. doi: 10.1126/science.1122689. [DOI] [PubMed] [Google Scholar]
- 23.Bertrand JY, Chi NC, Santoso B, Teng S, Stainier DY, Traver D. Haematopoietic stem cells derive directly from aortic endothelium during development. Nature. 2010 Feb 14; doi: 10.1038/nature08738. [DOI] [PMC free article] [PubMed] [Google Scholar]
- 24.Kissa K, Herbomel P. Blood stem cells emerge from aortic endothelium by a novel type of cell transition. Nature. 2010 Feb 14; doi: 10.1038/nature08761. [DOI] [PubMed] [Google Scholar]
- 25.Bertrand JY, Kim AD, Teng S, Traver D. CD41+ cmyb+ precursors colonize the zebrafish pronephros by a novel migration route to initiate adult hematopoiesis. Development. 2008 May;135(10):1853–1862. doi: 10.1242/dev.015297. [DOI] [PMC free article] [PubMed] [Google Scholar]
- 26.Bertrand JY, Kim AD, Violette EP, Stachura DL, Cisson JL, Traver D. Definitive hematopoiesis initiates through a committed erythromyeloid progenitor in the zebrafish embryo. Development. 2007 Dec;134(23):4147–4156. doi: 10.1242/dev.012385. [DOI] [PMC free article] [PubMed] [Google Scholar]
- 27.Kissa K, Murayama E, Zapata A, Cortes A, Perret E, Machu C, et al. Live imaging of emerging hematopoietic stem cells and early thymus colonization. Blood. 2008 Feb 1;111(3):1147–1156. doi: 10.1182/blood-2007-07-099499. [DOI] [PubMed] [Google Scholar]
- 28.Tober J, McGrath KE, Palis J. Primitive erythropoiesis and megakaryopoiesis in the yolk sac are independent of c-myb. Blood. 2008 Mar 1;111(5):2636–2639. doi: 10.1182/blood-2007-11-124685. [DOI] [PMC free article] [PubMed] [Google Scholar]
- 29.Lin Y-C, Kuo M-W, Yu J, Kuo H-H, Lin R-J, Lo W-L, et al. c-Myb Is an Evolutionary Conserved miR-150 Target and miR-150/c-Myb Interaction Is Important for Embryonic Development. Mol Biol Evol. 2008 Oct 1;25(10):2189–2198. doi: 10.1093/molbev/msn165. [DOI] [PubMed] [Google Scholar]
- 30.North T, Goessling W, Walkley C, Lengerke C, Kopani K, Lord A, et al. Prostaglandin E2 regulates vertebrate haematopoietic stem cell homeostasis. Nature (London) 2007 Jun 21;447(7147):1007–1011. doi: 10.1038/nature05883. [DOI] [PMC free article] [PubMed] [Google Scholar]
- 31.Traver D, Paw BH, Poss KD, Penberthy WT, Lin S, Zon LI. Transplantation and in vivo imaging of multilineage engraftment in zebrafish bloodless mutants. Nature immunology. 2003 Dec;4(12):1238–1246. doi: 10.1038/ni1007. [DOI] [PubMed] [Google Scholar]
- 32.Lin HF, Traver D, Zhu H, Dooley K, Paw BH, Zon LI, et al. Analysis of thrombocyte development in CD41-GFP transgenic zebrafish. Blood. 2005 Dec 1;106(12):3803–3810. doi: 10.1182/blood-2005-01-0179. [DOI] [PMC free article] [PubMed] [Google Scholar]
- 33.Lister JA, Robertson CP, Lepage T, Johnson SL, Raible DW. nacre encodes a zebrafish microphthalmia-related protein that regulates neural-crest-derived pigment cell fate. Development. 1999 Sep;126(17):3757–3767. doi: 10.1242/dev.126.17.3757. [DOI] [PubMed] [Google Scholar]
- 34.Westerfield M. The zebrafish book. 3. The University of Oregon Press; Eugene: 1995. [Google Scholar]
- 35.Robu ME, Larson JD, Nasevicius A, Beiraghi S, Brenner C, Farber SA, et al. p53 Activation by Knockdown Technologies. PLoS Genetics. 2007;3(5):e78. doi: 10.1371/journal.pgen.0030078. [DOI] [PMC free article] [PubMed] [Google Scholar]
- 36.Rhodes J, Hagen A, Hsu K, Deng M, Liu TX, Look AT, et al. Interplay of pu.1 and gata1 determines myelo-erythroid progenitor cell fate in zebrafish. Dev Cell. 2005 Jan;8(1):97–108. doi: 10.1016/j.devcel.2004.11.014. [DOI] [PubMed] [Google Scholar]
- 37.Pfaffl MW, Horgan GW, Dempfle L. Relative expression software tool (REST) for group-wise comparison and statistical analysis of relative expression results in real-time PCR. Nucleic Acids Res. 2002 May 1;30(9):e36. doi: 10.1093/nar/30.9.e36. [DOI] [PMC free article] [PubMed] [Google Scholar]
- 38.Li Z, Lu J, Sun M, Mi S, Zhang H, Luo RT, et al. Distinct microRNA expression profiles in acute myeloid leukemia with common translocations. Proceedings of the National Academy of Sciences. 2008 Oct 7;105(40):15535–15540. doi: 10.1073/pnas.0808266105. [DOI] [PMC free article] [PubMed] [Google Scholar]
- 39.Jin P, Wang E, Ren J, Childs R, Shin J, Khuu H, et al. Differentiation of two types of mobilized peripheral blood stem cells by microRNA and cDNA expression analysis. Journal of Translational Medicine. 2008;6(1):39. doi: 10.1186/1479-5876-6-39. [DOI] [PMC free article] [PubMed] [Google Scholar]
- 40.Cammarata G, Augugliaro L, Salemi D, Agueli C, La Rosa M, Dagnino L, et al. Differential expression of specific microRNA and their targets in acute myeloid leukemia. Am J Hematol. 2010 May;85(5):331–339. doi: 10.1002/ajh.21667. [DOI] [PubMed] [Google Scholar]
- 41.O'Connell R, Chaudhuri A, Rao D, Gibson W, Balazs A, Baltimore D. MicroRNAs enriched in hematopoietic stem cells differentially regulate long-term hematopoietic output. Proc Natl Acad Sci U S A. 2010 Jul; doi: 10.1073/pnas.1009798107. [DOI] [PMC free article] [PubMed] [Google Scholar]
- 42.Choi WY, Giraldez AJ, Schier AF. Target protectors reveal dampening and balancing of nodal agonist and antagonist by miR-430. Science. 2007 Oct 12;318(5848):271–274. doi: 10.1126/science.1147535. [DOI] [PubMed] [Google Scholar]
- 43.Davidson AJ, Zon LI. The 'definitive' (and 'primitive') guide to zebrafish hematopoiesis. Oncogene. 2004 Sep 20;23(43):7233–7246. doi: 10.1038/sj.onc.1207943. [DOI] [PubMed] [Google Scholar]
- 44.Fish JE, Santoro MM, Morton SU, Yu S, Yeh RF, Wythe JD, et al. miR-126 regulates angiogenic signaling and vascular integrity. Developmental Cell. 2008 Aug 1;15(2):272–284. doi: 10.1016/j.devcel.2008.07.008. [DOI] [PMC free article] [PubMed] [Google Scholar]
- 45.Jagadeeswaran P, Sheehan JP, Craig FE, Troyer D. Identification and characterization of zebrafish thrombocytes. Br J Haematol. 1999 Dec;107(4):731–738. doi: 10.1046/j.1365-2141.1999.01763.x. [DOI] [PubMed] [Google Scholar]
- 46.Kaushansky K. Historical review: megakaryopoiesis and thrombopoiesis. Blood. 2008 Feb 1;111(3):981–986. doi: 10.1182/blood-2007-05-088500. [DOI] [PMC free article] [PubMed] [Google Scholar]
- 47.Lin YC, Kuo MW, Yu J, Kuo HH, Lin RJ, Lo WL, et al. c-Myb is an evolutionary conserved miR-150 target and miR-150/c-Myb interaction is important for embryonic development. Mol Biol Evol. 2008 Oct 1;25(10):2189–2198. doi: 10.1093/molbev/msn165. [DOI] [PubMed] [Google Scholar]
- 48.Lu J, Guo S, Ebert BL, Zhang H, Peng X, Bosco J, et al. MicroRNA-mediated control of cell fate in megakaryocyte-erythrocyte progenitors. Developmental Cell. 2008 Jun 1;14(6):843–853. doi: 10.1016/j.devcel.2008.03.012. [DOI] [PMC free article] [PubMed] [Google Scholar]
- 49.Nicoli S, Standley C, Walker P, Hurlstone A, Fogarty K, Lawson N. MicroRNA-mediated integration of haemodynamics and Vegf signalling during angiogenesis. Nature. 2010 Apr;464(7292):1196–1200. doi: 10.1038/nature08889. [DOI] [PMC free article] [PubMed] [Google Scholar]
- 50.Nicot C, Mahieux R, Pise-Masison C, Brady J, Gessain A, Yamaoka S, et al. Human T-cell lymphotropic virus type 1 Tax represses c-Myb-dependent transcription through activation of the NF-kappaB pathway and modulation of coactivator usage. Mol Cell Biol. 2001 Nov;21(21):7391–7402. doi: 10.1128/MCB.21.21.7391-7402.2001. [DOI] [PMC free article] [PubMed] [Google Scholar]
- 51.Yamakami M, Yokosawa H. Tom1 (target of Myb 1) is a novel negative regulator of interleukin-1- and tumor necrosis factor-induced signaling pathways. Biol Pharm Bull. 2004 Apr;27(4):564–566. doi: 10.1248/bpb.27.564. [DOI] [PubMed] [Google Scholar]
- 52.Oglesby I, Bray I, Chotirmall S, Stallings R, O'Neill S, McElvaney N, et al. miR-126 is downregulated in cystic fibrosis airway epithelial cells and regulates TOM1 expression. J Immunol. 2010 Feb;184(4):1702–1709. doi: 10.4049/jimmunol.0902669. [DOI] [PubMed] [Google Scholar]
- 53.Leverson JD, Koskinen PJ, Orrico FC, Rainio EM, Jalkanen KJ, Dash AB, et al. Pim-1 kinase and p100 cooperate to enhance c-Myb activity. Mol Cell. 1998 Oct;2(4):417–425. doi: 10.1016/s1097-2765(00)80141-0. [DOI] [PubMed] [Google Scholar]
- 54.Rehmsmeier M, Steffen P, Hochsmann M, Giegerich R. Fast and effective prediction of microRNA/target duplexes. RNA. 2004 Oct;10(10):1507–1517. doi: 10.1261/rna.5248604. [DOI] [PMC free article] [PubMed] [Google Scholar]
Associated Data
This section collects any data citations, data availability statements, or supplementary materials included in this article.