

Abstract
Why is motility so common in bacteria? An obvious answer to this ecological and evolutionary question is that in almost all habitats, bacteria need to go someplace and particularly in the direction of food. Although the machinery required for motility and chemotaxis (acquiring and processing the information needed to direct movement toward nutrients) are functionally coupled in contemporary bacteria, they are coded for by different sets of genes. Moreover, information that resources are more abundant elsewhere in a habitat would be of no value to a bacterium unless it already had the means to get there. Thus, motility must have evolved before chemotaxis, and bacteria with flagella and other machinery for propulsion in random directions must have an advantage over bacteria relegated to moving at the whim of external forces alone. However, what are the selection pressures responsible for the evolution and maintenance of undirected motility in bacteria? Here we use a combination of mathematical modeling and experiments with Escherichia coli to generate and test a parsimonious and ecologically general hypothesis for the existence of undirected motility in bacteria: it enables bacteria to move away from each other and thereby obtain greater individual shares of resources in physically structured environments. The results of our experiments not only support this hypothesis, but are quantitatively and qualitatively consistent with the predictions of our model.
Keywords: experimental evolution, population dynamics, partial differential equations
If we accept that the presence of genes coding for flagella indicates the phenotype of self-propulsion, motility is an ancient and almost ubiquitous character in the eubacteria. Flagellar genes are significantly overrepresented in environmental samples of DNA (1, 2), and almost two-thirds of sequenced bacteria with phenotypic annotations are motile (3). Why is motility so widespread? At a qualitative level the obvious answer is almost certainly true: In most of the habitats in which bacteria reside, nutrients are not evenly dispersed. Cells with the facility to propel themselves have more access to resources than those that move solely at the whim of external forces. This qualitative answer, however, raises a number of quantitative questions that have to be addressed for a comprehensive understanding of the ecological conditions under which natural selection will favor the evolution and maintenance of motility. Under what conditions will the relatively weak propulsion ability of a bacterium enable it to overcome the viscosity (resistance to flow or gumminess) of its environment for its movement to be effective? Under what conditions will movement in random directions provide a bacterium with an edge in the acquisition of resources when competing with bacteria that are nonmotile or less motile? In contemporary bacteria, motility is commonly coupled with chemotaxis, i.e., the sensory and signaling machinery needed to direct their motion toward nutrients (4–6). Logic, retrospective evidence, and, as we show here, mathematical models and experiments all suggest that chemotaxis evolved in bacteria that were already capable of self-propulsion in random directions.
For natural selection to favor motility for the acquisition of nutrients by bacteria, their environment must be physically structured in such a way that nutrients are not equally available to all cells. Thus, to address questions about the conditions for the evolution and maintenance of motility theoretically (with mathematical models) and experimentally we cannot use the traditional modeling and experimental tools of bacterial population biology. These tools consist of ordinary differential equations (ODEs) (7) and experiments performed with bacteria in liquid medium in the well-agitated flasks and chemostats of laboratory culture (8, 9). Both of these “tools” consider bacterial populations as arrays of planktonic cells cavorting about in an environment that, from the perspective of an individual bacterium, is dimensionless.
Experimentally addressing questions about the role of the physical structure of the environment in the ecology and evolution of bacteria is relatively straightforward. At least two methods have been used: one is with the bacteria embedded in a semisolid, like soft agar (10) or Pluronic F127 (11), and the other is with the bacteria spread on the surfaces of harder agar media (12, 13). More complex and realistic experimental systems can also be used to address these questions. For example, in a recent study the relative ability of strains of Vibrio cholerae to colonize zooplankton was examined in laboratory culture with Daphnia (14). However, there are limits to the inferences one can draw about natural populations from purely experimental studies. It has been proposed that “studying population biology without mathematical or computer simulations is like playing tennis without a net or boundary lines” (15). Although some readers may not agree with this perspective, most will appreciate the utility of mathematical models for the design and interpretation of empirical studies and generalizing on their results.
Analyzing models of bacteria in physically and spatially structured habitats is more challenging than the same analysis for planktonic bacteria. The most widely used spatial population models are i) partial differential equations (PDEs) and ii) agent-based or cellular automata simulations. PDEs allow modeling at the level of populations, whereas agent-based and cellular automata simulations model individuals. PDEs with explicit diffusion terms have been used to explore the factors contributing to the shape of bacterial colonies (16–18), the diffusion and uptake of resources in 2D habitats by growing populations of bacteria (19–22), and the population dynamics of allelopathy (23). Agent-based and cellular automata models have also been used to study the growth and population dynamics of bacteria in physically structured habitats (12, 24–27). In general, the advantages of mathematical formalism and mathematical analysis evaporate with agent-based and cellular automata models.
Here we study the conditions for the evolution and maintenance of random motility in bacteria, using theory and experiments. We use a system of reaction diffusion PDEs to model the resource-limited growth and competition between bacteria with different motilities in a physically structured habitat. Our model predicts that the extent to which purely random motility will be favored is proportional to the viscosity of the environment and the rate at which the bacteria propel themselves through that environment. To test the predictions of our model, we use experimental populations of motile and nonmotile strains of Escherichia coli in liquid and soft agar culture. The results of our experiments are quantitatively as well as qualitatively consistent with the predictions of our model, namely, that knowing where they are going is not a necessary condition for motile bacteria to be favored in physically structured habitats. Our results indicate that the capacity for self-propulsion in a random direction is favored because it enables bacteria to move away from each other and thereby increase their individual access to limiting resources. The results of our theoretical and experimental analyses also support the hypothesis that the sensory and signaling apparatus associated with chemotaxis further augments the fitness of bacteria in physically structured, resource-limited communities.
Results
In Fig. 1A, we plot the ratio of total number of motile and nonmotile bacteria, M/N, predicted by our model after 4 d of competition with two initial concentrations of resource and different rates of diffusion. The prediction is clear: The advantage of motility increases with the amount of resource, RMAX, and the viscosity of the environment, measured by the decline in the diffusion coefficient DR. In Fig. 1B, we consider the effect of the diffusion of the motile strain, DM, on the M/N ratio with constant diffusion of the resource and the nonmotile strain, DR and DN. Over a broad range of values of the diffusion coefficient of the motile strain, DM, the M/N ratio increases. However, for DM sufficiently large, M/N declines, which is an artifact of the Neumann (zero flux) boundary condition used in the simulation. If the simulated Petri dish is larger, there is no decline (Fig. S1).
Fig. 1.

Simulation of competition between motile and nonmotile cells in homogenous habitats with two different levels of resource. Parameters common to both plots are α = 0.90 h−1, k = 5.0 μg/mL, ν = 4.75 × 10⁻⁷ μg, and dt = 0.1 h−1. The computations used a grid size of 0.1 cm and cell densities and M/N ratios were computed at the tick marks shown. (A) Ratio of motile to nonmotile cells for different resource diffusion coefficients DR. A higher resource diffusion constant leads to less spatial variation in resource concentration DM =3.19 × 10⁻⁴ and DN =3.6 × 10⁻⁵ cm/h. (B) Ratio of motile to nonmotile cells for different motile strain diffusion coefficients DM assuming DR = 3.6 × 10⁻³ and DN = 3.6 × 10⁻⁵ cm/h.
To empirically test the validity of the conditions predicted by the model, we used two strains of E. coli K-12 from the KEIO collection, a Nalr nonmotile strain (JW1059) and a wild-type motile strain, (JW5702), N and M, respectively. All experiments were performed in medium that contained distilled water with 1% or 0.1% tryptone without agar (liquid culture controls) or with 0.175% and 0.35% agar.
In Fig. 2A, we show the progression of population growth and dispersion over a 4-d period for the nonmotile and motile bacteria in 35-mm diameter Petri dishes. By the end of the second day, the M population appears to be distributed throughout the Petri dish, whereas the N population remains in the center of the dish. Although the volume covered by the N population increases with time, even after 4 d its population appears to remain in the center of the dish. To confirm this apparent dispersion and growth, we took plugs of agar from 5 mm and 15 mm from the edges of these Petri dishes, suspended the cells in saline, and estimated their densities. The results of this experiment are presented in Table 1.
Fig. 2.

(A) Growth of motile and nonmotile strains in 35-mm diameter Petri dishes with 1% tryptone, 0.35% agar medium. (B) Change in density of motile and nonmotile strains in single-clone culture and ratio of motile/nonmotile cells (M/N in right axis) in pairwise competition in liquid culture with different amounts of nutrient (1% and 0.1% tryptone). Mean densities were estimated for three separate dilutions from two independent experiments. Initially there were 20–50 cells/mL and M/N ratios of 0.6–0.7. (C) Change in density of motile and nonmotile strains in single-clone culture and ratio of motile/nonmotile cells (M/N in right axis) in pairwise competition in soft agar culture with different amounts of nutrient (1% and 0.1% tryptone) and different viscosities of agar (0.35% and 0.175%). Mean densities were estimated for three separate dilutions from two independent experiments. Initially there were 20–50 cells/mL and M/N ratios of 0.6–0.7. (See Methods for information about the error in these estimates of densities and ratios in this and the following figures.) (D) Simulation results, change in density of motile and nonmotile strains in single-clone culture and ratio of motile/nonmotile cells (M/N in right axis) in pairwise competition in soft agar culture with different amounts of nutrient (Rmax = 5 and 50 μg/mL) and resource diffusion coefficients (DR = 3.6 × 10⁻³ and 7.2 × 10⁻³ cm/h). Simulation parameters: α = 0.9 h−1, k = 5.0 mg/mL, ν = 4.75 × 10⁻⁷ μg/h, DM =3.19 × 10⁻⁴ cm/h, and DN = 3.6 × 10⁻³ cm/h. The computations used a grid size of 0.1 cm and a step size of 0.1 h−1.
Table 1.
Means and SEs of the estimated densities of suspended cells from four plugs taken 5 mm and 15 mm from the edges of separate Petri dishes of the sort depicted in Fig. 2A
| Day 1 | Day 2 | Day 3 | Day 4 | |
| N, 5 mm | 0 | 0 | 0 | 0 |
| N, 15 mm | 0 | 0 | 0 | 7.3 ± 0.7 × 10⁶ |
| M, 5 mm | 0 | 5.5 ± 0.6 × 10⁶ | 5.5 ± 0.8 × 10⁶ | 2.6 ± 0.3 × 10⁶ |
| M, 15 mm | 9.9 ± 0.4 × 10⁵ | 6.8 ± 0.7 × 10⁶ | 8.2 ± 1.1 × 10⁶ | 4.1 ± 0.3 × 10⁶ |
N are nonmotile bacteria and M are motile bacteria.
In Fig. 2 B and C we present the results of experiments with N and M alone and in mixed culture. In liquid by the end of the first day the cultures are nearly at their maximum densities. There was no evidence for the motile strain having an advantage over the nonmotile strain in either the rate at which it saturates the environment in single-clone culture or its competitive performance in mixed culture (Fig. 2B). The outcome is very different in the structured habitat of soft agar. Here the M strain has a considerable advantage over the N both in the rate at which it saturates the habitat in single-clone culture and in competition with N in mixed culture (Fig. 2C). Because the bacteria saturate these habitats, the M/N ratio ceases to increase after the third day. As predicted by the model (Fig. 1A) and seen by the increase in the M/N ratio, these advantages of motility are greater in medium with a higher concentration of the resource (1% tryptone) and greater viscosity (0.35% agar). Not only are these experimental results and theoretical predictions qualitatively coincident, they also are reasonably consistent quantitatively (compare Fig. 2C with 2D).
In the experiments illustrated in Fig. 2, the soft agar cultures were initiated with a needle placing a low density of bacteria into the center of the agar. Although this procedure is the experimental analog of our mathematical model, it is not the only way structured communities can be colonized by bacteria. A more likely situation would be for these habitats to be initially composed of bacteria that are dispersed throughout. To mimic this, we performed experiments similar to those in Fig. 2C with single clones or mixtures of motile and nonmotile E. coli, introduced into the agar while it was still liquid. The cultures were immediately vortexed to distribute the bacteria. The results of this experiment (Fig. 3) are virtually identical to the corresponding experiments with the needle inoculation procedure (Fig. 2C). As long as the few initial motile and nonmotile cells are close enough to compete for resources, the motile cells will have the considerable advantage shown in Fig. 3. On the other hand, the simulations made with our PDE model do not fit the results of this experiment with randomly mixed cells as they do with the needle inoculation method (Fig. 3 and Fig. S2).
Fig. 3.

(A–D) Change in density of motile and nonmotile strains in single-clone culture and ratio of motile/nonmotile cells (M/N in right axis) in pairwise competition in soft agar with different amounts of nutrient (1% and 0.1% tryptone) and different viscosities of agar (0.35% and 0.175%). Mean densities were estimated for three separate dilutions from two independent experiments. Cultures were initiated with 20–50 cells randomly dispersed in agar and M/N ratios of 0.6–1.0.
We stress that our model does not require directed movement to regions of greater resource concentration (chemotaxis) for motility to be favored. However, the experiments presented in Fig. 2 do not exclude chemotaxis from contributing to the advantage of motility. The wild-type motile strain used in these experiments is capable of chemotaxis (Mot+Che+). On the other hand, in single-clone culture motile but chemotactic negative strains of E. coli (Mot+Che−) “swarm” in soft agar (28). Therefore, it seems reasonable to anticipate that even without knowing where they are going, motile E. coli would have an advantage over nonmotile E. coli. To determine whether this is the case, we repeated the experiments presented in Fig. 2 with a Mot+Che− construct of E. coli, PS2001(ΔcheB, cheZ, and cheY) bearing a low copy number pLC576 plasmid carrying a cheY under lac promoter that was inducible for motility (29, 30).
As anticipated from the studies of Wolfe and Berg (28), the Mot+Che− strain diffuses through the habitat faster and farther than the Mot−Che+ strain (Fig. 4A). In single-clone agar culture the motile strain saturates the habitat faster than the nonmotile one. There are no differences between strains in this saturation rate in liquid, although in liquid, the motile strain seems to die off more rapidly than the nonmotile one. As with the Mot+Che+ strain experiments depicted in Figs. 2 and 3 in agar, the motile strain is more fit than the nonmotile one. As measured by M/N ratio, the extent of this fitness advantage of the Mot+Che− strain in agar is less than that of the Mot+Che+ strain.
Fig. 4.

Growth and competitive performance of two strains of E. coli PS2001: motile chemotactic negative and nonmotile chemotactic positive. Strains were grown in 1% tryptone liquid and in 0.175% soft agar medium. (A) Growth and dispersion of motile chemotactic negative (Mot+Che−) and nonmotile chemotactic positive (Mot−Che+) cells in 35-mm diameter Petri dishes. (B) Change in density of motile and nonmotile strains in single-clone culture and ratio of motile/nonmotile cells (M/N in right axis) in pairwise competition in liquid and soft agar. Mean densities were estimated for three separate dilutions from two independent experiments. Initially there were 20–50 cells/mL and M/N ratios of 0.6–0.7.
Discussion
We interpret the results of this study as support for the hypothesis that even without the directional information associated with chemotaxis, motility provides bacteria with an advantage in the rate at which they saturate and compete in resource-limited, physically structured habitats. Motile bacteria are able to move away from each other faster than nonmotile bacteria and thereby increase their likelihood of entering regions of more abundant resources.
In our model and experiments, the initial concentration of resources was homogenous throughout the habitat. However, as the bacterial population grows it consumes resources in its vicinity faster than those from more distant regions. Within short order, resource concentration gradients are formed. Although the bacteria are equally likely to move toward regions where resources are depleted as they are to regions where they are abundant, the consequences of moving in these two directions are different. As assumed by our model and manifest in our experiments, bacteria entering an area of greater resource concentration divide more rapidly than those entering areas of lower resource concentration and colonize those richer regions. As predicted by our model, this motility advantage increases with the viscosity of the environment and the extent to which the populations grow (the resource concentration effect).
Whereas our model does not explicitly account for chemotaxis, it does so implicitly. From the population dynamic perspective considered in our model and experiments, the effect of chemotaxis on the speed of the front of the spreading colony (20, 22) is the same as increasing the undirected, diffusive motility of the bacteria. In essence, chemotaxis increases the net rate of bacterial movement to regions of higher resource concentration. In this interpretation, chemotaxis further augments the fitness of already motile bacteria in physically structured, resource-limited habitats. Chemotaxis augmenting the fitness of motile bacteria can be seen by comparing the extent of the advantage of the Mot+Che+ strain (Fig. 2) and the Mot+Che− construct (Fig. 4). See ref. 31 for a more detailed theoretical consideration of the adaptive value of chemotaxis vs. undirected motility.
In our experiments, we mimicked a physically structured habitat with the bacteria embedded in soft agar (10) rather than on the surfaces of hard agar (12, 13). Recent experiments with V. cholerae, however, provide evidence that motility would also be favored for bacteria growing on surfaces. In a study of the fitness costs of phage-resistant mutants of V. cholerae, Wei and colleagues found that although the motile strain used as a common competitor had a disadvantage in liquid culture, it had a considerable advantage over the nonmotile strain when grown on filters suspended on hard agar (14).
Because the PDE model used here explicitly accounts for spatial heterogeneity in resource availability and the movement of bacteria, it is a far better analog of resource-limited population growth and competition in physically structured habitats than ODE models are. As with ODE models, this PDE model can be extended to other ecological and clinical situations that may be influenced by the physical structure of the habitat, such as phage and protozoan predation, plasmid transfer, and the pharmacodynamics of antibiotics. Moreover, the solutions of the PDE model used here are robust, and errors in their predictions can be estimated analytically (SI Methods).
On the other hand, the model used here is a simplistic caricature of bacterial growth and competition in physically structured habitats. It is not expected or even desired to be a quantitatively precise analog of these processes. The role of this model was to facilitate the design and generate hypotheses for our experiments and interpret and provide generality to their results in a qualitative way. However, as noted in Fig. 2, the predictions of the model and the results of our experiments are quantitatively as well as qualitatively coincident. Although this is certainly gratifying, we see it as a lagniappe rather than something we anticipated. Although the model's parameters are in a realistic range and the solutions are robust with respect to changes in these parameters, this model is for a 2D habitat, whereas the experimental habitat is 3D. Moreover, as far as this model goes, motility will be favored no matter how viscous the habitat may be. Taken to the extreme this cannot be true. The power of the flagella and other motility machinery needed to propel bacteria is modest (32); bacteria would not be motile if embedded in very viscous substrates.
Our hypothesis that motility evolved and is maintained because it enables bacteria to get away from competing cells is not inconsistent with the hypotheses that this capacity to move is favored because of chemotaxis (20), to escape the clutches of predatory protozoa (33), or to facilitate adhesion to tissues by fimbriae (34). This move to get away from peers provides broader and more ecologically general conditions for motility to be favored than these other mechanisms. It does not require the bacteria to recognize gradients in nutrient concentrations, or to confront predators, or to live in specific habitats. All that is needed is a physically structured environment of the sort in which most real-world bacteria live.
Our conjecture that motility evolved before chemotaxis is based on logic and inductive inference rather than having witnessed this evolution. We have, however, added plausibility to this conjecture. We have demonstrated theoretically and validated experimentally the necessary condition for this evolutionary progression, that motility can be favored in the absence of chemotaxis. Phylogenetic data are also consistent with our conjecture for an evolutionary progression from motility to chemotaxis. Whereas the flagellar genes are highly conserved among motile species, the sensing, signal transduction, and transcription factors associated with chemotaxis vary among species and habitats and are used with modifications for diverse cellular tasks (35–40).
Methods
Model.
We assume a 2D matrix with two populations of bacteria of different levels of motility and a limiting resource. The latter is taken up by and converted into bacteria as a hyperbolic function of its concentration (41) at different points in this matrix. With these definitions and assumptions, the rates of change in the densities of bacteria and concentration of the resource in this matrix are given by a set of partial differential equations,
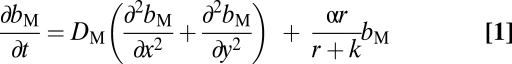 |
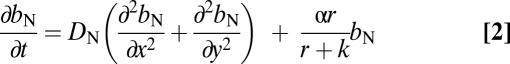 |
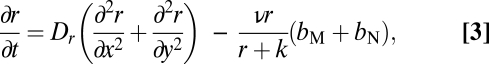 |
where bM = bM(x, y, t) and bN = bN(x, y, t) are, respectively, the densities of the motile and a less or nonmotile bacteria, M and N, at a point (x, y) at a time t and r = r(x ,y, t) is the corresponding concentration of the resource. We assume that M and N have the same maximum rate of cell division, α·h−1, and the same concentration of the nutrient at which their rate of cell division is half its maximum value, the Monod constant, k μg/mL. We also assume that the rate of bacterial death is negligible. The parameter v μg/h is the maximum per-capita rate at which bacteria consume the resource. DM, DN, and DR cm/h are, respectively, the diffusion coefficients for the M and N bacteria and the resource.
Numerical Solution and Stability.
Because this nonlinear system of partial differential equations has no closed-form solution, we use numerical methods to simulate solutions. For our numerical analysis of the properties of these models we assume i) the difference between the motile and nonmotile bacteria is solely in their respective capacities to diffuse, DM > DN; ii) initially the resource is homogeneously distributed throughout the matrix, r(x, y, 0) = constant; iii) low initial densities of bacteria are localized at the center of the matrix; iv) there is no flow of bacteria or resources into or out of the matrix; v) the bacterial growth α and resource uptake-conversion parameter v are in a range estimated for E. coli K-12 in glucose-limited minimal medium (9); and vi) the diffusion coefficients and parameters are similar to those estimated with a thin tube assay (16, 42, 43). Simulations commence with an initial resource concentration RMAX and all of the bacteria at the central point. To avoid the problem of instabilities commonly encountered when solving partial differential equations numerically, we devise an implicit scheme and prove that it possesses stability and consistency properties that make its application highly reliable (SI Methods). Copies of the Matlab programs used for these simulations and instructions for their use are available from the authors.
Experimental Methods.
The E. coli used in this study are from the Keio collection (44). The motile (M) strain is JW5702 crp and the nonmotile (N) one is JW1059 flgA. To distinguish these strains by plating, we used a spontaneous Nalr mutant of the N strain. The results of our competition experiments between the ancestral JW1059 and JW1059 Nalr failed to detect fitness differences associated with this Nalr marker. As is the case for all Keio strains, our M and N bacteria bear a Kanr marker.
The PS2001 (ΔcheB, cheZ cheY) strain we used for our Mot+ Che− strain had been transformed with a low copy number pMS164 CmR plasmid carrying a cheYD 13K gene with an inducible lac promoter (29, 30). We induced this gene and thereby motility by adding 0.5 mM IPTG to the liquid and soft agar media. To ensure the maintenance of the plasmid 25 μg/mL chloramphenicol was also added to the media. By conjugation we transferred an R1(Cm Km Am Str Sp) plasmid to JW1059 Nalr so this Mot−Che+ strain would also be resistant to the chloramphenicol in the medium.
All of the motility experiments were done in 35-mm diameter Petri dishes (351008; Falcon) containing 5 mL of medium, 1% tryptone or 0.1% tryptone, and 0.5% NaCl with either 0.35% agar or 0.175% agar. The densities of bacteria were estimated in LB agar with 25 μg/mL kanamycin (N and M) and LB agar with 20 μg/mL naladixic acid (N only). The soft agar cultures were initiated in two ways: i) A needle was dipped into diluted 37 °C LB overnight cultures of N or M or mixed M and N cultures and then gently stabbed into the center of the agar surface of the Petri dishes (Figs. 2 and 4) or ii) between 20–50 cells were suspended in the soft agar before pouring it into the Petri dishes (Fig. 3). For each experiment, two independent replicate cultures were prepared for each day's sampling for a total of eight plates. Three independent estimates of the densities of these cultures were made for each time point. The parallel liquid culture experiments were performed with 2 mL of agar-free 1% or 0.1% tryptone in the wells of 12-well plates, (Falcon; 353043), for a total of six cultures for each experiment, two each of N only, M only, and M and N. All cultures were incubated at 30 °C at high humidity to minimize drying. To suspend the bacteria in the agar culture for sampling, the agar was put into tubes containing 10 mL 0.85% saline and vigorously vortexed for between 45 and 60 s.
For clarity and aesthetic reasons we elected not to include the error bars in the estimates of the densities and ratios in Figs. 2–4. The sampling errors obtained in our experiments were negligible relative to the magnitude of the effects of motility in the soft agar experiments. Considering the 1% tryptone results in Figs. 2 and 3, for the liquid culture experiment in Fig. 2B, the ratio of the SE to the mean for the estimated cell densities of the combined experiments over the 4 d was 0.08 and for the M/N ratio was 0.23. For the needle inoculation method in 0.35% agar in Fig. 2C the corresponding ratios were respectively 0.11 and 0.22. And for the random distribution experiment in 0.35% agar in Fig. 3A, these ratios were 0.11 and 0.15, respectively.
Supplementary Material
Acknowledgments
We thank Philippe Cluzel for providing us with the PS2001 Mot+Che− strain and instructions for its use, and Paul Rainey for supplying B.R.L. with sage advice and much-needed reality checking. We owe a special debt of gratitude to Amy Kirby for insightful comments and suggestions on an earlier draft of this report. We also thank Yingjie Liu for helpful suggestions and for recruiting Xiaolin Wang and Jingfang Liu, students in his numerical analysis course, to join us in this enterprise. This research was funded by US National Institutes of Health Grant GM 091875 (to B.R.L.).
Footnotes
The authors declare no conflict of interest.
*This Direct Submission article had a prearranged editor.
This article contains supporting information online at www.pnas.org/lookup/suppl/doi:10.1073/pnas.1013499108/-/DCSupplemental.
References
- 1.Dinsdale EA, et al. Functional metagenomic profiling of nine biomes. Nature. 2008;452:629–632. doi: 10.1038/nature06810. [DOI] [PubMed] [Google Scholar]
- 2.Harrington ED, et al. Quantitative assessment of protein function prediction from metagenomics shotgun sequences. Proc Natl Acad Sci USA. 2007;104:13913–13918. doi: 10.1073/pnas.0702636104. [DOI] [PMC free article] [PubMed] [Google Scholar]
- 3.NCBI-NIH . NCBI Prokaryotic Genomes. Bethesda: National Center for Biotechnology Information, National Institutes of Health; 2010. [Google Scholar]
- 4.Falke JJ, Bass RB, Butler SL, Chervitz SA, Danielson MA. The two-component signaling pathway of bacterial chemotaxis: A molecular view of signal transduction by receptors, kinases, and adaptation enzymes. Annu Rev Cell Dev Biol. 1997;13:457–512. doi: 10.1146/annurev.cellbio.13.1.457. [DOI] [PMC free article] [PubMed] [Google Scholar]
- 5.Wadhams GH, Armitage JP. Making sense of it all: Bacterial chemotaxis. Nat Rev Mol Cell Biol. 2004;5:1024–1037. doi: 10.1038/nrm1524. [DOI] [PubMed] [Google Scholar]
- 6.Vergassola M, Villermaux E, Shraiman BI. ‘Infotaxis’ as a strategy for searching without gradients. Nature. 2007;445:406–409. doi: 10.1038/nature05464. [DOI] [PubMed] [Google Scholar]
- 7.Stewart FM, Levin BR. Resource partitioning and the outcome of interspecific competition: A model and some general considerations. Am Nat. 1973;107:171–198. [Google Scholar]
- 8.Lenski R. The ecology, genetics and evolution of bacteria in an experimental setting. Curr Biol. 2003;13:R466–R467. doi: 10.1016/s0960-9822(03)00401-9. [DOI] [PubMed] [Google Scholar]
- 9.Chao L, Levin BR, Stewart FM. A complex community in a simple habitat: An experimental study with bacteria and phage. Ecology. 1977;58:369–378. [Google Scholar]
- 10.Chao L, Levin BR. Structured habitats and the evolution of anticompetitor toxins in bacteria. Proc Natl Acad Sci USA. 1981;78:6324–6328. doi: 10.1073/pnas.78.10.6324. [DOI] [PMC free article] [PubMed] [Google Scholar]
- 11.Yang J, Evans BA, Rozen DE. Signal diffusion and the mitigation of social exploitation in pneumococcal competence signalling. Proc Biol Sci. 2010;277:2991–2999. doi: 10.1098/rspb.2010.0659. [DOI] [PMC free article] [PubMed] [Google Scholar]
- 12.Kerr B, Riley MA, Feldman MW, Bohannan BJ. Local dispersal promotes biodiversity in a real-life game of rock-paper-scissors. Nature. 2002;418:171–174. doi: 10.1038/nature00823. [DOI] [PubMed] [Google Scholar]
- 13.Simonsen L. Dynamics of plasmid transfer on surfaces. J Gen Microbiol. 1990;136:1001–1007. doi: 10.1099/00221287-136-6-1001. [DOI] [PubMed] [Google Scholar]
- 14.Wei Y, Ocampo P, Levin BR. An experimental study of the population and evolutionary dynamics of Vibrio cholerae O1 and the bacteriophage JSF4. Proc Biol Sci. 2010;277:3247–3254. doi: 10.1098/rspb.2010.0651. [DOI] [PMC free article] [PubMed] [Google Scholar]
- 15.EclF. Available at www.eclf.net. Accessed August 18, 2010.
- 16.Adler J, Dahl MM. A method for measuring the motility of bacteria and for comparing random and non-random motility. J Gen Microbiol. 1967;46:161–173. doi: 10.1099/00221287-46-2-161. [DOI] [PubMed] [Google Scholar]
- 17.Mimura M, Sakaguchi H, Matsushita M. Reaction-diffusion modelling of bacterial colony patterns. Physica A Stat Mech Appl. 2000;282(1–2):283–303. [Google Scholar]
- 18.Matsushita M, et al. Formation of colony patterns by a bacterial cell population. Physica A. 1999;274:190–199. [Google Scholar]
- 19.Lauffenburger D, Aris R, Keller KH. Effects of random motility on growth of bacterial-populations. Microb Ecol. 1981;7:207–227. doi: 10.1007/BF02010304. [DOI] [PubMed] [Google Scholar]
- 20.Berg HC. Random Walks in Biology. Princeton: Princeton Univ Press; 1993. [Google Scholar]
- 21.Golding I, Kozlovsky Y, Cohen I, Ben-Jacob E. Studies of bacterial branching growth using reaction-diffusion models for colonial development. Physica A Stat Mech Appl. 1998;260(3–4):510–554. [Google Scholar]
- 22.Berg H. E. coli in Motion. New York: Springer-Verlag; 2004. [Google Scholar]
- 23.Frank S. Spatial polymorphism of bacteriocins and other allelopathic traits. Evol Ecol. 1994;8:369–386. [Google Scholar]
- 24.Wimpenny J, Colasan R. A unifying hypothesis for the structure of microbial biofilms based on cellular automaton models. FEMS Microbiol Ecol. 1997;22:1–16. [Google Scholar]
- 25.Durrett R, Levin S. Allelopathy in spatially distributed populations. J Theor Biol. 1997;185:165–171. doi: 10.1006/jtbi.1996.0292. [DOI] [PubMed] [Google Scholar]
- 26.Prado F, Kerr B. The evolution of restraint in bacterial biofilms under nontransitive competition. Evolution. 2008;62:538–548. doi: 10.1111/j.1558-5646.2007.00266.x. [DOI] [PMC free article] [PubMed] [Google Scholar]
- 27.Majeed H, Gillor O, Kerr B, Riley MA. Competitive interactions in Escherichia coli populations: The role of bacteriocins. ISME J. 2011;5:71–81. doi: 10.1038/ismej.2010.90. [DOI] [PMC free article] [PubMed] [Google Scholar]
- 28.Wolfe AJ, Berg HC. Migration of bacteria in semisolid agar. Proc Natl Acad Sci USA. 1989;86:6973–6977. doi: 10.1073/pnas.86.18.6973. [DOI] [PMC free article] [PubMed] [Google Scholar]
- 29.Alon U, et al. Response regulator output in bacterial chemotaxis. EMBO J. 1998;17:4238–4248. doi: 10.1093/emboj/17.15.4238. [DOI] [PMC free article] [PubMed] [Google Scholar]
- 30.Korobkova E, Emonet T, Vilar JM, Shimizu TS, Cluzel P. From molecular noise to behavioural variability in a single bacterium. Nature. 2004;428:574–578. doi: 10.1038/nature02404. [DOI] [PubMed] [Google Scholar]
- 31.Celani A, Vergassola M. Bacterial strategies for chemotaxis response. Proc Natl Acad Sci USA. 2010;107:1391–1396. doi: 10.1073/pnas.0909673107. [DOI] [PMC free article] [PubMed] [Google Scholar]
- 32.Sowa Y, Berry RM. Bacterial flagellar motor. Q Rev Biophys. 2008;41:103–132. doi: 10.1017/S0033583508004691. [DOI] [PubMed] [Google Scholar]
- 33.Matz C, Jürgens K. High motility reduces grazing mortality of planktonic bacteria. Appl Environ Microbiol. 2005;71:921–929. doi: 10.1128/AEM.71.2.921-929.2005. [DOI] [PMC free article] [PubMed] [Google Scholar]
- 34.Flores J, Okhuysen PC. Enteroaggregative Escherichia coli infection. Curr Opin Gastroenterol. 2009;25:8–11. doi: 10.1097/MOG.0b013e32831dac5e. [DOI] [PubMed] [Google Scholar]
- 35.Zhulin IB. The superfamily of chemotaxis transducers: From physiology to genomics and back. Adv Microb Physiol. 2001;45:157–198. doi: 10.1016/s0065-2911(01)45004-1. [DOI] [PubMed] [Google Scholar]
- 36.Szurmant H, Ordal GW. Diversity in chemotaxis mechanisms among the bacteria and archaea. Microbiol Mol Biol Rev. 2004;68:301–319. doi: 10.1128/MMBR.68.2.301-319.2004. [DOI] [PMC free article] [PubMed] [Google Scholar]
- 37.Singh AH, Wolf DM, Wang P, Arkin AP. Modularity of stress response evolution. Proc Natl Acad Sci USA. 2008;105:7500–7505. doi: 10.1073/pnas.0709764105. [DOI] [PMC free article] [PubMed] [Google Scholar]
- 38.Zhulin IB, Nikolskaya AN, Galperin MY. Common extracellular sensory domains in transmembrane receptors for diverse signal transduction pathways in bacteria and archaea. J Bacteriol. 2003;185:285–294. doi: 10.1128/JB.185.1.285-294.2003. [DOI] [PMC free article] [PubMed] [Google Scholar]
- 39.Girgis HS, Liu Y, Ryu WS, Tavazoie S. A comprehensive genetic characterization of bacterial motility. PLoS Genet. 2007;3:1644–1660. doi: 10.1371/journal.pgen.0030154. [DOI] [PMC free article] [PubMed] [Google Scholar]
- 40.Kirby JR. Chemotaxis-like regulatory systems: Unique roles in diverse bacteria. Annu Rev Microbiol. 2009;63:45–59. doi: 10.1146/annurev.micro.091208.073221. [DOI] [PubMed] [Google Scholar]
- 41.Monod J. The growth of bacterial cultures. Annu Rev Microbiol. 1949;3:371–394. [Google Scholar]
- 42.Segel LA, Chet I, Henis Y. A simple quantitative assay for bacterial motility. J Gen Microbiol. 1977;98:329–337. doi: 10.1099/00221287-98-2-329. [DOI] [PubMed] [Google Scholar]
- 43.Kim YC. Diffusivity of bacteria. Korean J Chem Eng. 1996;13:282–287. [Google Scholar]
- 44.Baba T, et al. Construction of Escherichia coli K-12 in-frame, single-gene knockout mutants: The Keio collection. Mol Syst Biol. 2006;2:2006–0008. doi: 10.1038/msb4100050. [DOI] [PMC free article] [PubMed] [Google Scholar]
Associated Data
This section collects any data citations, data availability statements, or supplementary materials included in this article.