

Abstract
Protein L12, the only multicopy component of the ribosome, is presumed to be involved in the binding of translation factors, stimulating factor-dependent GTP hydrolysis. Crystal structures of L12 from Thermotoga maritima have been solved in two space groups by the multiple anomalous dispersion method and refined at 2.4 and 2.0 Å resolution. In both crystal forms, an asymmetric unit comprises two full-length L12 molecules and two N–terminal L12 fragments that are associated in a specific, hetero-tetrameric complex with one non-crystallographic 2–fold axis. The two full-length proteins form a tight, symmetric, parallel dimer, mainly through their N–terminal domains. Each monomer of this central dimer additionally associates in a different way with an N–terminal L12 fragment. Both dimerization modes are unlike models proposed previously and suggest that similar complexes may occur in vivo and in situ. The structures also display different L12 monomer conformations, in accord with the suggested dynamic role of the protein in the ribosomal translocation process. The structures have been submitted to the Protein Databank (http://www.rcsb.org/pdb) under accession numbers 1DD3 and 1DD4.
Keywords: crystal structure/dimer formation/flexibility/hinge region/ribosomal protein L12 (L7)
Introduction
Ribosomes are large ribonucleoprotein complexes, responsible for the accurate translation of genetic messages. In prokaryotes, a large ribosomal subunit contains two RNA molecules (23S and 5S rRNA) and >30 ribosomal proteins (r–proteins), while a small subunit harbors a single RNA strand (16S rRNA) and some 20 different r–proteins. The structure of ribosomes has been probed by a multitude of biochemical and biophysical techniques, the most powerful of which are cryo-electron microscopy (Stark et al., 1997; Agrawal et al., 1998) and X–ray crystallography. Crystallographic studies of ribosomes proceed at various levels of complexity. Several crystal structures of individual r–proteins and rRNA fragments have been determined over the past years (for reviews see Moore, 1998; Nikonov et al., 1998). The next phase will ascertain the relative orientations of the components, and the first complex of an r–protein with a cognate rRNA fragment has recently been solved (Conn et al., 1999; Wimberly et al., 1999). The ultimate picture will eventually emerge from the electron microscopic (Stark et al., 1997; Agrawal et al., 1998) and crystal structures of the entire subunits (Ban et al., 1999; Clemons et al., 1999) and ribosomes (Cate et al., 1999). As demonstrated recently, the crystal and NMR structures of isolated ribosomal parts are valuable guides in the interpretation of the intermediate resolution electron density maps of these giant particles (Ban et al., 1999; Cate et al., 1999; Clemons et al., 1999).
So far the subunits from only a limited number of organisms promise a direct high-resolution X–ray picture of the assemblies, i.e. the large subunit of the archaeon Haloarcula marismortui (von Bohlen et al., 1991; Ban et al., 1999) and the small subunit of the bacterium Thermus thermophilus (Yusupov et al., 1991; Clemons et al., 1999). While the overall organization of the subunits will be similar in bacteria and archaea, certain proteins of one kingdom have no or only a distantly related homolog in the other, nurturing the ongoing quest for crystal structures of isolated components. In addition, some r–proteins fulfill extraribosomal functions (Wool, 1996), and it will be interesting to see how their structures are influenced by incorporation into the ribosome.
All but one r–protein, L12, exist in single copies in ribosomes (Subramanian, 1975) and consequently the complexes they engage in contain more than one molecular species. In an initial attempt to determine r–protein complex structures we chose this multicopy protein of the large subunit from the hyperthermophilic bacterium Thermotoga maritima. L12 is one of the few r–proteins associated with well defined functions. The ribosomal translation pace and error rate depend critically on the protein (Hamel et al., 1972; Pettersson and Kurland, 1980) and it seems to be involved in the binding of translation factors (Stark et al., 1997) and in factor-dependent GTP hydrolysis (Kischa et al., 1971; Möller et al., 1983). Escherichia coli L12, which is identical to the N–terminally deacetylated protein L7 (Terhorst et al., 1972, 1973), preferentially exists as a dimer, for which various structural models have been proposed (Gudkov et al., 1980, 1995; Maassen et al., 1981; Traut et al., 1995; Bocharov et al., 1996; Hamman et al., 1996a,b). Two dimeric L12 complexes bind via protein L10 to the large subunit (Pettersson et al., 1976), and at least one of the dimers comprises the L12 stalk feature (Tokimatsu et al., 1981; Möller et al., 1983). Crosslinking data suggest that L12 can also visit other locations in the large subunit (Traut et al., 1995; Dey et al., 1998), prompting the idea that its movements may drive tRNA translocation (Kischa et al., 1971; Möller, 1990, 1991). Functionally, L12 can be divided into a C–terminal domain (CTD), neccessary for the GTPase stimulation of translation factors (Kischa et al., 1971), an N–terminal domain (NTD), responsible for dimerization (Gudkov et al., 1995; Hamman et al., 1996b) and L10 binding (Gudkov et al., 1980), and an intervening, flexible hinge region (Liljas and Gudkov, 1987; Bushuev et al., 1989), facilitating independent movements of the terminal domains (Hamman et al., 1996b,c). L12 has only very limited sequence similarity to the corresponding acidic proteins of archaea but the equivalent genetic organization suggests a common overall structure (Liao and Dennis, 1994).
Escherichia coli L12 has previously been subjected to crystallographic studies (Liljas and Kurland, 1976), but only fragments could be crystallized (Liljas et al., 1978). While the structure of the C–terminal globular domain is known (Leijonmarck et al., 1980; Leijonmarck and Liljas, 1987), the N–terminal oligomerization module and the hinge region of the molecule so far remain elusive. Hence, there is ambiguity concerning the mode(s) of dimerization, the structural repertoire of the hinge region and the conformational spectrum of the molecule, as well as the relative orientation(s) of the terminal domains, in spite of a large body of spectroscopic work.
We have recently cloned, expressed and characterized the T.maritima L12 protein (M.C.Wahl, R.Huber, S.Marinkovic, E.Weyher-Stingl and S.Ehlert, in preparation), which is highly homologous to the E.coli counterpart (64.7% sequence identity; Figure 1). Surprisingly, the protein was found in tetrameric form in solution, and has been crystallized intact with multiple copies per asymmetric unit. Herein we describe the structures of L12 complexes at high resolution in two different crystal forms, determined by the multiple wavelength anomalous diffraction (MAD) method. Albeit homo-molecular, the structures are the first of an isolated complex of r–proteins.

Fig. 1. Alignment of 21 representative bacterial L12 molecules. Sequence numbering is according to the T.maritima protein. The secondary structure elements as found in a full-length molecule of the present orthorhombic crystal structure are indicated by standard symbols underneath the alignment. Positions with a conservation value of ≥9 and ≥5 (ALSCRIPT; Barton, 1993) are shown in front of red and yellow backgrounds, respectively. The alignment was done with the PILEUP option of the Wisconsin package [version 9.1, Genetics Computer Group (GCG), Madison, WI] using default parameters. The figure was produced with ALSCRIPT (Barton, 1993).
Results
Structure solution and quality of the models
The experimental electron density maps of the I213 crystals at 2.6Å resolution were of excellent quality (Figure 2A) and allowed unequivocal chain tracing. The density was in accord with the amino acid sequence derived from the T.maritima L12 gene (Nelson et al., 1999). Anomalous difference Fourier maps clearly identified the N–terminal methionines and position 74 in the Ile74Met mutants. The resulting asymmetric unit contained two full-length L12 monomers (residues 1–128) forming a core dimer, and two N–terminal fragments of slightly different lengths (residues 1–35 and 1–40). Each monomer of the central dimer was associated with one peripheral N–terminal fragment (see below).

Fig. 2. (A) Experimental MAD electron density at 2.6 Å resolution for the I213 structure in the area of the hinge regions. (B) Annealed composite 2Fo–Fc ‘omit’ map at 2.0 Å resolution for the C2221 structure covering the same region. Both maps are contoured at the 1σ level. It is obvious that the flexible hinge is well defined in the electron density. Unless otherwise indicated, all figures were produced with the programs MOLSCRIPT/BOBSCRIPT (Kraulis, 1991) and RASTER3D (Merrit and Murphy, 1994).
The core dimer structure of the I213 crystals produced a well separated solution in rotation/translation searches for the C2221 crystals. In the initial electron density maps of the orthorhombic crystals, areas corresponding to additional N–terminal fragments, not contained in the search models, were clearly visible up to sequence position 32. The potential model bias in the C2221 structure was minimized by the exploitation of the 2–fold non-crystallographic symmetry (see below) and by the incorporation of simulated annealing protocols in the refinement.
The model building and refinement strategies produced two very comparable structures in the two crystal systems. Root mean square deviations (r.m.s.d.) between common Cα atoms of the component parts within one crystal structure and between the two structures ranged from 0.2 to 0.7 Å. Both models have been refined to comparable working and free R–factors (Table I). The mean positional errors according to Luzzati (Luzzati, 1952) amounted to 0.36 and 0.31 Å for the cubic and orthorhombic structures, respectively. During the refinement a good overall geometry has been maintained with >95% of the non-glycine residues in the conformationally most preferred φ/ψ regions and the remainder in additionally allowed areas. At a resolution of 2.0 Å (C2221) and 2.4 Å (I213), all main chain atoms and all except some solvent-exposed, hydrophilic side chains were enveloped by the final annealed composite 2Fo–Fc ‘omit’ electron density (Figure 2B). The final Fo–Fc difference maps were essentially featureless at the 3σ level.
Table I. Crystallographic data.
| SeMet |
(Ta6Br12)2+ | Native | ||||
|---|---|---|---|---|---|---|
| f″(Peak) | f′(Edge) | Remote | ||||
| Data collection | ||||||
| Space group | I213 | I213 | C2221 | |||
| Unit cell | a (Å) | 145.54 | 144.74 | 54.33 | ||
| b (Å) | 89.13 | |||||
| c (Å) | 119.63 | |||||
| α = β = γ (°) | 90 | 90 | 90 | |||
| Wavelength (Å) | 0.9745 | 0.9753 | 1.2500 | 1.2500 | 1.000 | |
| Resolution (Å) | 16.0–2.6 | 16.0–2.6 | 16.0–2.6 | 16.0–2.4 | 20–2.0 | |
| Unique reflections | 15920 | 15920 | 15920 | 19877 | 20073 | |
| Redundancy | 6.6 | 6.6 | 6.6 | 6.5 | 3.7 | |
| Completeness (%) | all data | 99.3 | 99.3 | 98.8 | 91.2 | 98.6 |
| last 0.1 Å | 98.9 | 98.7 | 98.6 | 93.7 | 95.1 | |
| I/σ(I) | all data | 22.5 | 22.5 | 12.2 | 12.5 | 22.1 |
| last 0.1 Å | 2.9 | 2.7 | 1.8 | 2.1 | 3.1 | |
| Rmergea (%) | all data | 3.2 | 3.4 | 8.4 | 5.1 | 7.8 |
| last 0.1 Å | 26.0 | 27.5 | 41.2 | 16.6 | 36.7 | |
| Phasing | ||||||
| Resolution (Å) | 15.0–2.6 | 15.0–2.6 | 15.0–2.6 | 15.0–6.0 | ||
| No. of heavy atom sites | 6 | 6 | 6 | 2 | ||
| Phasing powerb | iso | 0.64 | 0.69 | 0.79 | ||
| Rcullisc | iso | 0.91 | 0.90 | 0.87 | ||
| ano | 0.75 | 0.83 | 0.76 | |||
| FOMd | before DM | 0.43 | 0.41 | |||
| after DM | 0.83 | |||||
| Refinement | ||||||
| Resolution (Å) | 8.0–2.4 | 6.0–2.0 | ||||
| Reflections | F≥2σ(F) | 16993 | 18554 | |||
| compl. (%) | 92.6 | 96.5 | ||||
| Protein atoms | 2453 | 2390 | ||||
| Ligand atoms | 36 | – | ||||
| Water oxygens | 289 | 247 | ||||
| Rworke (%) | 22.9 | 22.6 | ||||
| Rfree (%) | 24.1 | 23.5 | ||||
| r.m.s.d. bond lengths (Å) | 0.008 | 0.010 | ||||
| r.m.s.d. bond angles (°) | 1.41 | 1.35 | ||||
| r.m.s.d. dihedral angles (°) | 19.36 | 19.71 | ||||
| r.m.s.d. improper angles (°) | 0.80 | 0.86 | ||||
| r.m.s.d. bonded B (Å2) | main chain | 0.98 | 1.10 | |||
| side chain | 1.60 | 2.09 | ||||
| Luzzati coordinate error (Å) | 0.36 | 0.31 | ||||
aRmerge = ΣhΣi [|I(h, i) – <I(h)> |] / ΣhΣi I, in which I(h, i) is the intensity value of the ith measurement of h and <I(h)> is the corresponding value of h for all i measurements, the summation is over all measurements.
bPhasing power = < |Fh| > / r.m.s.(ɛ), in which < |Fh| > is the mean calculated amplitude for the heavy atom model and r.m.s.(ɛ) is the root mean square lack of closure error for the isomorphous differences.
cRcullis = Σh|Fh(obs) – Fh(calc)| / ΣhFh(obs)
dFOM = figure of merit.
eRwork = Σ |Fobs – Fcalc| / Σ|Fobs|, in which Fobs and Fcalc are the observed and calculated structure factor amplitudes, respectively. Rfree was calculated with a random 5% of the data, which was omitted from all stages of the refinement.
Folding of the monomers and the N–terminal fragments
Unless otherwise indicated, the following discussions are valid both for the C2221 and the I213 system. The sequence and extent of the secondary structure elements observed in the full-length monomers are listed in Table II. Overall, we identified 63% α–helices and 14% β–strands, with the remainder in turns and unclassified coil structure. A predominantly helical structure was also indicated by circular dichroism measurements (M.C.Wahl, R.Huber, S.Marinkovic, E.Weyher-Stingl and S.Ehlert, in preparation). Therefore, the structure of L12 is probably similar in the crystalline environment and in solution.
Table II. Secondary structure.
| Element | Residues I213 | Residues C2221 |
|---|---|---|
| α1 | 3–11 | 3–10 |
| α2 | 15–29 | 15–29 |
| α3 | 30–53 | 30–54 |
| α4 | 70–81 | 70–81 |
| α5 | 85–92 | 85–92 |
| α6 |
108–119 |
108–120 |
| % α–helix |
62.5 |
63.3 |
| β1 | 59–65 | 59–65 |
| β2 | 101–106 | 101–106 |
| β3 |
124–127 |
124–128 |
| % β-strand |
13.3 |
14.1 |
| T1 | 56–59 | 56–59 |
| T2 | 63–66 | – |
| T3 | 66–69 | 66–69 |
| T4 | 67–70 | 67–70 |
| T5 | 94–97 | 94–97 |
| T6 |
97–100 |
97–100 |
| % β–turn | 18.8 | 15.6 |
The full-length L12 monomers feature two structural domains. The N–terminus and the hinge region are composed of three meandering α–helices and are conformationally separated from the globular CTD (Figure 3A). Helices α1 and α2 of the NTD are partly solvent exposed in the complex (see below) and therefore strictly bipathic. The long, smoothly bent hinge helix, α3 (20 residues), is almost entirely composed of the hydrophobic residues Ala, Val, Pro and Gly. Although exposed in the monomers, many of its hydrophobic side chains are buried in the tetrameric assembly (see below). The hinge helix is grafted onto the N–terminus by hydrophobic contacts with helix α2, forming a helical hairpin, while it is flexibly mounted onto the CTD by a loop. For historical reasons helices α1 and α2 will be referred to as the NTD, and helix α3 as the hinge region, although they clearly belong to the same structural domain (Figure 3A).

Fig. 3. (A) Monomer fold of L12. Residues pertaining to the NTD are colored violet, the hinge region is shown in cyan and the CTD in magenta. Secondary structure elements are labeled. (B) Association of two full-length L12 molecules (red and blue) and two N–terminal fragments (green and yellow). Molecules are labeled I–IV as referred to in the text. The main contact areas between the component molecules are labeled a–d. (C) Surface representation of the tetrameric L12 complex indicating the intimacy of the contacts and the complementary shapes of the components. (C) was produced with DINO (http://www.bioz.unibas.ch/~xray/dino).
Up to sequence position 30, the folding in the N–terminal fragments matches that of the full-length molecules, i.e. they exhibit helices α1 and α2. Beyond residue 30 the fragment chains adopt an extended fold. Only in one N–terminal fragment of the I213 structure is this extended hinge region of a significant length (seen up to residue 40). The other three fragments of the orthorhombic and the cubic structures are truncated after residues 32–35.
With an r.m.s.d. of 0.8 Å between the Cα atoms of residues 54–128, the CTDs are structurally very similar to the corresponding fragment from E.coli (Leijonmarck et al., 1980; Leijonmarck and Liljas, 1987). They display a three-stranded antiparallel β–sheet with topology (–1 2X) (Richardson, 1981), which is decorated on one side with three α–helices. Helices α4 and α6 run almost parallel to the strand direction (Figure 3A).
Because of their partitioning into two domains, the size of the L12 monomers is not sufficient to build up an extensive hydrophobic core. Especially, much of the central hydrophobic hinge helix and the hydrophobic furrow formed by the N–terminal helices α1 and α2 (Figure 4A) are left solvent exposed. In order to avoid non-specific aggregation with other molecules, the protein has to associate into oligomers.

Fig. 4. Electrostatic surface potential for the monomer (A), dimer (B) and tetramer (C). A highly acidic surface is visible in the oligomers. The monomer displays several hydrophobic areas, especially in the N–terminal furrow, along the hinge helix and on the underside of the CTD. These patches are efficiently shielded from solvent in the oligomers. Regions used for contacts a–d (Figure 3) are indicated. The figure was produced with GRASP (Nicholls et al., 1991).
Core dimer formation
The overall L12 hetero-tetrameric assemblies can be described as dimers of dimers: the complexes consisting of one full-length molecule and one fragment (Mol I⋅Mol III and Mol II⋅Mol IV; component parts of the quarternary structure are referred to as Mol I–IV as labeled in Figure 3B) are associated via a dimerization of the full-length molecules. Within the tetrameric construct, every molecule possesses a contact area with every other molecule, except for the N–terminal fragments among themselves. These contacts are described in detail below.
In both crystal structures two full-length L12 monomers, Mol I and II, embrace each other, forming a core dimer through interactions that involve a large portion of the hinge regions and additional NTD–NTD and NTD–CTD contacts (Figure 3B; Table III; dimerization mode I). In the process they bury almost 3000 Å2 of surface area. The resulting dimer possesses a non-crystallographic 2–fold rotational symmetry, which also relates the two additional N–terminal fragments (see below). The central contact module for the core dimer is a four-helix bundle with an approximately –130° helix crossover angle (contact region a, Figures 3B and 4). It is constructed from the helical hairpins formed by α2 and α3 (Figure 5A). Contacts in this region are almost exclusively hydrophobic. Additionally, helix α1 and the following turn to α2 of one monomer line the bottom of the CTD of the partner molecule, contacting residues in the loop between helices α4 and α5, the N–terminal part of β-strand 1, and the C–terminal part of β2 (contact region c, Figure 3B). These interactions involve hydrophobic contacts, hydrogen bonds and a salt bridge (Glu17I–Lys103II; subscripts refer to molecules as labeled in Figure 3B).
Table III. Dimerization.
| Parameter |
I213 |
C2221 |
Homodimersa | ||
|---|---|---|---|---|---|
| Mode I | Mode II | Mode I | Mode II | ||
| Molecules | I + II | I + III | I + II | I + III | 32 PDB entriesb |
| II + IV | II + IV | ||||
| ▵ASAc (Å2) | 2936 | 1965 | 2948 | 1958 | 2000d |
| Planaritye | 4.57 | 3.85 | 4.70 | 3.83 | 3.46 (1.72) |
| Length (Å)f | 51.7 | 26.6 | 49.6 | 26.5 | – |
| Breadth (Å)g | 34.6 | 21.7 | 31.6 | 21.7 | – |
| Circularityh | 0.60 | 0.74 | 0.64 | 0.77 | 0.71 (0.17) |
| Segments | 3 | 1 | 3 | 1 | 5.22 (2.55) |
| Gap (Å3)i | 9209 | 2353 | 8153 | 2155 | – |
| Gap indexj | 3.14 | 1.21 | 2.77 | 1.10 | 2.20 (0.87) |
| Polar atoms (%) | 34.9 | 21.0 | 35.4 | 20.9 | – |
| Structure | α–helix | α–helix | α–helix | α–helix | – |
| H-bonds | 11 | 2 | 8 | 2 | 10.3k |
| Salt bridges | 1 | 2 | 0 | 2 | – |
| Bridging H2O | 5 | 3 | 16 | 4 | – |
aFrom Jones and Thornton (1996); monomer Mr ranges from 10 000 to 50 000; standard deviations in parentheses.
cAccessible surface area for both molecules buried upon dimer formation.
dValue for a homodimer of comparable Mr [from Figure 4 of Jones and Thornton (1996)].
er.m.s.d. from best plane through interface.
fLength of the first principal axis of the least-squares plane through the atoms in the interface.
gLength of the second principal axis of the least-squares plane through the atoms in the interface.
hBreadth/length ratio.
iGap volume between the two components of the complex.
jGap volume (Å3)/interface ASA (Å2).
k0.7 hydrogen bonds per 100 Å2 monomer ASA.

Fig. 5. (A) Dimerization mode I showing the four-helix bundle between the α2 and α3 helical hairpins. (B) Dimerization mode II with helices α1, α2 and α3 in a five–helix bundle. The molecule coloring is as in Figure 3. Secondary structure elements are labeled and the directions of the helices are indicated by arrows.
The shape of the resulting core dimers resembles a butterfly, in which the CTDs, the hinge regions and the N–termini form the upper wings, the body and the lower wings of the insect, respectively (Figure 3). The assembly has maximum dimensions of ∼70, 45 and 25 Å. The meandering of the helical elements of the N–terminus and the hinge (helices α1–α3) results in a more compact structure for the dimers than expected from hydrodynamic (Wong and Paradies, 1974) and NMR (Gudkov et al., 1977) measurements. Furthermore, since each CTD is involved in contacts with helix α1 of the other molecule, the relative orientations of the CTDs and the NTDs are restricted, giving rise to a well ordered structure.
Alternative dimerization and tetramer formation
The above core dimer formation leaves the grooves between helices α1 and the hairpins α2–α3 of the NTDs vacant. They are invaded by the adjunct N–terminal fragments (Mol I by Mol III, Mol II by Mol IV; Table III, dimerization mode II). In this second mode of dimerization, two N–termini grasp each other like tweezers (contact region b, Figures 3B and 4). The interaction buries ∼2000 Å2 of surface area. It is maintained by the opposition of hydrophobic faces on helices α1, α2 and α3, and by reciprocal surface salt bridges between residues Glu11 and Lys28 and between Asp4 and Lys24. In this fashion, helices α1–α3 of the full-length molecules are effectively supplemented by the N–terminal fragments to yield a five–helix bundle (Figure 5B). The intimacy of the contacts and the complementarity of the participating surfaces (Figure 3C) suggest that dimerization mode II is also tight and specific.
Finally, we observe contacts between Mol I and IV and between Mol II and III in the hetero-tetramer (contact region d, Figure 3B), which may be a necessary consequence of the two main dimerization modes. In these instances, the very N–terminus of α1 of Mol IV (Mol III) snuggles up against the N–terminal part of β2, the preceding loop, and the loop between α4 and α5 of Mol I (Mol II). Again there is a mixture of connection modes with hydrophobic interactions (Met1III/IV–Val101II/I, Thr2III/IV–Thr81II/I, Met1III/IV/Thr2III/IV–Leu91II/I), hydrogen bonds (main chain N of Thr2III/IV–carbonyl of Val101II/I) and salt bridges (Glu5III/IV–Lys94II/I).
Full-length molecules and fragments
A point in question in the current work was the covalent nature of the two N–terminal fragments observed in addition to the two full-length molecules in both crystal forms. On one hand they could have resulted from a fragmentation during the purification and/or the crystallization. Alternatively, the C–terminal portions of the molecules could be disordered in the crystals. Sodium dodecyl sulfate (SDS) gels of the purified protein and of the cubic crystals revealed a band corresponding to the full-length molecules but degradation was seen after several weeks at room temperature (M.C.Wahl, R.Huber, S.Marinkovic, E.Weyher-Stingl and S.Ehlert, in preparation). Fragmentation is also a likely explanation in light of the observation of the N–terminal pieces in two different crystal forms. In addition, the orthorhombic crystals would exhibit a prohibitively high packing density with four whole molecules per asymmetric unit [Matthews coefficient (VM) = 1.4 Å3/Da; solvent content = 10%]. Finally, the sites of truncation coincide with the area of the protein previously identified as a flexible hinge region, presumably rendering it labile to proteolysis. Spontaneous cleavage has been observed in crystallization trials of E.coli L12 (Liljas et al., 1978).
Discussion
The crystal structures presented of T.maritima L12 are the first of an isolated complex of r–proteins, albeit one that is formed by a single molecular species. Since the protein folding and the higher order structures are essentially identical in two different crystalline environments, the crystallographic models can be expected to bear resemblance to the in vivo and in situ conformation and self association of this only multicopy protein of the large ribosomal subunit. Because of the high degree of conservation of L12 within the bacterial kingdom (Liao and Dennis, 1994; Figure 1), the structures are representative of other bacterial L7/L12 molecules and can be correlated with the large body of biochemical data allotted for the E.coli variant. They could serve to model the stalk region missing in recent electron density maps of 70S ribosomes (Cate et al., 1999). The structures may also be homologous to the distantly related L12 proteins of Archaea and could therefore also be used to model the stalk of the H.marismortui large subunit, which is similarly missing in recent electron density maps (Ban et al., 1999).
Two distinct dimerization modes
It has been shown that the E.coli NTDs are instrumental in the dimer formation of L12, and the 37 N–terminal amino acids were found to be sufficient for a specific interaction (Gudkov et al., 1995). Furthermore, NMR data have led to the proposal of a four-helix bundle between the two N–termini of the complex (Bocharov et al., 1996). A contact between the NTD (residues 1–33 of E.coli) and the CTD (residues 51–120) was excluded and a disordered conformation was suggested for the flexible hinge region (Bocharov et al., 1996). In the present structure we observe two dimerization modes that are both different from those discussed previously. Both types of association seem to be specific, because they display characteristics of known protein–protein interfaces (Table III). For the core dimerization, the most important elements are helices α2 and α3 of the NTD and the hinge region, respectively, which engage in a four-helix bundle. Additionally, unexpected CTD–NTD contacts are involved, rendering the central dimer rather compact in contrast to the long-held view of an elongated shape. Because of the highly conserved sequence of L12 (Figure 1) it is unlikely that the compact dimer is a unique feature of T.maritima.
The NTD is clearly instrumental in the formation of the core complex. However, the core dimerization mode can not account for the facile aggregation observed with a fragment composed of only the 37 N–terminal amino acids (Gudkov et al., 1995). With such fragments, contact region c could not form and contact region a would be severely crippled (Figure 3). Resolution of the problem may come from dimerization mode II: despite the trimming in the region 32–40, the N–terminal fragments adopt the same conformation in the first 30 residues as the full-length molecules, which enables the two species to interact via their hydrophobic clefts. This latter mode of association could be realized by a fragment consisting of only the 37 N–terminal residues, but it is quite different from the postulated four-helix bundle (Bocharov et al., 1996).
Because of the involvement of the non-physiological N–terminal fragments, dimerization mode II may alternatively be an artifact. The fragments could prevent helices α1 and α2 of the full-length molecules from packing against each other. Because of the predominantly antiparallel orientation of the associated N–terminal domains it may not support a solid stalk with all four CTDs pointing in the same general direction without a chain reversal in the hinge region. It is noteworthy that dimerization mode II is not feasible between two full-length molecules in a conformation of the central monomers, seen from a superposition of an intact molecule onto a fragment (Figure 6A). There would be a severe clashing of the hinge helices. Therefore, a dimer associated via mode II would either have to be asymmetric or display alternative conformations in the components. Slight adjustments in the connecting loops between the N–termini and the hinge helices could e.g. avoid the steric hindrance. If such conformational variants existed in vivo, they could play a role in the elongation cycle (Möller et al., 1983; Möller, 1990, 1991) and explain L12's presence in different regions of the large subunit (Traut et al., 1995; Dey et al., 1998).

Fig. 6. (A) Side view of a model dimer that contains the monomers in the observed conformation of the full-length molecules and makes use of dimerization mode II. A severe clash of the hinge helices is obvious in the center. (B) Superposition of residues 1–40 of a full-length L12 molecule (blue) and an N–terminal fragment (yellow) showing the different strand directions and conformations past residues 30.
Summarizing, we observe two seemingly specific but unexpected dimer interactions for T.maritima L12 that explain different parts of the pertaining biochemical and spectroscopic data. This diversity in dimerization may be an explanation for the conflicting evidence, which led to the proposal of parallel, antiparallel, staggered and symmetrical L12 complexes (Gudkov et al., 1980; Maassen et al., 1981; Traut et al., 1995; Bocharov et al., 1996; Hamman et al., 1996a,b). L12 covers most hydrophobic surfaces and crevices during self association avoiding non-specific aggregation.
Conformational and motional flexibility
The polypeptide chain directions and the conformations past residue 30 in the N–terminal fragments and the full-length monomers differ strikingly (Figure 6B). The former exhibit an extended coil structure between residues 30 and 40, seen primarily in the longest fragment, Mol IV, of the cubic space group. The latter incorporates the corresponding residues into the long hinge α–helix. In the intact molecules, helix α3 folds back onto helix α2 of the NTD. In contrast, the chain of the N–terminal fragments runs along the breadth of the core dimer. The lack of a prominent secondary structure in the N–terminal fragments between residues 30 and 40 could simply be a result of the trimming of the polypeptide chain and the concomitant loss of conformational restraints. However, if we assume that the alternative conformation resembled part of an active form of L12 inside the ribosome, the present structures reveal direct evidence for the flexibility of the hinge region (Liljas and Gudkov, 1987; Bushuev et al., 1989; Hamman et al., 1996b,c) and the suggested alternative conformations of L12 in the translational cycle (Möller et al., 1983; Traut et al., 1995; Dey et al., 1998). In accord with the latter view, the site at which the diversity arises maps to the beginning of the hinge region, previously identified as a flexible element. Furthermore, the preceding dimerization module necessitates the adaptation of an alternative conformation to that of the intact molecules (see above). A hinge without an α- or β–type secondary structure is also in agreement with NMR data suggesting a disorder in this region in solution (Bocharov et al., 1996) and a similarly high flexibility inside the ribosome (Gudkov et al., 1982).
Although much evidence points to the high mobility of the CTDs (Traut et al., 1995; Bocharov et al., 1998; Dey et al., 1998) and a large overall flexibility of the complex (Liljas and Gudkov, 1987; Bushuev et al., 1989; Dey et al., 1995), the tetramers of the present crystal structures seem rather stable and well ordered. There are contacts from each component part to every other, except for an interaction between the two N–terminal fragments. The hydrophobic contacts, especially the four-helix bundle between Mol I and II and the N–terminal interdigitation of Mol I/II and III/IV, are likely to be stable contacts. If severed and not replaced by equivalent interactions with other molecules (see below), the exposed hydrophobic areas would give the protein away to non-specific aggregation. However, the grafting of the CTD onto the NTD of the other molecule in the core dimer features a mixture of hydrophilic and hydrophobic interactions. Such interface compositions are characteristic of facultative dimers (Jones and Thornton, 1996). It is therefore possible that these interactions can be intermittently broken and allow relatively free movement of the CTD due to its flexible covalent connection to the hinge region.
Consequences for the interaction with translation factors
The influence of L12 on the elongation factor-dependent GTP hydrolysis (Kischa et al., 1971; Möller et al., 1983) suggests that it might physically interact with these proteins. Indeed, in cryo-electron microscopic images, the stalk region, i.e. presumably L12, can be seen in contact with a ternary EF–Tu complex (Stark et al., 1997) and EF–G (Agrawal et al., 1998). The analogous eukaryotic P1 and P2 proteins have been found to form a tight in vitro complex with eEF–2 (Bargis-Surgey et al., 1999). EF–G and a ternary EF–Tu complex were recently modeled close to the base of the stalk region around r–proteins L6, L11 and L14, and the sarcin–ricin loop of 23S rRNA (Ban et al., 1999), an area that L12 also seems to have access to (Traut et al., 1995; Dey et al., 1998). Taken together, it is likely that bacterial L12 directly interacts with translation factors.
A number of residues in L12 are phylogenetically invariant or ‘quasi-invariant’, i.e. they allow replacement only with very few closely related side chains (Liao and Dennis, 1994; Figure 1). In the crystal structure of the E.coli CTD a crystallographic contact related two units and built up a continuous conserved surface patch (Leijonmarck et al., 1980; Leijonmarck and Liljas, 1987). Such areas could mark functional spots, e.g. the interaction sites with translation factors. In Figure 7 the most conserved residues are mapped to the surface of the T.maritima core dimer, again disclosing some highly conserved patches, the largest of which encompasses the region around helix α5. However, in the present crystal structure we do not observe a direct CTD–CTD interaction, consistent with the notion that these domains can acquire different relative orientations and seem to be quite mobile (Oleinikov et al., 1993). The redundancy due to the presence of two structurally independent CTDs instead of the formation of one contiguous surface by the two components, could explain the finding that single-‘headed’ dimers can functionally substitute for intact dimers in L12-depleted ribosomes (Oleinikov et al., 1998).
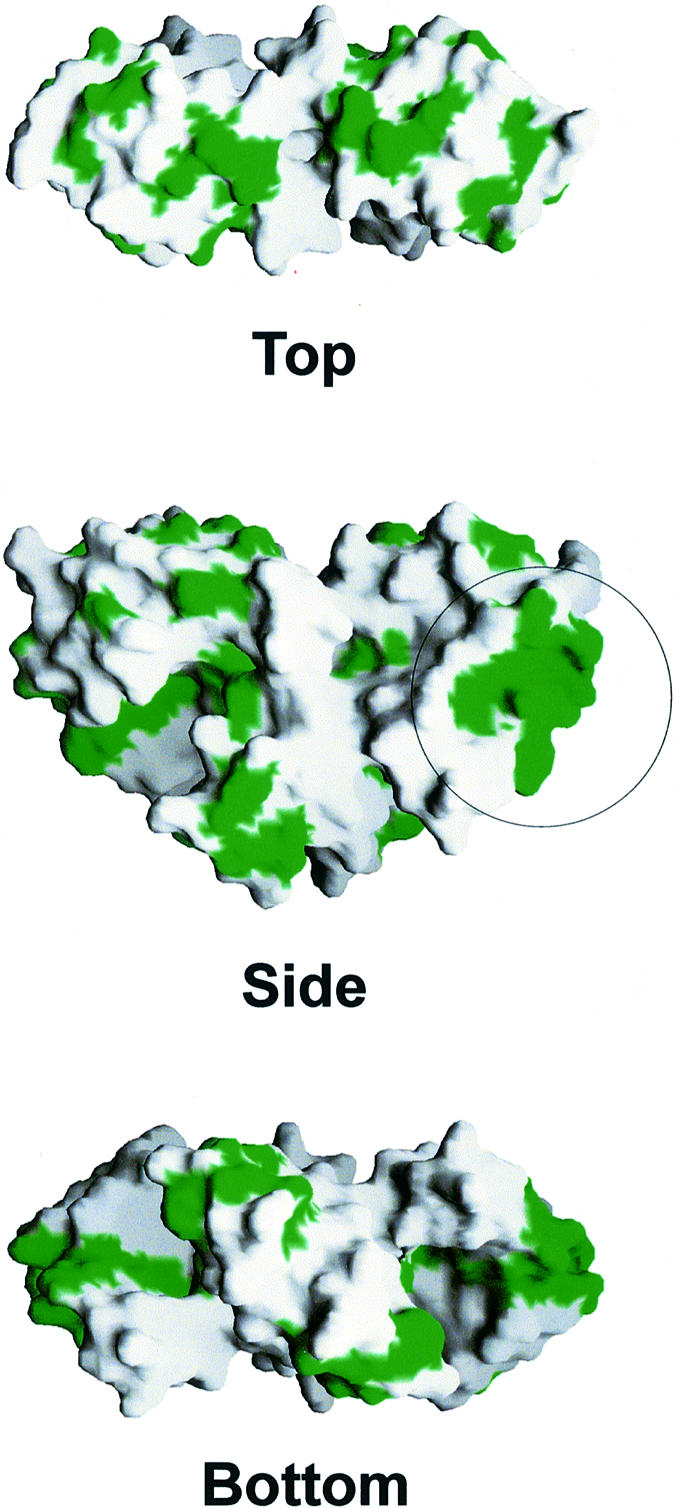
Fig. 7. Highly conserved residues (green) of L12 mapped onto the surface of the core dimer. Views are from the top, side and bottom as indicated. The most extensive area of conserved side chains is visible around helix α5 (circled, compare with Figure 3). The conserved residues may be instrumental in the interaction with L10 (bottom view) and translation factors (side and top views). The figure was produced with GRASP (Nicholls et al., 1991).
Implications for L10 binding
L12 forms a very stable 4:1 complex with r–protein L10 (Pettersson et al., 1976) via its NTDs (Gudkov et al., 1982). L10 binds two L12 dimers at non-equivalent sites (Gudkov et al., 1980), and upon binding the L12 N–termini are separated (Traut et al., 1995; Hamman et al., 1996a). Chemical shift data suggest that in E.coli residue Phe30 of L12 (corresponding to Phe29 in T.maritima L12) is directly involved in L10 contacts (Gudkov et al., 1982). Furthermore, in experiments with modified cysteine mutants of E.coli L12, residues 12 and 33 could be crosslinked to L10 (Traut et al., 1995; Dey et al., 1998). In turn, crosslinking residues 12 or 33 within L12 dimers abolished L10 binding (Oleinikov et al., 1993; Traut et al., 1995). Overall, the structure of L12 when bound to L10 or the ribosome was found to be similar to that in solution (Gudkov et al., 1982).
We propose that the aggregation of the N–terminal L12 fragments and the core dimer in the present structures models to some degree the interaction of r–protein L10 with an L12 dimer. Residues Glu11, Phe29 and Thr32, corresponding to the above mentioned E.coli Ala12, Phe30 and Ser33, respectively, are found in the N–terminal clefts, the turn between helices α2 and α3, and in the first turn of helix α3 in the core dimers, i.e. they map along the path of the peripheral N–terminal fragments (Figure 8). Furthermore, Glu11I/II engages in a salt bridge with Lys28III/IV and vice versa. Phe29I/II is in van der Waals contact with the hydrophobic portion of the Glu11III/IV side chain. If we assume that L10 binds L12 in the form of the core dimers, the above residues clearly point to the L12 N–terminal furrows as the binding site. Supporting this conclusion, Thr32I/II approach Thr32IV/III closer than 9 Å, while the corresponding residue pair maintains a distance of 13 Å in the core dimer. The above mentioned L12 self-crosslinks via Thr32 (Ser33 in E.coli) therefore may have fixed one L12 molecule in the N–terminal cleft of another, with a concomitant loss of L10 binding. Similarly, Glu11I/II are closer to Glu11IV/III than Glu11I is to Glu11II (18 versus 25 Å), but with these residues neither crosslinking is immediately obvious from the structure. Assuming that L10 bound to L12 in the form of the core dimers and that the N–terminal crevices of the latter were occupied by other L12 molecules, those molecules would have to be chased from the clefts by L10. L10 regulates the transcription of its own operon in order to balance r–protein production with the availability of rRNA (Wool, 1996). The transcriptional control is enhanced in the presence of L12, suggesting a stabilization of the active L10 structure. Consistently, the L12 N–terminal clefts could serve as excellent folding scaffolds for L10.

Fig. 8. Wire diagram of the core L12 dimer (molecule coloring as in Figure 3) with residues Glu11, Phe29 and Thr32 in space filling mode and the molecular surface indicated as a glassy envelope. The six residues emphasized, critical for the interaction with r–protein L10, line the N–terminal furrows, marking the path of the additional N–terminal fragments (green and yellow). The figure was produced with DINO (http://www.bioz.unibas.ch/~xray/dino).
Thermostability
While E.coli L12 does not maintain an ordered structure above 60°C (Todorova et al., 1996), the T.maritima protein exhibits a melting temperature above 100°C (M.C.Wahl, R.Huber, S.Marinkovic, E.Weyher-Stingl and S.Ehlert, in preparation). Two major features of the T.maritima structure can be discerned that are likely to be associated with the increased stability. First, the association of the molecules into dimers and tetramers allows the effective burial of most hydrophobic residues. Because the 128 residues are used to create two separate domains in the monomer, the protein is only able to construct a true hydrophobic core in an oligomeric assembly. This observation agrees with the assumption that at least ∼1000 non-hydrogen atoms are needed to build up a protein hydrophobic core (Spassov et al., 1995). Secondly, we observe a large number of Glu and Asp surface residues, which lead to the extremely negative surface potential. Interspersed are Lys residues and a single Arg side chain that allow the formation of a multitude of surface salt bridges and electrostatic contacts. Indeed, the protein core seems to be enveloped by a ‘bag’ of electrostatic clamps. Consistently, a recent statistical survey suggested that surface salt bridges can effectively stabilize a protein against thermal denaturation, while buried electrostatic contacts would be unfavorable (Xiao and Honig, 1999). Interestingly, the highly negative surface of L12 is reminiscent of the surfaces of halophilic proteins (Dym et al., 1995; Frolow et al., 1996), agreeing with the observation that very high salt concentrations were necessary to precipitate L12 during crystallization trials (M.C.Wahl, R.Huber, S.Marinkovic, E.Weyher-Stingl and S.Ehlert,). It seems therefore, that a protein surface with a highly electronegative potential and a large number of charged interactions can confer upon proteins resistance against denaturation by both heat and salt.
Materials and methods
Crystallization, data collection and processing
Crystals of T.maritima L12 were produced as described previously (M.C.Wahl, R.Huber, S.Marinkovic, E.Weyher-Stingl and S.Ehlert, in preparation). Briefly, 5 μl of an ∼15 mg/ml solution of the protein in 10 mM N–(2–hydroxyethyl)piperazine-N′–(2–ethanesulfonic acid) (HEPES) pH 7.0 were mixed with a 1.5 μl reservoir (3.23 M ammonium sulfate, 0.1 M sodium citrate pH 4.0) and 0.5 μl of 30% polyethylene glycol (PEG) 200, and equilibrated as sitting drops against a 500 μl reservoir at room temperature. Cubic crystals appeared after several days, grew for ∼1 week, and were stabilized by sequential soaking in (i) 2.8 M ammonium sulfate, 70 mM sodium citrate pH 4.0, 10% (v/v) PEG 200 (harvest buffer I) and (ii) 2.5 M ammonium sulfate, 70 mM sodium citrate pH 4.0, 15% (v/v) PEG 200 (harvest buffer II). Crystals soaked in harvest buffer II could be shock frozen in a cryogenic nitrogen stream (100 K; Oxford Cryosystems, Oxford, UK) for prolonged exposure in a synchrotron X–ray beam. Crystals of a selenomethionine (SeMet) derivative (mutant Ile74Met) were obtained and handled under similar conditions. (Ta6Br12)2+ derivative crystals were produced by soaking the native L12 crystals for several weeks in a solution of 10 mM (Ta6Br12)2+ in harvest buffer I. Before the diffraction measurements, the crystals were transferred to metal-free harvest buffer II. Orthorhombic crystals grew under similar reservoir conditions to those for the cubic crystals with slightly increased ammonium sulfate concentrations. Their preparation for data collection was similar to that of the cubic crystals.
Data were collected at the BW6 synchrotron beamline at DORIS (Deutsches Elektronen Synchrotron, Hamburg, Germany) using one SeMet and one (Ta6Br12)2+ crystal of the cubic form and a single specimen of the orthorhombic morphology. The X–ray fluorescence spectra of the derivative crystals were measured in the vicinity of the selenium K–edge and the tantalum LIII–edge, respectively. The real and imaginary dispersion terms as a function of photon energy were deduced from the acquired absorption spectra. Six 30° φ–scans covering both Friedel-sectors at the SeMet f′′–maximum (λ = 0.9745 Å), the f′–minimum (λ = 0.9753 Å) and a remote wavelength (λ = 1.25 Å) were collected for the first crystal. Two similar scans were performed with the second crystal at the (Ta6Br12)2+ f′′–maximum (λ = 1.25 Å). Data for the orthorhombic crystal were collected in a 100° φ–scan. All datasets were analyzed and processed with the HKL package (Otwinowski and Minor, 1996). The results from the data collection and reduction are summarized in Table I.
Phase generation, model building and refinement
The location of the heavy atom sites and the phasing of the data were undertaken with programs from the CCP4 collection (Collaborative Computational Project, 1994). The centroids of two (Ta6Br12)2+ clusters were identified in anomalous difference Patterson maps (program RSPS) and yielded preliminary phases to 6 Å resolution (program MLPHARE). This phase information was sufficient to locate six selenium centers of the SeMet crystal in anomalous difference Fourier maps (program FFT). The selenium positions phased the three-wavelength MAD data with an overall figure of merit of 0.43 and 0.83 at 2.6 Å before and after solvent flattening (DM), respectively (Table I).
Model building was carried out in MAIN (Turk, 1996) and refinement was done with the CNS package (Brünger et al., 1998). Initially, the model was built into the experimental electron density maps of the cubic SeMet data. The density was of excellent quality and allowed the unambiguous chain tracing of all protein components and the subsequent incorporation of side chains (Figure 2A). After initial rounds of positional minimization and B-factor refinement, the model was transferred to the slightly higher resolved (Ta6Br12)2+ derivative data and further refined by incorporation of two partially occupied (Ta6Br12)2+ clusters and water molecules.
The central dimer of the cubic structure (see Results) served as the model in a rotation/translation search with the orthorhombic data truncated at 3.5 Å resolution (AMoRe; Navaza, 1994). A solution with a correlation coefficient of 46.3% and an R–factor of 49.1% was found, which was well separated from the next highest peaks and packed in the crystal without clashes. After several cycles of rigid-body and positional refinement to incorporate sequentially all data with F ≥2σ(F) up to 2.0 Å resolution, 2Fo–Fc difference electron density maps were calculated and revealed the presence of two additional molecular fragments in the N–terminal grooves of the dimer. After model building of these fragments and further refinement, one round of simulated annealing (Kuriyan et al., 1989; Brünger et al., 1997) was performed in order to reduce the model bias. Water molecules were incorporated and checked for their authenticity by automated procedures (CNS).
During all refinement procedures the free R–factor (Rfree) was monitored using 5% of the observed reflections. Until late in the refinement process the atomic positions of the models were restrained by the observed non-crystallographic symmetries, which in both crystal forms related, respectively, the two full-length molecules and the two N–terminal fragments. After convergence of Rfree, a sequence of B–factor and positional refinements against all data with F ≥2σ(F) was performed. Annealed composite 2Fo–Fc ‘omit’ maps, leaving out 10% portions of the models, were calculated and minor adjustments were manually performed where necessary. Table I lists relevant parameters of the refinement processes. The structures have been submitted to the Protein Databank (http://www.rscb.org/pdb) (Bernstein et al., 1977) under accession numbers 1DD3 and 1DD4.
Acknowledgments
Acknowledgements
M.C.W. was supported by postdoctoral fellowships from the Deutsche Forschungsgemeinschaft and the Peter-Und-Traudl-Engelhorn-Stiftung.
References
- Agrawal R.K., Penczek, P., Grassucci, R.A. and Frank, J. (1998) Visualization of elongation factor G on the Escherichia coli 70S ribosome: the mechanism of translocation. Proc. Natl Acad. Sci. USA, 95, 6134–6138. [DOI] [PMC free article] [PubMed] [Google Scholar]
- Ban N., Nissen, P., Hansen, J., Capel, M., Moore, P.B. and Steitz, T.A. (1999) Placement of protein and RNA structures into a 5 Å-resolution map of the 50S ribosomal subunit. Nature, 400, 841–847. [DOI] [PubMed] [Google Scholar]
- Bargis-Surgey P., Lavergne, J.P., Gonzalo, P., Vard, C., Filhol–Cochet, O. and Reboud, J.P. (1999) Interaction of elongation factor eEF-2 with ribosomal P proteins. Eur. J. Biochem., 262, 606–611. [DOI] [PubMed] [Google Scholar]
- Barton G.J. (1993) ALSCRIPT—a tool for multiple sequence alignments. Protein Eng., 6, 37–40. [DOI] [PubMed] [Google Scholar]
- Bernstein F.C., Koetzle, T.F., Williams, G.J.B., Meyer, E.F.,Jr, Brice, M.D., Rogers, J.R., Kennard, O., Schimanouchi, T. and Tasumi, M.J. (1977) The protein data bank: a computer-based archieval file for macromolecule structures. J. Mol. Biol., 112, 535–542. [DOI] [PubMed] [Google Scholar]
- Bocharov E.V., Gudkov, A.T. and Arseniev, A.S. (1996) Topology of the secondary structure elements of ribosomal protein L7/L12 from E.coli in solution. FEBS Lett., 379, 291–294. [DOI] [PubMed] [Google Scholar]
- Bocharov E.V., Gudkov, A.T., Budovskaya, E.V. and Arseniev, A.S. (1998) Conformational independence of N- and C-domains in ribosomal protein L7/L12 and in the complex with protein L10. FEBS Lett., 423, 347–350. [DOI] [PubMed] [Google Scholar]
- Brünger A.T., Adams, P.D. and Rice, L.M. (1997) New applications of simulated annealing in X-ray crystallography and solution NMR. Structure, 5, 325–336. [DOI] [PubMed] [Google Scholar]
- Brünger A.T. et al. (1998) Crystallography & NMR system: a new software suite for macromolecular structure determination. Acta Crystallogr. D, 54, 905–921. [DOI] [PubMed] [Google Scholar]
- Bushuev V.N., Gudkov, A.T., Liljas, A. and Sepetov, N.F. (1989) The flexible region of protein L12 from bacterial ribosomes studied by proton nuclear magnetic resonance. J. Biol. Chem., 264, 4498–4505. [PubMed] [Google Scholar]
- Cate J.H., Yusupov, M.M., Yusupova, G.Z., Earnest, T.N. and Noller, H.F. (1999) X-ray crystal structures of 70S ribosome functional complexes. Science, 285, 2095–2104. [DOI] [PubMed] [Google Scholar]
- Clemons W.M., May, J.L.C., Wimberly, B.T., McCutcheon, J.P., Capel, M.S. and Ramakrishnan, V. (1999) Structure of a bacterial 30S ribosomal subunit at 5.5 Å resolution. Nature, 400, 833–840. [DOI] [PubMed] [Google Scholar]
- Collaborative Computational Project, Number 4 (1994) The CCP4 suite: programs for protein crystallography. Acta Crystallogr. D 50, 760–763. [DOI] [PubMed] [Google Scholar]
- Conn G.L., Draper, D.E., Lattman, E.E. and Gittis, A.G. (1999) Crystal structure of a conserved ribosomal protein–RNA complex. Science, 284, 1171–1174. [DOI] [PubMed] [Google Scholar]
- Dey D., Oleinikov, A.V. and Traut, R.R. (1995) The hinge region of Escherichia coli ribosomal protein L7/L12 is required for factor binding and GTP hydrolysis. Biochimie, 77, 925–930. [DOI] [PubMed] [Google Scholar]
- Dey D., Bochkariov, D.E., Jokhadze, G.G. and Traut, R.R. (1998) Cross-linking of selected residues in the N- and C–terminal domains of Escherichia coli protein L7/L12 to other ribosomal proteins and the effect of elongation factor Tu. J. Biol. Chem., 273, 1670–1676. [DOI] [PubMed] [Google Scholar]
- Dym O., Mevarech, M. and Sussman, J.L. (1995) Structural features that stabilize halophilic malate dehydrogenase from an archaebacterium. Science, 267, 1344–1346. [DOI] [PubMed] [Google Scholar]
- Frolow F., Harel, M., Sussman, J.L., Mevarech, M. and Shoham, M. (1996) Insights into protein adaptation to a saturated salt environment from the crystal structure of a halophilic 2Fe–2S ferredoxin. Nature Struct. Biol., 3, 452–458. [DOI] [PubMed] [Google Scholar]
- Gudkov A.T., Behlke, J., Vtiurin, N.N. and Lim, V.I. (1977) Tertiary and quarternary structure for ribosomal protein L7 in solution. FEBS Lett., 82, 125–129. [DOI] [PubMed] [Google Scholar]
- Gudkov A.T., Tumanova, L.G., Gongadze, G.M. and Bushuev, V.N. (1980) Role of different regions of ribosomal proteins L7 and L10 in their complex formation and the interaction with the ribosomal 50S subunit. FEBS Lett., 109, 34–38. [DOI] [PubMed] [Google Scholar]
- Gudkov A.T., Gongadze, G.M., Bushuev, V.N. and Okon, M.S. (1982) Proton nuclear magnetic resonance study of the ribosomal protein L7/L12 in situ. FEBS Lett., 138, 229–232. [DOI] [PubMed] [Google Scholar]
- Gudkov A.T., Budovskaya, E.V. and Sherstobaeva, N.M. (1995) The first 37 residues are sufficient for diimerization of ribosomal L7/L12 protein. FEBS Lett., 367, 280–282. [DOI] [PubMed] [Google Scholar]
- Hamel E., Koka, M. and Nakamoto, T. (1972) Requirement of an Escherichia coli 50S ribosomal protein component for effective interaction of the ribosome with T and G factors and with guanosine triphosphate. J. Biol. Chem., 247, 805–814. [PubMed] [Google Scholar]
- Hamman B.D., Oleinikov, A.V., Jokhadze, G.G., Bochkariov, D.E., Traut, R.R. and Jameson, D.E. (1996a) Tetramethylrhodamine dimer formation as a spectroscopic probe of the conformation of Escherichia coli ribosomal protein L7/L12 dimers. J. Biol. Chem., 271, 7568–7573. [DOI] [PubMed] [Google Scholar]
- Hamman B.D., Oleinikov, A.V., Jokhadze, G.G., Traut, R.R. and Jameson, D.M. (1996b) Dimer/monomer equilibrium and domain separations of Escherichia coli ribosomal protein L7/L12. Biochemistry, 35, 16680–16686. [DOI] [PubMed] [Google Scholar]
- Hamman B.D., Oleinikov, A.V., Jokhadze, G.G., Traut, R.R. and Jameson, D.M. (1996c) Rotational and conformational dynamics of Escherichia coli ribosomal protein L7/L12. Biochemistry, 35, 16672–16679. [DOI] [PubMed] [Google Scholar]
- Jones S. and Thornton, J.M. (1996) Principles of protein–protein interactions. Proc. Natl Acad. Sci. USA, 93, 13–20. [DOI] [PMC free article] [PubMed] [Google Scholar]
- Kischa K., Möller, W. and Stöffler, G. (1971) Reconstitution of a GTPase activity by a 50S ribosomal protein from E.coli. Nature New Biol., 233, 62–63. [DOI] [PubMed] [Google Scholar]
- Kraulis P.J. (1991) MOLSCRIPT: a program to produce both detailed and schematic plots of protein structures. J. Appl. Crystallogr., 24, 946–950. [Google Scholar]
- Kuriyan J., Brünger, A.T., Karplus, M. and Hendrickson, W.A. (1989) X–ray refinement of protein structures by simulated annealing: test of the method on myohemerythrin. Acta Crystallogr. A, 45, 396–409. [DOI] [PubMed] [Google Scholar]
- Leijonmarck M. and Liljas, A. (1987) Structure of the C–terminal domain of the ribosomal protein L7/L12 from Escherichia coli at 1.7 Å. J. Mol. Biol., 195, 555–579. [DOI] [PubMed] [Google Scholar]
- Leijonmarck M., Eriksson, S. and Liljas, A. (1980) Crystal structure of a ribosomal component at 2.6 Å resolution. Nature, 286, 824–826. [DOI] [PubMed] [Google Scholar]
- Liao D. and Dennis, P.P. (1994) Molecular phylogenies based on ribosomal protein L11, L1, L10 and L12 sequences. J. Mol. Evol., 38, 405–419. [DOI] [PubMed] [Google Scholar]
- Liljas A. and Gudkov, A.T. (1987) The structure and dynamics of ribosomal protein L12. Biochimie, 69, 1043–1047. [DOI] [PubMed] [Google Scholar]
- Liljas A. and Kurland, C.G. (1976) Crystallization of ribosomal protein L7/L12 from Escherichia coli. FEBS Lett., 72, 130–132. [DOI] [PubMed] [Google Scholar]
- Liljas A., Erikssson, S., Donner, D. and Kurland, C.G. (1978) Isolation and crystallization of stable domains of the protein L7/L12 from Escherichia coli ribosomes. FEBS Lett., 88, 300–304. [DOI] [PubMed] [Google Scholar]
- Luzzati V. (1952) Traitement statistique des erreurs dans la détermination des structures cristallines. Acta Crystallogr. A, 5, 802–810. [Google Scholar]
- Maassen J.A., Schop, E.N. and Möller, W. (1981) Structural analysis of ribosomal protein L7/L12 by the heterobifunctional cross-linker 4-(6-formyl-3-azidophenoxy)butyrimidate. Biochemistry, 20, 1020–1025. [DOI] [PubMed] [Google Scholar]
- Merrit E.A. and Murphy, M.E.P. (1994) RASTER3D version 2.0. A program for photorealistic molecular graphics. Acta Crystallogr. D, 50, 869–873. [DOI] [PubMed] [Google Scholar]
- Möller W. (1990) Hypothesis: ribosomal protein L12 drives rotational movement of tRNA. In Hill,W., Dahlberg,A., Garret,R.A., Moore,P.B., Schlessinger,D. and Warner,J.R. (eds), The Ribosome—Structure, Function and Evolution. The American Society of Microbiology, Washington, DC, pp. 380–389. [Google Scholar]
- Möller W. (1991) Functional aspects of ribosomal proteins. Biochimie, 73, 1093–1100. [DOI] [PubMed] [Google Scholar]
- Möller W., Schrier, P.I., Maassen, J.A., Zantema, A., Schop, E., Reinalda, H., Cremers, A.F. and Mellema, J.E. (1983) Ribosomal proteins L7/L12 of Escherichia coli. Localization and possible molecular mechanism in translation. J. Mol. Biol., 163, 553–573. [DOI] [PubMed] [Google Scholar]
- Moore P.B. (1998) The three-dimensional structure of the ribosome and its components. Annu. Rev. Biophys. Biomol. Struct., 27, 35–58. [DOI] [PubMed] [Google Scholar]
- Navaza J. (1994) AMoRe: an automated package for molecular replacement. Acta Crystallogr. A, 50, 157–163. [Google Scholar]
- Nelson K.E., et al. (1999) Evidence for lateral gene transfer between Archaea and bacteria from genome sequence of Thermotoga maritima. Nature, 399, 323–329. [DOI] [PubMed] [Google Scholar]
- Nicholls A., Sharp, K.A. and Honig, B. (1991) Protein folding and association: insights from the interfacial and thermodynamics properties of hydrocarbons. Proteins, 11, 281–296. [DOI] [PubMed] [Google Scholar]
- Nikonov S.V., Nevskaya, N.A., Fedorov, R.V., Khairullina, A.R., Tishchenko, S.V., Nikulin, A.D. and Garber, M.B. (1998) Structural studies of ribosomal proteins. Biol. Chem., 379, 795–805. [DOI] [PubMed] [Google Scholar]
- Oleinikov A.V., Jokhadze, G.G. and Traut, R.R. (1993) Escherichia coli ribosomal protein L7/L12 dimers remain fully active after interchain crosslinking of the C–terminal domains in two orientations. Proc. Natl Acad. Sci. USA, 90, 9828–9831. [DOI] [PMC free article] [PubMed] [Google Scholar]
- Oleinikov A.V., Jokhadze, G.G. and Traut, R.R. (1998) A single-headed dimer of Escherichia coli ribosomal protein L7/L12 supports protein synthesis. Proc. Natl Acad. Sci. USA, 95, 4215–4218. [DOI] [PMC free article] [PubMed] [Google Scholar]
- Otwinowski Z. and Minor, W. (1996) Processing of X-ray diffraction data collected in oscillation mode. Methods Enzymol., 276, 307–326. [DOI] [PubMed] [Google Scholar]
- Pettersson I. and Kurland, C.G. (1980) Ribosomal protein L7/L12 is required for optimal translation. Proc. Natl Acad. Sci. USA, 77, 4007–4010. [DOI] [PMC free article] [PubMed] [Google Scholar]
- Pettersson I., Hardy, S.J.S. and Liljas, A. (1976) The ribosomal protein L8 is a complex L7/L12 and L10. FEBS Lett., 64, 135–138. [DOI] [PubMed] [Google Scholar]
- Richardson J.S. (1981) The anatomy and taxonomy of protein structure. Adv. Protein Chem., 34, 167–339. [DOI] [PubMed] [Google Scholar]
- Spassov V.Z., Karshikoff, A.D. and Ladenstein, R. (1995) The optimization of protein–solvent interactions: thermostability and the role of hydrophobic and electrostatic interactions. Protein Sci., 4, 1516–1527. [DOI] [PMC free article] [PubMed] [Google Scholar]
- Stark H., Rodnina, M.V., Rinke–Appel, J., Brimacombe, R., Wintermeyer, W. and van Heel, M. (1997) Visualization of elongation factor Tu on the Escherichia coli ribosome. Nature, 389, 403–406. [DOI] [PubMed] [Google Scholar]
- Subramanian A.R. (1975) Copies of proteins L7 and L12 and heterogeneity of the large subunit of Escherichia coli ribosome. J. Mol. Biol., 95, 1–8. [DOI] [PubMed] [Google Scholar]
- Terhorst C., Wittmann–Liebold, B. and Möller, W. (1972) 50-S ribosomal proteins. Peptide studies on two acidic proteins, A1 and A2, isolated from 50-S ribosomes of Escherichia coli. Eur. J. Biochem., 25, 13–19. [DOI] [PubMed] [Google Scholar]
- Terhorst C., Möller, W., Laursen, R. and Wittmann–Liebold, B. (1973) The primary structure of an acidic protein from 50-S ribosomes of Escherichia coli which is involved in GTP hydrolysis dependent on elongation factors G and T. Eur. J. Biochem., 34, 138–152. [DOI] [PubMed] [Google Scholar]
- Todorova R.T., Rogov, V.V., Vasilenko, K.S. and Permyakov, E.A. (1996) Study of tyrosine-containing mutants of ribosomal protein L7/L12 from Escherichia coli. Biophys. Chem., 62, 39–45. [DOI] [PubMed] [Google Scholar]
- Tokimatsu H., Strycharz, W.A. and Dahlberg, A.E. (1981) Gel electrophoretic studies on ribosomal proteins L7/L12 and the Escherichia coli 50S subunit. J. Mol. Biol., 152, 397–412. [DOI] [PubMed] [Google Scholar]
- Traut R.R., Dey, D., Bochkariov, D.E., Oleinikov, A.V., Jokhaze, G.G., Hamman, B. and Jameson, D. (1995) Location and domain structure of Escherichia coli ribosomal protein L7/L12: site specific cysteine crosslinking and attachment of fluorescent probes. Biochem. Cell. Biol., 73, 949–958. [DOI] [PubMed] [Google Scholar]
- Turk D. (1996) MAIN 96: an interactive software for density modifications, model building, structure refinement and analysis. In Bourne,P.E. and Watenpaugh,K. (eds), Meeting of the International Union of Crystallography Macromolecular Macromolecular Computing School. International Union of Crystallography. [Google Scholar]
- von Bohlen K. et al. (1991)Characterization and preliminary attempts for derivatization of crystals of large ribosomal subunits from Haloarcula marismortui diffracting to 3 Å resolution. J. Mol. Biol., 222, 11–15. [DOI] [PubMed] [Google Scholar]
- Wimberly B.T., Guymon, R., McCutcheon, J.P., White, S.W. and Ramakrishnan, V. (1999) A detailed view of a ribosomal active site: the structure of the L11–RNA complex. Cell, 97, 491–502. [DOI] [PubMed] [Google Scholar]
- Wong K.-P. and Paradies, H.H. (1974) Shape properties of proteins L7 and L12 from E.coli ribosomes. Biochem. Biophys. Res. Commun., 61, 178–184. [DOI] [PubMed] [Google Scholar]
- Wool I.G. (1996) Extraribosomal functions of ribosomal proteins. Trends Biochem. Sci., 21, 164–165. [PubMed] [Google Scholar]
- Xiao L. and Honig, B. (1999) Electrostatic contributions to the stability of hyperthermophilic proteins. J. Mol. Biol., 289, 1435–1444. [DOI] [PubMed] [Google Scholar]
- Yusupov M.M., Garber,M.B., Vasiliev,V.D. and Spirin,A.S. (1991) Thermus thermophilus ribosomes for crystallographic studies. Biochimie, 73, 887–897. [DOI] [PubMed] [Google Scholar]