Abstract
This paper reports the design, fabrication, and characterization of a 1–3 composite annular-array transducer. An interdigital bonded (IB) 1–3 composite was prepared using two IB operations on a fine-grain piezoelectric ceramic. The final composite had 19-μm-wide posts separated by 6-μm-wide polymer kerfs. A novel method to remove metal electrodes from polymer portions of the 1–3 composite was established to eliminate the need for patterning and aligning the electrode on the composite to the electrodes on a flexible circuit. Unloaded epoxy was used for both the matching and backing layers and a flexible circuit was used for interconnect. A prototype array was successfully fabricated and tested. The results were in reasonable agreement with those predicted by a circuit-analogous model. The average center frequency estimated from the measured pulse-echo responses of array elements was 33.5 MHz and the −6-dB fractional bandwidth was 57%. The average insertion loss recorded was 14.3 dB, and the maximum crosstalk between the nearest-neighbor elements was less than −37 dB. Images of a wire phantom and excised porcine eye were obtained to show the capabilities of the array for high-frequency ultrasound imaging.
I. Introduction
The increasing interest in obtaining higher resolution images has heightened the need for developing high-frequency (>20 MHz) ultrasound transducers. High-frequency medical ultrasound imaging is currently used in intravascular studies [1], dermatology [2], [3], ophthalmology [4], and small animal models for disease [2], [5], [6]. Annular arrays have unique capabilities considering tradeoffs among all available transducer designs. They can provide a larger depth of field than single-element transducers because of their dynamic focusing capability, and require fewer elements to form an image than linear-sequenced or linear-phased arrays [7]. Annular arrays, which consist of several concentric and often equal-area elements, produce a symmetrical beam, which is not achievable by linear arrays [8]. However, like single-element transducers, annular arrays unfortunately rely upon mechanical translation or rotation to form an image.
Annular array fabrication is quite challenging because of the dimensional constraints imposed by the need for operation at high frequencies. Active material selection and preparation are important to ensure desired array sensitivity and bandwidth, and inter-element crosstalk should be minimized so as not to limit the ability of the array to dynamically focus. Several researchers have reported the development of high-frequency annular arrays [9]-[13]. In a study conducted by Snook et al. [9], a 6-element, 45-MHz annular array was fabricated using a fine-grained lead titanate (PbTiO3). Individual elements were created by laser dicing and conventional cable soldering used for interconnection. This work illustrated the advantage of using an active material with a low planar coupling coefficient to minimize acoustic crosstalk. Brown et al. [10] fabricated a 50-MHz, 7-element, kerfless annular array by patterning concentric aluminum electrodes on a planar PZT-5H substrate and using a wire-bonding process for interconnection. This work demonstrated that images with excellent lateral resolution, depth of field, and low side lobe level could be produced with a kerfless annular array design. In a more straightforward approach, Ketterling et al. [11], fabricated a geometrically focused kerfless annular array by bonding a polarized piezoelectric-polymer PVDF film, without a patterned signal electrode, directly on a single-sided flexible circuit. Gottlieb [12], and Gottlieb et al. [13], applied a similar technique to fabricate planar arrays with a P(VDF-TrFE) film and a custom double-sided flex circuit. All of the piezoelectric-polymer based arrays demonstrated good imaging performance in spite of high average recorded round-trip insertion losses (33 to 34 dB) [11]-[13]. Gottlieb also fabricated a kerfless 28-MHz composite annular array by bonding a 1–3 composite, without additional patterned signal electrodes, to a two-sided flex circuit [12]. It was postulated that the uncharacteristically high average round-trip insertion loss (32.5 dB) observed for this array was caused by the dominance of the series capacitance generated by the epoxy bond-line on the electrical impedance of the array elements.
This paper describes the design and fabrication of an 8-element kerfless high-frequency annular array using a similar approach as described Gottlieb [12]. The major difference is that a 1–3 composite material with a patterned signal electrode was used in attempt to improve array insertion loss by limiting the influence of the epoxy bond-line on performance. The initial target specifications for this annular array are presented in Table I.
TABLE I.
Specifications for the 35 MHz 1–3 Composite Annular Array
| Center frequency | 35 MHz |
| Number of elements | 8 |
| Aperture size | 3.1 mm |
| Transmit focus | 6.5 mm |
| Bandwidth (−6 dB) | >50% |
| Crosstalk (element-to-element) | <−30 dB |
| Insertion loss | <20 dB |
II. Methods
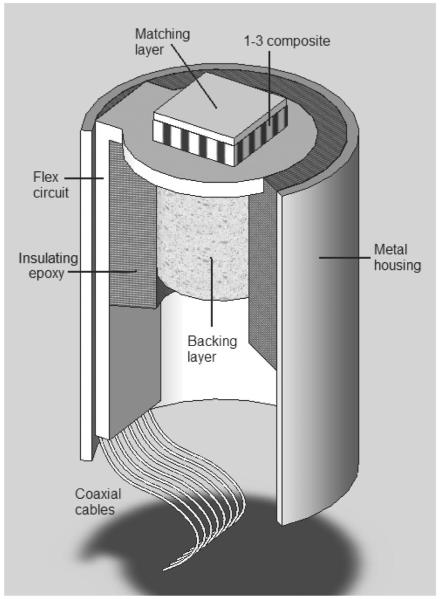
A schematic drawing of the array showing all major design components is displayed in Fig. 1. The piezocomposite was covered by a matching layer and bonded to the flexible circuit. A backing layer was bonded on the other side of the flex circuit. To provide RF shielding, the array was encased in a brass tube closed off with a brass end piece. The gap between the cylindrical brass housing and the transducer assembly was filled by a non-conductive epoxy.
Fig. 1.
A schematic section drawing of the annular array showing all major components (not to scale).
A. 1–3 Composite Design and Fabrication
Numerous researchers have investigated 1–3 composites to enhance the performance of ultrasound transducers [7], [8], [14], [15]. There are at least three advantages of using a piezocomposite in ultrasound transducers. First, because composites have a large percentage of relatively soft polymers, they can be easily conformed to provide a physical focus for the transducer. Second, the acoustic impedance of the composite is lower than that of a bulk piezoceramic, and therefore provides a better match to the load medium. Third, having a low lateral clamping and a small aspect ratio (width/height) can result in producing a higher electromechanical coupling coefficient for 1–3 composites when compared with bulk ceramic operating in thickness mode [15]. Therefore, if designed properly, the piezo-composite will help to reduce the insertion loss of the transducer [16].
There are several techniques available for high frequency 1–3 composite fabrication. The traditional dice-and-fill technique uses a mechanical dicing saw to cut kerfs into a bulk piezoceramic that are subsequently backfilled with epoxy [17]. Although this technique is fairly easy to implement, it is the most limited because of the kerf- and post-width requirements for high-frequency composites. Laser dicing [18] and dry etching [19] are other machining techniques that have been used to fabricate finer-scaled 1–3 composites than mechanical dicing, but the formation of conically shape posts may be difficult to avoid. The shape and aspect ratio of the posts generated by micro-molding and LIGA techniques [20], [21] are very favorable, but so far the material properties of the composites made by these techniques have not yet approached those achievable with bulk machined piezoelectric ceramics and crystals. The interdigital pair and phase bonding techniques were found to be capable of overcoming the limitation of mechanical dicing by producing fine-scale high-volume fraction piezo-composites [22], [23]. In this study we chose the interdigital pair bonding technique with a post positioning method [24], to fabricate a high volume fraction and relatively uniform 1–3 composite for annular arrays.
According to Geng et al. [25], for a 1–3 composite, the first lateral mode corresponds to the half-wavelength resonance frequency along the diagonal direction of the kerf between piezoelectric posts. In general, the coupling between the thickness mode and this first lateral mode can be avoided by using the following formula [26]:
where fc is the desired transducer center frequency and νs is the shear velocity of the kerf filler. With a νs of 1270 m/s for our kerf filler (Epo-Tek 301, Epoxy Technologies, Billerica, MA) and fc of 35 MHz, the kerf widths for our composite should be less than 6.4 μm. Therefore, we chose 6 μm as the kerf width for the composite used in this study. The piezoelectric ceramic used for the composite was a fine-grained PZT-5A (TRS200HD, TRS Technologies, State College, PA). This material was chosen for its reasonably high relative clamped dielectric permittivity (εS33/εo) which makes it ideal for electrically matching the moderately sized annular array elements. The properties of TRS200HD ceramic are listed in Table II.
TABLE II.
Properties of TRS200HD* Ceramic
| CE11 [GPa] | 146 |
| CE12 [GPa] | 97 |
| CE13 [GPa] | 97 |
| CE33 [GPa] | 141 |
| d33[C/N] | 400 × 10−12 |
| d31[C/N] | −190 × 10−12 |
| e33[C/m2] | 19.5 |
| e31[C/m2] | −7.4 |
| εS33/εo | 875 |
| ρ [kg/m3] | 7900 |
TRS Technologies, State College, PA.
Using the properties of TRS200HD and equations in Smith et al. [14], the εS33/εo, density (ρ), electromechanical coupling coefficient (kt), longitudinal velocity (νl), and acoustic impedance (Z) for the 1–3 composite were calculated (Table III). A ceramic volume fraction of 58% was chosen to achieve the maximum kt by setting the desired post width at 19 μm. This also ensured that the aspect ratio of the composite posts would not exceed the undesirable value of 0.5 when used in our 35-MHz array [26].
TABLE III.
Calculated 1–3 Composite Material Properties
| Property | TRS200HD + Epo-Tek 301 |
|---|---|
| Piezoceramic vol. [%] | 58 |
| ρ [kg/m3] | 4998 |
| εS33/εo | 527 |
| k t | 0.6 |
| νl [m/s] | 4223 |
| Z [MRayl] | 21.1 |
The interdigital bonded 1–3 composite material was fabricated using a 31-μm-wide hubbed nickel/diamond blade (Asahi Diamond Industrial Co., Ltd., Tokyo, Japan) and a Tcar 864-1 (Thermocarbon, Inc., Casselberry, FL) programmable dicing saw. Four plates of TRS200HD, measuring 15 × 15 × 0.5 mm, were waxed down to a carrier glass plate using a low-temperature paraffin wax and diced with a 50-μm pitch. The epoxy filler was wicked into the kerfs after deliberately mating the diced portion of the ceramic plates to produce the 6 μm kerf width. The composite assembly was then kept in a dry nitrogen environment for 48 h to fully cure the epoxy before processing further. Excess ceramic and cured epoxy then were ground off to expose the diced 2–2 composite posts on top of the remaining two plates. A second dicing and interdigital bonding step was performed orthogonally to create the 1–3 composite posts. The fabricated 1–3 composite was then lapped to the final thickness of 44 μm and plated with a 1500 Å layer of chrome/gold.
The electrical impedance characteristics of an air-loaded piece of 1–3 composite are shown in Fig. 2. The kt was found to be approximately 0.54 which was slightly less than the simulated value of 0.6. However, the longitudinal velocity was 3700 m/s and εS33/εo was 419, which were approximately 10% and 20% lower than predicted by the model, respectively. We believe that the observed discrepancies between the model and measurement for the composite may be due to frequency-dependent degradation of piezoelectric ceramic properties or damage incurred during mechanical dicing.
Fig. 2.
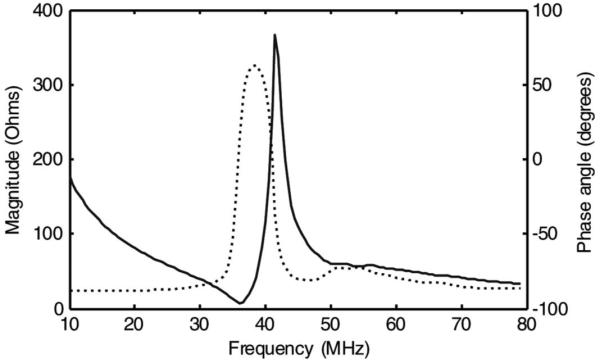
Measured electrical impedance magnitude (solid line) and phase (dotted line) of the air-loaded 1–3 composite.
B. Array Modeling
The 35-MHz annular array was designed to have equal-area elements with a 1-mm-diameter center element. Equal-area elements provide at least two advantages. First, they provide equal electric impedances for all elements and, second, reduced outer element sizes minimize the phase shifts of returned sinusoidal pressure wavelets during the receive mode. This leads to enhanced SNR compared with the non-equal area approach [9]. An 8-element array arrangement was selected in this research as a tradeoff between desired lateral resolution and imaging system complexity.
A circuit-analogous model (PiezoCAD, Sonic Concepts, Woodinville, WA) was used to simulate and optimize the performance of a single array element. The measured composite properties were used here along with the properties of other array design components. The flex circuit was modeled as a 0.45-μm gold (Z = 63.8 MRayl), 0.5-μm chrome (Z = 39.5 MRayl), and 1-μm-thick copper (Z = 41.61 MRayl) electrode layer on top of a 25-μm-thick layer of polyimide (Z = 3.11 MRayl). Backing and matching layers were both Epo-Tek 301 (Z = 3.05 MRayl). As a result of this modeling, the composite and matching layer thicknesses of 44 μm and 16 μm, respectively, and 120-cm, 75-Ω, 40-AWG, coaxial cables (150–0352–9NN, Precision Interconnect, Portland OR) were chosen to achieve the desired pulse echo response (Fig. 3). The modeled pulse echo response displayed a center frequency of 33.7 MHz, −6-dB bandwidth of 59%, and −20-dB pulse length of 90 ns.
Fig. 3.
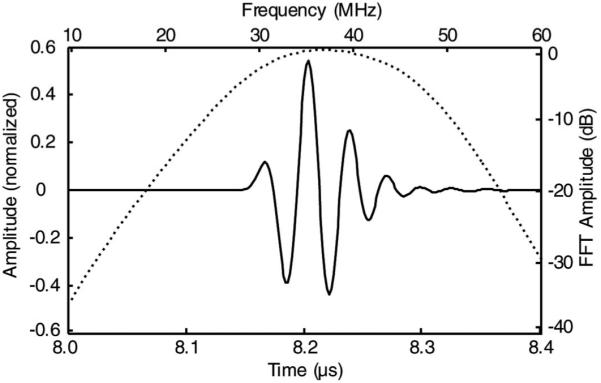
Modeled time domain pulse/echo response (solid line) and frequency spectrum for a single array element (dotted line).
C. Array Fabrication
The success of bonding non-electroplated PVDF and P(VDF-TrFE) to flex circuits to make annular arrays [11]-[13] was due to the fact that the series capacitance created by the thin epoxy bond line between the electrode and piezoelectric-polymers was similar to the capacitance of the piezoelectric-polymer materials. However, because the dielectric permittivity of our composite is nearly two orders of magnitude higher than piezoelectric-polymers, the series capacitance of a thin epoxy bond line would cause a large increase in array insertion loss [12]. Therefore, it was imperative that an electrode was patterned on the surface of the composite to make direct electrical contact between entire ceramic posts and the traces on the flex circuit defining the elements. To simplify the fabrication process, we set out to pattern electrodes only on composite posts so that alignment between the composite and flexible circuit was not crucial. Shorting between adjacent array elements would not occur as long as the diagonal ceramic post-widths were smaller than the separation between flex-circuit traces. We found that the adhesion of the sputtered Cr/Au on top of the epoxy kerfs was not as strong as the adhesion to the ceramic posts if the composite was not cleaned by argon plasma before sputtering. Therefore, the Cr/Au layer on top of the polymer kerfs could be completely removed by rubbing the surface with a cotton swab using isopropyl alcohol. The result of this fabrication step is illustrated in Fig. 4.
Fig. 4.
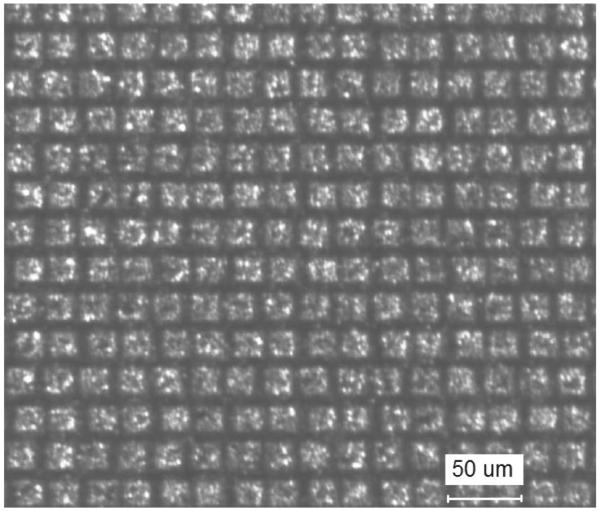
Sputtered 1–3 composite after removing the Cr/Au over the epoxy kerfs.
The double-sided flex circuit used for this project was identical to the one previously used by our group [12], [13]. A prefabricated Epo-Tek 301 backing layer was bonded to the flexible circuit first. Then, 1.2-m long, 75-Ω coaxial cables were soldered to the flexible circuit using a low-temperature, indium-based solder (Indium Corporation of America, Utica, NY). The flexible circuit and backing layer were placed inside a custom-machined brass housing [Fig. 5(a)]. The brass tube was filled with additional Epo-Tek 301 and cured. The 1–3 composite material with electrically separated posts was then bonded to the flexible circuit. A fixture and Teflon-coated rubber pad were used to apply the pressure evenly to the array composite and secure it in place. After curing, an additional 1500-Å Cr/Au electrode was sputtered to connect the ground side of the composite to the flex-circuit. Finally, a prefabricated sheet of matching-layer material was bonded to the composite. The finished array is shown in Fig. 5(b). Epo-Tek 301 was the epoxy used for all bonding steps.
Fig. 5.
(a) Housed annular array flex-circuit before bonding the 1–3 composite and matching layer, (b) fully fabricated 1–3 composite annular array.
III. Results and Discussion
A. Array Characterization
Imaging is the ultimate experiment to determine the effectiveness of array transducers but it is affected not only by the array characteristics but also the imaging system electronics and signal processing procedures used. Several standard non-imaging tests were initially performed on the 35-MHz prototype annular array to allow a more objective comparison to be made with previously developed arrays.
The pulse-echo responses of the array elements were measured first. A Panametrics 5900PR 200-MHz pulser/receiver (Panametrics Inc., Waltham, MA) was used to excite the transducer and receive the reflection from a quartz plate placed in a deionized water bath. The transmit energy and receiver gain for the Panametrics 5900PR were set at 1 μJ and 10 dB, respectively. RF waveforms were recorded on a digital oscilloscope (LC534 LeCroy Corp., Chestnut Ridge, NY) set at 50 Ω coupling. The measured pulse-echo characteristics for all elements are shown in Table IV, and Fig. 6 displays the waveform from the center element. The pulse-echo response measured for this element had a center frequency of 33.5 MHz and a −6-dB bandwidth of 57%, which compared reasonably well to the modeled pulse-echo response (Fig. 3).
TABLE IV.
The Measured Pulse Echo Characteristics for all Annular Array Elements
| Element # |
||||||||
|---|---|---|---|---|---|---|---|---|
| 1 | 2 | 3 | 4 | 5 | 6 | 7 | 8 | |
| Center frequency (MHz) | 33.5 | 34.5 | 32.8 | 34.1 | 34.1 | 33.6 | 34.8 | 33.9 |
| −6-dB bandwidth (%) | 57.0 | 57.8 | 54.1 | 57.4 | 59.0 | 60.6 | 57.8 | 56.5 |
| Vpp (mV) | 1125 | 765 | 681 | 754 | 743 | 735 | 644 | 622 |
| −20-dB pulse length (ns) | 95 | 85 | 92 | 85 | 84 | 82 | 94 | 87 |
| Uncompensated IL at 35 MHz (dB) | 29.7 | 36.6 | 44.2 | 44.2 | 47.9 | 51.0 | 56.3 | 58.4 |
| Compensated IL at 35 MHz (dB) | 12.5 | 13.4 | 15.1 | 13.5 | 14.7 | 14.4 | 15.2 | 15.2 |
Fig. 6.
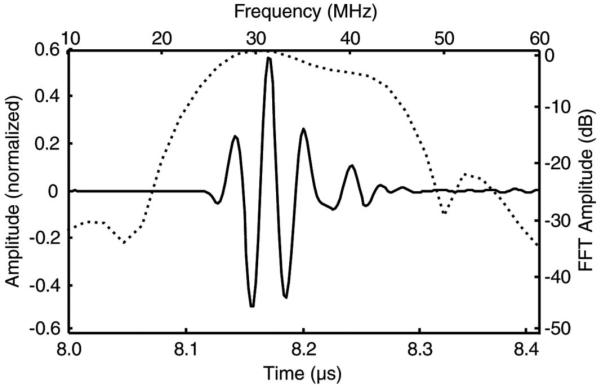
Measured time domain pulse echo response (solid line) and normalized frequency spectrum (dotted line) for element #1. The measured center frequency was 33.5 MHz with a −6-dB bandwidth of 57%. The −20-dB pulse length was 95 ns.
The two-way insertion loss for each element was recorded at 35 MHz. The amplitude of the sinusoidal signal from an arbitrary function generator (AFG 3251, Tektronix Inc., Richardson, TX), set in the burst mode, was measured using 50 Ω coupling on the oscilloscope for various frequencies over the array’s pass-band. Each array element was then connected to the function generator with the oscilloscope set at 1 MΩ coupling. The echo signal peak amplitudes for all eight elements were measured at a distance of 5.91 mm, which was natural focus for the center element. Measured data was compensated for loss caused by attenuation in the water bath (2.2 × 10⁻⁴ dB/mm·MHz2) [27], and transmission coefficient from the quartz target (1.8 dB). The method described by Snook [9], which used the mirror image of the annular array to define the ratio of received power to the total power, was used to compensate the measured insertion loss data for diffractive loss. The modeled angular response from the Field-II software [28], was used in these calculations. The compensated and uncompensated insertion loss values for each element are shown in Table IV. The average compensated insertion loss for the composite array (14.3 dB) was significantly lower than what was reported for the P(VDF-TrFE)-based annular arrays (31 MHz: 38.4 dB, 55 MHz: 33.5 dB) and 1–3 composite-based array (28 MHz: 32.5 dB) fabricated previously by our group using the same flexible circuit design [12], [13].
The combined electrical and acoustical crosstalk was measured between adjacent elements. Identical coaxial cables connected array elements to the electronics to provide equal loading conditions. The annular array was placed in a deionized water bath with no reflector. A function generator (AFG 3251, Tektronix) set in sinusoid burst mode was used with an amplitude of 5 Vpp. An element was excited at discrete frequencies through the passband (20 to 55 MHz), and the peak applied voltage was recorded as a reference using an oscilloscope set at 1 MΩ coupling. The voltages on nearest-neighbor elements were also measured with the oscilloscope set at 1 MΩ coupling and compared with the reference voltage to determine the level of crosstalk [26]. The results of this test are shown in Fig. 7. The maximum crosstalk between adjacent elements was less than −37 dB over the passband. We attribute the low crosstalk observed mainly to a good electrical impedance match between the array elements and the system electronics [29].
Fig. 7.
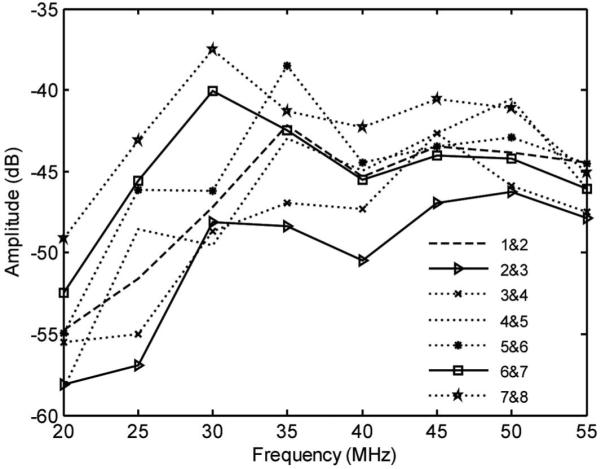
Crosstalk measured between adjacent elements.
B. Imaging
The performance of the annular array transducer was validated by imaging a wire phantom as well as an excised porcine eye using a prototype linear ultrasonic bio-microscope (UBM) scanner as a single channel imaging system. Therefore eight sets of scan lines were acquired for multi-channel imaging these targets by repeatedly translating the annular array transducer horizontally at a speed of 10 cm/s.
The phantom was composed of four diagonally aligned, linearly spaced 20-μm-diameter tungsten wires (California Fine Wire Co., Grover Beach, CA) with 1.5 mm vertical and 0.65 mm lateral spacing; it was imaged first to assess array lateral resolution. A fresh porcine eye was also scanned to assess the ability of the array to image soft tissue. Both targets were prepared in a small plastic cup filled with de-gassed water. For these imaging tests, a single transmit focal point analog beamformer was fabricated using specific length delay line coaxial cables (RG/58 C5779.18.10 General Cable, Highland Heights, KY). This coaxial cable was fully characterized [26] at 35 MHz to calculate the electromagnetic propagation velocity to determine the precise lengths needed for the delay lines (Table V). Table VI shows the calculated time delays, as well as required coaxial cable lengths for each array element based upon the desired transmit focus of 7 mm. One end of each coaxial delay line was soldered to the array cables and the other end was connected to a power splitter (ZCSC-8–1, MiniCircuits, Brooklyn, NY).
TABLE V.
Properties of the 50-Ω Coaxial Cable* Characterized at 35 MHz
| Property | G.C.RG/58 C5779.18.10 |
|---|---|
| Characteristic impedance (Z0) | 53.4926 − 0.3626i Ω |
| Propagation constant (γ) | 0.0133 + 1.0237i |
| Propagation velocity (VP) | 2.148 × 10⁸ m/s |
| Resistance/unit length (r) | 1.08 Ω/m |
| Capacitance/unit length (c) | 87.03 pF/m |
| Inductance/unit length (l) | 0.249 μH/m |
| Conductance/unit length (g) | 118 μS/m |
| Attenuation/unit length | 0.22 dB/m |
RG/58 C5779.18.10, General Cable, Highland Heights, KY; this cable was used in the fxed-focus transmit beamformer.
TABLE VI.
Calculated Time Delays and Corresponding Cable Lengths for a 7- mm Transmit Focus
| Element # | Delays (ns) | Cable length (m) |
|---|---|---|
| 1 | 97.90 | 21.03 |
| 2 | 90.09 | 19.35 |
| 3 | 75.74 | 16.27 |
| 4 | 61.18 | 13.14 |
| 5 | 46.51 | 9.99 |
| 6 | 31.27 | 6.72 |
| 7 | 15.61 | 3.35 |
| 8 | 0 | 0 |
Transmit waveforms were created by a function generator (AFG3251, Tektronix). The output of the function generator was amplified to excite the array elements via a power amplifier (75A250A, Amplifier Research Corp., Souderton, PA), and fed into the input of the power splitter to provide eight equal-amplitude waveforms to the delay lines.
Eight scans were recorded to form one annular array image. For every scan, a T-Type BNC connector was linked between a delay line and a single array cable to intercept one of eight RF signals. The received RF signals were preamplified by 26 dB using the receiver on the Panametrics 5900PR, digitized using an A/D card (CS12400, GaGe Applied Technologies Inc., Lockport, IL) with a 400 MHz sampling rate, and saved using a computer with customized Labview imaging software (national Instruments, Austin, TX). The acquired RF data sets were post-processed using Matlab (The MathWorks Inc., Natick, MA).
The interval between the scan-lines was reduced by increasing PRF to limit the possible scan-line-location error caused by the eight independent measurements. Wire phantom imaging used 3 KHz PRF and porcine eye imaging used 2 KHz PRF resulting in 3.3 μm and 6.6 μm step sizes between RF lines, respectively. The eight image frames were summed to form a single frame applying dynamic receive beam forming. Fig. 8 shows the measured and simulated (Field II) wire phantom images with 48 dB dynamic range. The −6-dB lateral resolutions measured at depths of 5, 6.5, 8, and 9.5 mm were 125, 110, 200, and 310 μm, respectively. These measured values compared reasonably well to the Field II simulated lateral resolutions of 119, 108, 194, and 302 μm, respectively.
Fig. 8.
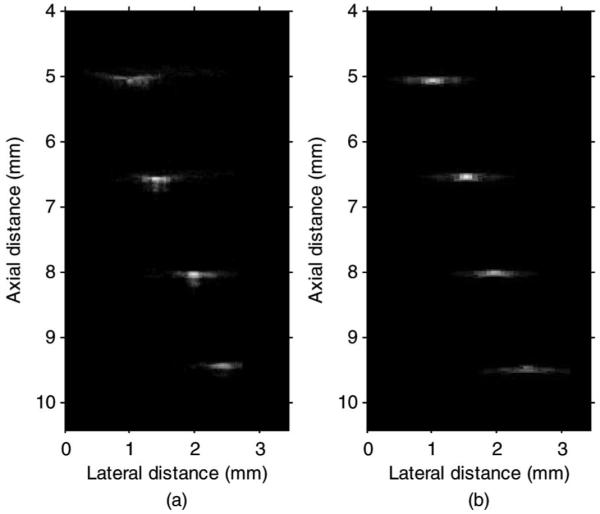
Measured (a) and Field II simulated (b) wire phantom images with a 48-dB dynamic range.
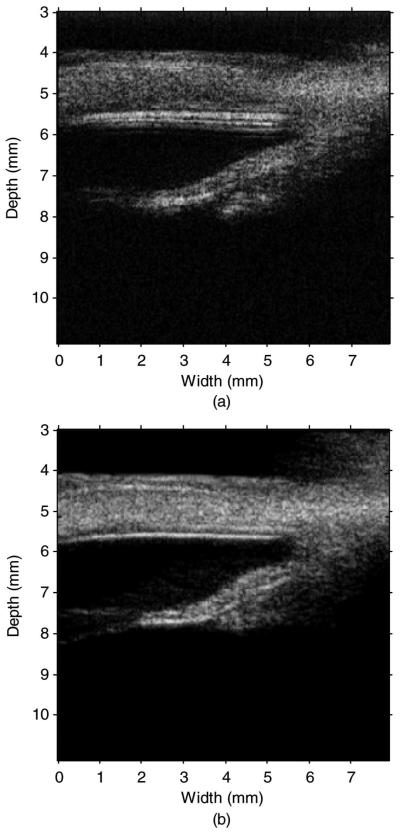
Images of the ex vivo porcine eyes were acquired and are shown in Fig. 9 using a 30-MHz single-cycle sine pulse [Fig. 9(a)], and a chirp pulse [Fig. 9(b)] for excitation. The images clearly show the anatomy of anterior segment of the porcine eye. The output voltage from each channel of the power splitter was reasonable (42 Vpp) using the maximum gain setting on the amplifier. Unfortunately the output noise from the amplifier was high (noise figure is 16 dB), limiting the SNR of the system. Therefore a chirp pulse was used to generate an image of the porcine eye to combat the low SNR while maintaining reasonably good spatial resolution [30]. A 1-μs-long chirp pulse was Hanning-windowed linearly with increasing frequency in the range of 20 to 60 MHz. Chirp imaging was implemented in an arrangement similar to the single sine pulse imaging, except for the application of signal compression using a matched filter right after the echo was digitized [31].
Fig. 9.
Ultrasonic bio-microscope image of the anterior portion of a pig eye with 40-dB dynamic range. A single-cycle 29.5-MHz sine pulse (a) and a 20 to 60 MHz windowed chirp pulse (b) was used for transmit. The cornea and iris can be clearly seen in both images.
IV. Conclusion
Single-element ultrasound transducers have been widely used in high-frequency ultrasound imaging because of their cost-effectiveness and ease of fabrication. However, single-element transducers must be mechanically translated to form an image, and have a fixed focal depth resulting in a limited depth of field. The latter problem may be solved by adopting annular arrays, which are capable of providing an intermediate option between single-element and linear-array ultrasound transducers, offering a 2-D symmetric beam profile and dynamic focusing while requiring fewer array elements to form an image.
In this study, we reported the development of a high-frequency 1–3 composite annular array transducer which has the advantage of lower insertion loss over previously reported kerfless annular arrays designs. We used interdigital bonding and post-positioning techniques on a fine-grain piezoelectric ceramic to create the 19-μm-wide posts and 6-μm-wide kerfs required for our 35-MHz array. During the process of developing an array fabrication procedure, we established a novel method to remove metal electrodes from the polymer surface of the 1–3 composite to eliminate the need for patterning and aligning the electrode on the composite to the electrodes on a flexible circuit.
The performance of the array agreed reasonably well with the modeled performance. The composite array also outperformed high-frequency annular arrays fabricated previously by our group using piezopolymer films and 1–3 composites without patterned signal electrodes. In the future, we plan to develop a dedicated annular array transmit beamformer to improve image SNR and a miniature lightweight version of the array to be implemented in a high-frame-rate mechanical sector imaging system.
Acknowledgments
The authors thank Dr. C.-H. Hu and Dr. J. H. Chang for their aid with the imaging portion of this work.
The support of NIH grants #R01-HL0079976 and P41-EB002182 is gratefully acknowledged.
Biography
Hamid Reza Chabok (S’10) received his B.S. degree from Amirkabir University of Technology (Tehran Polytechnic), and his M.S. degree from Sharif University of Technology, Tehran, Iran, in 2000 and 2003, respectively, both in mechanical engineering. He is currently working toward his Ph.D. degree at the NIH Resource Center for Medical Ultrasonic Transducer Technology, Department of Biomedical Engineering, University of Southern California (USC).
His research interests include the design, modeling, and fabrication of high-frequency ultrasonic transducers and arrays for medical imaging applications, piezoelectric material characterization, and new digital method for fabrication of piezoelectric materials and composites.

Jonathan M. Cannata (S’01–M’04) received his B.S. degree in bioengineering from the University of California at San Diego in 1998, and his M.S. and Ph.D. degrees in bioengineering from The Pennsylvania State University, University Park, PA, in 2000 and 2004, respectively.
Since 2001, he has served as the manager for the NIH Resource on Medical Ultrasonic Transducer Technology, which is currently located at the University of Southern California (USC). In 2005, he was awarded the title of Research Assistant Professor of Biomedical Engineering at USC. His current interests include the design, modeling, and fabrication of ultrasonic transducers and transducer arrays for medical applications.

Hyung Ham Kim (S’93–M’95–S’04–M’10) received his B.S. degree in electrical engineering from the Korea Advanced Institute of Science and Technology, Daejeon, Korea, in 1993; his M.S. degree in electronics engineering from Seoul National University, Seoul, Korea, in 1995; and his M.S and Ph.D. degrees in biomedical engineering from University of Southern California, Los Angeles, CA in 2006 and 2010, respectively.
He served as the manager and principal engineer of Probe Department at Medison, Co., Ltd. In Seoul, Korea, from 1994 to 2004, where he managed research and development projects of medical ultrasound array transducers, OEM partnership with transducer manufacturers, purchasing, procurement, and quality control. He is currently a Postdoctoral Research Associate at the NIH Resource Center for Medical Ultrasonic Transducer Technology, Department of Biomedical Engineering, University of Southern California. His current research is focused on the design and fabrication of high-frequency array transducers for high-resolution small parts imaging.

Jay A. Williams serves as a Transducer Engineer at the NIH Resource Center for Medical Ultrasonic Transducer Technology. Mr. Williams joined the group in March 2002, prior to their move to the University of Southern California in August of that year. He has also been the web-master for the Resource Center website (http://bme.usc.edu/UTRC) since the move to Los Angeles, CA. He has now worked in the ultrasound field for nearly twenty years. Some of his accomplishments at the Resource Center include: 64-element 30-MHz piezo-composite linear arrays with 100 μm pitch; 256-element 30-MHz piezo-composite linear arrays with 50 μm pitch; 64-element 35-MHz piezo-composite linear arrays with 50 μm pitch; 8-element 40 to 50-MHz copolymer annular arrays; very light-weight (<0.3 g 40 to 60-MHz, <0.2 g 80 to 100-MHz) high-frame-rate b-scan transducers; 10-MHz composite HIFU catheter transducers; and high-frequency (>25 MHz) fine-scale piezo-composites. He currently has a patent, no. 7 695 784, covering post positioning for interdigital bonded composites.
Mr. Williams has audited courses in business management, computer science, mechanical engineering, architecture, and physics at The Pennsylvania State University from 1975 to 1977. He also achieved honors in both analog electronics at Radio Semiconductor in 1984, and digital electronics at the Control Data Institute Multi-skills Center in 1987. He had worked in industry for 25 years in a variety of technical fields such as mass spectrometry, microwave telecommunication, liquid chromatography, digital electronics, ultrasound, and information technology. From 1990 through 2001, he worked in ultrasound at Blatek, Inc., State College, PA, serving 8 and a half years in engineering and 2and a half years in management, including 5 years as the IS/IT Manager–Network Admin., and 2 years as the Quality System Manager in charge of establishing their first ISO 9001:1994 / FDA CGMP:1999 (21CFR820) quality system, similar to ISO 13485:1996.
His research interests are in novel techniques and tools for the design and fabrication of high-frequency transducers and arrays, development and fabrication of high-performance fine-scale piezo-composites, and innovative methods for utilizing information technology and systems to enhance the capabilities and accessibility of various technologies.

Jinhyoung Park was born in Pusan, Korea, on Oct 6, 1975. He received a B.Sc. degree in astronomy and an M.S. degree in biomedical engineering from Seoul National University, Seoul, Korea, in 2002 and 2004, respectively. From 2004 through 2008, he worked at Siemens Ultrasound Group, Korea, as a principal engineer. He is currently a Ph.D. candidate in the Department of Biomedical Engineering, University of Southern California, Los Angeles, CA.
His research interests include high-frequency coded excitation imaging system and new algorithm development.

K. Kirk Shung (S’73–M’75–SM’89–F’93) obtained a B.S. degree in electrical engineering from Cheng-Kung University in Taiwan in 1968; an M.S. degree in electrical engineering from University of Missouri, Columbia, MO, in 1970; and a Ph.D. degree in electrical engineering from University of Washington, Seattle, WA, in 1975. He did postdoctoral research at Providence Medical Center in Seattle, WA, for one year before being appointed a research bioengineer holding a joint appointment at the Institute of Applied Physiology and medicine. He became an assistant professor at the Bioengineering Program, The Pennsylvania State University, University Park, PA, in 1979 was promoted to professor in 1989. He was a Distinguished Professor of Bioengineering at Penn State until 2002, when he joined the Department of Biomedical Engineering, University of Southern California, Los Angeles, CA, as a professor. He has been the director of NIH Resource on Medical Ultrasonic Transducer Technology since 1997.
Dr. Shung is a fellow of IEEE, the Acoustical Society of America, and the American Institute of Ultrasound in Medicine. He is a founding fellow of the American Institute of Medical and Biological Engineering. He has served for two terms as a member of the NIH Diagnostic Radiology Study Section. He received the IEEE Engineering in Medicine and Biology Society Early Career Award in 1985 and was the coauthor of a paper that received the best paper award for the IEEE Transactions on Ultrasonics, Ferroelectrics, and Frequency Control (UFFC) in 2000. He was selected as the distinguished lecturer for the IEEE UFFC society from 2002 to 2003. He was elected an outstanding alumnus of Cheng-Kung University in Taiwan in 2001. In 2010, he received the Holmes Pioneer Award in Basic Science from American Institute of Ultrasound in Medicine.
Dr. Shung has published more than 300 papers and book chapters. He is the author of the textbook Principles of Medical Imaging published by Academic Press in 1992 and the textbook Diagnostic Ultrasound: Imaging and Blood Flow Measurements published by CRC Press in 2005. He co-edited the book Ultrasonic Scattering by Biological Tissues published by CRC Press in 1993. Dr. Shung’s research interest is in ultrasonic transducers, high-frequency ultrasonic imaging, ultrasound microbeam, and ultrasonic scattering in tissues.

References
- [1].Foster FS, Pavlin CJ, Harasiewicz KA, Christopher DA, Turnbull DH. Advances in ultrasound biomicroscopy. Ultrasound Med. Biol. 2000;26(1):1–27. doi: 10.1016/s0301-5629(99)00096-4. [DOI] [PubMed] [Google Scholar]
- [2].Turnbull DH, Bloomfield TS, Foster FS, Joyner AL. Ultrasound backscatter microscope analysis of early mouse embryonic brain development. Proc. Natl. Acad. Sci. USA. 1995;92(6):2239–2243. doi: 10.1073/pnas.92.6.2239. [DOI] [PMC free article] [PubMed] [Google Scholar]
- [3].Passman C, Ermert H. A 100-MHz ultrasound imaging system for dermatologic and ophthalmologic diagnostic. IEEE Trans. Ultrason. Ferroelectr. Freq. Control. 1996;43(4):545–552. [Google Scholar]
- [4].Lizzi FL, Coleman DJ. History of ophthalmic ultrasound. J. Ultrasound Med. 2004;23(10):1255–1266. doi: 10.7863/jum.2004.23.10.1255. [DOI] [PubMed] [Google Scholar]
- [5].Zhou Y, Foster FS, Nieman BJ, Davidson L, Chen X, Henkelman RM. Comprehensive transthoracic cardiac imaging in mice using ultrasound biomicroscopy with anatomical confirmation by magnetic resonance imaging. Physiol. Genomics. 2004;18(2):232–244. doi: 10.1152/physiolgenomics.00026.2004. [DOI] [PubMed] [Google Scholar]
- [6].Turnbull DH. In utero ultrasound backscatter microscopy of early stage mouse embryos. Comput. Med. Imaging Graph. 1999;23(1):25–31. doi: 10.1016/s0895-6111(98)00060-3. [DOI] [PubMed] [Google Scholar]
- [7].Hunt JW, Arditi M, Foster S. Ultrasound transducers for pulse-echo medical imaging. IEEE Trans. Biomed. Eng. 1983;BME-30(8):453–481. doi: 10.1109/tbme.1983.325150. [DOI] [PubMed] [Google Scholar]
- [8].Arditi M, Foster FS, Hunt JW. Transient fields of concave annular arrays. Ultrason. Imaging. 1981;3(1):37–61. doi: 10.1177/016173468100300102. [DOI] [PubMed] [Google Scholar]
- [9].Snook KA. Ph.D. thesis. Bioengineering, The Pennsylvania State University; University Park, PA: 2004. Design of a high frequency annular array for medical imaging. [Google Scholar]
- [10].Brown JA, Démoré CEM, Lockwood GR. Design and fabrication of annular arrays for high-frequency ultrasound. IEEE Trans. Ultrason. Ferroelectr. Freq. Control. 2004;51(8):1010–1017. doi: 10.1109/tuffc.2004.1324405. [DOI] [PubMed] [Google Scholar]
- [11].Ketterling JA, Aristizábal O, Turnbull DH, Lizzi FL. Design and fabrication of a 40 MHz annular array transducer. IEEE Trans. Ultrason. Ferroelectr. Freq. Control. 2005;52(4):672–681. doi: 10.1109/tuffc.2005.1428050. [DOI] [PMC free article] [PubMed] [Google Scholar]
- [12].Gottlieb EJ. Ph.D. thesis. Biomedical Engineering, The University of Southern California; Los Angeles, CA: 2005. Development of high frequency annular array ultrasound transducers. [Google Scholar]
- [13].Gottlieb EJ, Cannata JM, Hu CH, Shung KK. Development of a high-frequency (> 50 MHz) copolymer annular-array, ultrasound transducer. IEEE Trans. Ultrason. Ferroelectr. Freq. Control. 2006;53(5):1037–1045. doi: 10.1109/tuffc.2006.1632693. [DOI] [PubMed] [Google Scholar]
- [14].Smith W. Composite piezoelectric materials for medical ultrasonic imaging transducers—A review; Sixth IEEE Int. Symp. Applications of Ferroelectrics; 1986.pp. 249–256. [Google Scholar]
- [15].Smith WA, Auld B. Modeling 1-3 composite piezoelectrics: Thickness-mode oscillations. IEEE Trans. Ultrason. Ferroelectr. Freq. Control. 1991;38:40–47. doi: 10.1109/58.67833. [DOI] [PubMed] [Google Scholar]
- [16].Reynolds P, Hyslop J, Hayward G. Analysis of spurious resonances in single and multi-element piezocomposite ultrasounic transducers; Proc. IEEE Ultrasonics Symp.; 2003.pp. 1650–1653. [Google Scholar]
- [17].Savakas HP, Klicker KA, Newnham RE. PZT-epoxy piezoelectric transducers: A simplified fabrication procedure. Mater. Res. Bull. 1981;16(6):677–680. [Google Scholar]
- [18].Lukacs M, Sayer M, Lockwood G, Foster S. Laser micromachined high frequency ultrasonic arrays; Proc. IEEE Ultrasonics Symp.; 1999.pp. 1209–1212. [Google Scholar]
- [19].Jiang X, Yuan JR, Cheng A, Snook K, Cao PJ, Rehrig PW, Hackenberger WS, Lavalelle G, Geng X, Shrout TR. Microfabrication of piezoelectric composite ultrasound transducers (PC-MUT); Proc. IEEE Ultrasonics Symp.; 2006.pp. 918–921. [Google Scholar]
- [20].Cochran S, Abrar A, Kirk K, Zhang D, Button T, Su B, Meggs C. Net-shape ceramic processing as a route to ultrafine scale 1-3 connectivity piezoelectric ceramic-polymer composite transducers; Proc. IEEE Ultrasonics Symp.; 2004; pp. 1682–1685. [DOI] [PubMed] [Google Scholar]
- [21].Hirata Y, Nakaishi H, Numazawa T, Takada H. Piezocomposite of fine PZT rods realized with synchrotron radiation lithography; Proc. IEEE Ultrasonics Symp.; 1997.pp. 887–881. [Google Scholar]
- [22].Liu R, Harasiewicz KA, Foster FS. Interdigital pair bonding for high frequency (20–50 MHz) ultrasonic composite transducers. IEEE Trans. Ultrason. Ferroelectr. Freq. Control. 2001;48(1):299–306. doi: 10.1109/58.896143. [DOI] [PubMed] [Google Scholar]
- [23].Yin J, Lukacs M, Harasiewicz K, Foster S. Ultra-fine piezoelectric composites for high frequency ultrasonic transducers; Proc. IEEE Ultrasonics Symp.; 2004.pp. 1962–1965. [Google Scholar]
- [24].Williams JA, Cannata JM, Liu R, Shung KK. Post positioning for Interdigital bonded composite. U.S. Pat. 7 695 784. 2010 Apr. 13
- [25].Geng X, Zhang QM. Resonance modes and losses in 1-3 piezocomposites for ultrasonic transducer applications. J. Appl. Phys. 1999;85(3):1–9. [Google Scholar]
- [26].Ritter T. Ph.D. thesis. Bioengineering, The Pennsylvania State University; University Park, PA: 2000. Design, fabrication, and testing of high frequency (>20 MHz) composite ultrasound imaging arrays. [Google Scholar]
- [27].Lockwood GR, Turnbull DH, Foster FS. Fabrication of high frequency spherically shaped ceramic transducers. IEEE Trans. Ultrason. Ferroelectr. Freq. Control. 1994;41(2):231–235. [Google Scholar]
- [28].Jensen J. Field: A program for simulating ultrasound systems. Med. Biol. Eng. Comput. 1996;34(1):351–353. [Google Scholar]
- [29].Guess JF, Oakley CG, Douglas SJ, Morgan RD. Crosstalk paths in array transducers; Proc. IEEE Ultrasonics Symp.; 1995.pp. 1279–1282. [Google Scholar]
- [30].Hu CH, Liu R, Zhou Q, Yen J, Kirk Shung K. Coded excitation using biphase-coded pulse with mismatched filters for high-frequency ultrasound imaging. Ultrasonics. 2006;44(3):330–336. doi: 10.1016/j.ultras.2006.04.002. [DOI] [PubMed] [Google Scholar]
- [31].Mamou J, Ketterling JA, Silverman RH. Chirp coded excitation imaging with a high-frequency ultrasound annular array. IEEE Trans. Ultrason. Ferroelectr. Freq. Control. 2008;55(2):508–513. doi: 10.1109/TUFFC.2008.670. [DOI] [PMC free article] [PubMed] [Google Scholar]


