Abstract
How tau mutations lead to neurodegeneration is unknown but may be related to altered microtubule binding properties of mutant tau protein. The tendency for the mutations to cluster around the microtubule-binding domain of tau or to alter the ratios of those splice isoforms that affect binding supports the view that the tau/microtubule interaction is critical and finely regulated. In cells transfected with both mutant and wild-type tau isoforms fused to either yellow fluorescent protein or cyan fluorescent protein we can observe tau fusion proteins that differ by a single amino acid or by the inclusion or exclusion of exon 10. With coexpression of mutant and wild-type tau, the mutant isoform appears diffuse throughout the cytoplasm; however, when mutant tau is expressed alone, it appears mostly bound to the microtubules. Dual imaging of the three- and four-repeat tau isoforms indicated that the expression of four-repeat tau displaced three-repeat tau from the microtubules. These results suggest that altered kinetic competition among the isoforms for microtubule binding could be a disease precipitant.
INTRODUCTION
Mutations in the tau gene are responsible for a phenotypically diverse group of hereditary neurodegenerative diseases, called frontotemporal dementia and Parkinsonism linked to chromosome 17 (FTDP-17). Although the wide range of clinical and pathological phenotypes (http://www.alzforum.org/members/research/tau/tau_references.html) associated with tau mutations limits the utility of any descriptive term to encompass the entire syndrome, a consensus conference adopted the term FTDP-17 (Foster et al., 1997). In addition to frontotemporal dementia, tau mutations can cause disease entities as diverse as subcortical gliosis (Goedert et al., 1999), cortico-basal degeneration (Bugiani et al., 1999), and pallido-nigro-luysian degeneration (Yasuda et al., 1999). Notably, tau mutations do not appear to cause Alzheimer's disease, although the presence of abnormal tau immunoreactivity in both diseases with tau mutations and in Alzheimer's disease suggests that diverse precipitants might converge on a common pathway leading to pathological alterations in tau. Common to all of the diseases associated with tau mutations is aberrant tau immunoreactivity in neurons and/or glial cells, and in some cases the aberrant tau immunoreactivity contains tau aggregates that are indistinguishable from Alzheimer neurofibrillary tangles.
Under normal conditions, tau is a microtubule-associated protein that is highly enriched in the axonal segment of neurons (reviewed in Kosik [1997]). The structure of the tau protein consists of a series of imperfectly repeated 31 or 32 amino acid motifs that bind to microtubules, the flanking domains of these repeats, which undergo multiple phosphorylation events to regulate microtubule binding, and the projection domain of as yet (D'Souza et al., 1999) unknown function. The tau gene undergoes complex developmentally regulated alternative splicing. Among the alternatively spliced exons is the exon 10 cassette, which corresponds to one complete microtubule-binding repeat; the remaining three microtubule-binding repeats are constitively expressed and their boundaries do not correspond to exon boundaries. The inclusion of this 93 nucleotide cassette exon, as well as the other two alternatively spliced exons (exons 2 and 3) expressed in the CNS, occurs relatively late in the course of brain development at about postnatal day 7 in the rat (Kosik et al., 1989). Once tau undergoes alternative splicing, isoforms of tau that include and exclude exon 10 are expressed in the human (Goedert et al., 1989), and the presence of exon 10 increases the affinity of tau for the microtubule.
The reported tau mutations fall into three categories: missense mutations either within or flanking the microtubule-binding domain that directly affect the microtubule-binding function of tau (reviewed in Spillantini and Goedert [1998]), missense or silent mutations within or in proximity to exon 10 that affect the splicing of this exon (Hasegawa et al., 1999), and intronic mutations that also affect exon 10 splicing via the 5′ splice site between exons 9 and 10 (D'Souza et al., 1999; Hutton et al., 1998). Those mutations that affect tau splicing generally decrease the efficiency of the splicing reactions around exon 10, resulting in increased retention of exon 10. A single mutation might occupy a fourth category: the coding mutation, Δ280K, causes both the exclusion of exon 10 and reduces tau binding to microtubules (Rizzu et al., 1999).
In vitro functional experiments suggested that some of the mutations reduced the ability of tau to bind to microtubules and to promote polymerization (Hong et al., 1998). However, impaired microtubule binding of single tau isoforms due to amino acid substitutions cannot account for the tau aggregates in all cases of FTDP-17 because the intronic mutations continue to express normal tau isoforms. Indeed, the Alzheimer neurofibrillary tangles also arise in the presence of a normal primary tau sequence. A more comprehensive hypothesis for the effects of all of the tau mutations is their tendency to alter the ratio of microtubule-bound and free forms of tau. Using tau fusions with mutant green fluorescent proteins (GFPs), we imaged wild-type and mutant tau, or three- (3R) and four (4R)-repeat tau individually in the same living cell. Dual transfections consistently indicated that in the presence of both wild-type and mutant tau, the pool of microtubule-dissociated tau was larger for the mutant isoform. In the presence of both the 3R and 4R isoforms, the pool of microtubule-dissociated tau was larger for the 3R isoform. In contrast, when mutant or wild-type tau and 3R or 4R tau were individually transfected, nearly all of the tau protein associated with microtubules. Thus the size of microtubule free and bound pools depend on kinetic competition among the isoforms. That the 4R isoform can displace the 3R isoform, together with previous findings that inclusions reported in patients with splice site mutations contain 4R tau, necessitate a reconsideration of the prevalent idea that tau inclusions are seeded from the microtubule-free pool of tau.
MATERIALS AND METHODS
Construction of GFP–tau Fusion Constructs
Human tau constructs that lacked exons 2 and 3 were kindly provided by Dr. Michael Hutton. The constructs 3R (exon 10−), 4R (exon 10+), 4R P301L, 4R V337 M, and 4R R406W were cloned in pBluescript KS− vector (Strategene, La Jolla, CA). To make GFP–tau fusion constructs, wild-type tau-4R was amplified from the 5′-end methionine (BglII site) to the 3′-end stop codon (EcoRI site) out of the pBluescript KS− vector. The PCR fragment was ligated into PCR-Blunt vector (Invitrogen, Carlsbad, CA). PCR Blunt vector with tau-4R was digested with BglII and EcoRI and ligated into the BglII/EcoRI sites of pEGFP-C1 vector (Clontech, Palo Alto, CA). This construct encoded an EGFP fused at its carboxy terminus to the amino terminus of tau. pEGFPC1–4Rtau were cut with SacII and SmaI. Tau isoform 3R and the mutants 4R P301L, 4R V337 M, and 4R R406W in pBluescript KS− vector were digested with SacII and SspI and ligated into the SacII and Sma sites from pEGFPC1–4R. To transfer tau isoforms and mutants into either ECFP (enhanced cyan fluorescent protein) or EYFP (enhanced yellow fluorescent protein; Clontech), the pEGFP–tau constructs digested with BamHI and BglII were ligated into either BamHI and/or BglII sites of ECFP and EYFP. All the constructs were sequenced. The pCMV-p25, pCMV-CDK5, and pCMV-DNCDK5 (DN is the dominant negative) constructs were kindly provided by Dr. L. Tsai. The EGFP–tubulin construct was from Clontech.
Cell Cultures and Transfection
NIH 3T3 cells were cultured in DMEM medium supplemented with 10% fetal bovine serum on 25-mm coverslips placed in 6-well plates. One day after plating, cells were transfected with various DNA constructs using Superfect transfection kits (Qiagen, Chatsworth, CA) according to the manufacturer's protocol. More specifically, for each coverslip, 1–4 μg of DNA (2 μg for single transfection and 2–4 μg for double transfection) was mixed with 100 μl of medium, and then 10 μl of Superfect was added to the solution. After 10-min precipitation, the mix was added onto the cells, which were incubated at 37°C for 2 h, then washed with PBS and normal medium, and returned to the incubator. Transfections with one of the EGFP–tau isoforms, pCMV-P25 and PCMV-CDK5 or pCMV-DNCDK5, were performed by mixing 1 μg of DNA from each construct for each coverslip and analyzed 2 days after transfection.
Immunocytochemistry and Immunoblotting
Two days after transfection, cells were fixed using a combined fixation and extraction protocol (Lee, 1997) (0.3% glutaraldehyde, 0.5% NP40, 80 mM PIPES/KOH, pH 6.8, 5 mM EGTA, and 1 mM MgCl2) at 37°C for 10 min. After treatment with NaBH4 and glycine and blocking with 5% goat serum, the cells were incubated in mouse anti–α-tubulin (1:2000, Sigma, St. Louis, MO) at 4°C overnight. Cells were then washed and incubated with Texas Red–conjugated secondary antibodies goat anti-mouse (1:100; Jackson ImmunoResearch Laboratory, West Grove, PA) at room temperature for 1 h. Coverslips were mounted for fluorescence microscopy.
For extraction of noncytoskeletal associated tau, the coverslips were first rinsed with PBS and then rinsed with extraction buffer (80 mM PIPES/KOH, pH 6.8, 1 mM MgCl2, 1 mM EGTA, 30% glycerol, 1 mM GTP). Cells were then extracted with 0.1% Triton X-100 in the extraction buffer for 30 s. Cells were fixed with gluteraldehyde as above, but without 0.5% NP40, after being rinsed with extraction buffer and PBS. All treatments were performed at 37°C. Coverslips were then mounted, and fluorescence microscopy was performed. To increase the pool of noncytoskeletal associated tau, cells were perfused on the stage with nocadozole (165 μM) for various lengths of time.
For immunoblotting, transfected cells were scraped into 1% NP40/1%Triton plus the protease inhibitor cocktail, Complete (Boehringer Mannheim, Indianapolis, IN) in PEM (80 mM PIPES, 5 mM EGTA, 1 mM MgCl2, pH 6.8) and incubated for 20 min at 4°C. The extracts were centrifuged at low speed (13,000 × g) for 5 min at 4°C. To distinguish tau isoforms by immunoblot, the samples were dephosphorylated with calf intestinal phosphatase (CIP). Lysate (13.5 μl) was incubated with CIP at 275 U/ml final concentration at 37°C overnight. The samples were run in 8% Tris-glycine gels and transferred to nitrocellulose. The membranes were first blocked with 5% milk in TBS/0.1% Tween-20, incubated with primary antibody 5E2 (1:500) for 1 h at room temperature, and then incubated with secondary HRP-conjugated goat anti-mouse antibodies (1:10,000) for 1 h at room temperature. The signals were detected using Supersignal West Pico Chemiluminescent (Pierce, Rockford, IL). The exposed films (Eastman Kodak, Rochester, NY) were scanned into Adobe PhotoShop (San Jose, CA). Images were processed and printed out directly on a Kodak color printer (Model 8650 PS; Kodak Digital Science).
Fluorescence Video Microscopy
High-resolution fluorescence video microscopy for cells transfected with GFP–tau fusion constructs were carried out on a Nikon Microscope (Diaphot 300; Garden City, NY) equipped with both 40× oil immersion (1.0 N.A.) and 100× oil immersion lens (1.4 N.A.). The specific GFP filter set (Chroma Tech, Brattleboro, VT) was used for detecting the fluorescence from the EGFP–tau fusion protein. To visualize cells double-labeled with ECFP (Ex: 433 nm, Em: 475 nm) and EYFP (Ex: 513 nm, Em: 527 nm) fusion proteins, specific filters were placed in the corresponding computer-controlled excitation (ECFP: 436DF10, EYFP: 485DF15) and emission (ECFP: 475DF30, EYFP: 530DF30) filter wheels to obtain images rapidly. Fluorescence images were then captured with a highly sensitive, back-thinned, cooled CCD camera (Princeton Instrument, Roper Scientific, Trenton, NJ) and processed using Metamorph software (Universal Imaging, West Chester, PA) and Adobe PhotoShop. To minimize photobleaching and phototoxicity, especially for the living cells, the computer-driven automatic shutter was used to achieve the minimum illumination. Images were captured for 1-min exposure time unless otherwise specified. Whenever possible, neutral density filters were used.
Imaging Processing and Quantitative Analysis
Metamorph software (Version 3.5) was used for image processing. For background subtraction, the average background gray value of the image being analyzed (including bias voltage and dark current) was subtracted. To enhance the images further, the unsharpen masking function was applied, and color encoding was used for color presentation. In cells double-labeled with ECFP and EYFP, two images captured individually from ECFP and EYFP channels were superimposed. A line scan analysis demonstrated the quantitative difference in fluorescence intensity. To present images with Adobe PhotoShop, the 12-bit images captured were converted to 8-bit images. After being processed with Adobe PhotoShop, images were printed out directly on a Kodak color printer (Model 8650 PS; Kodak Digital Science).
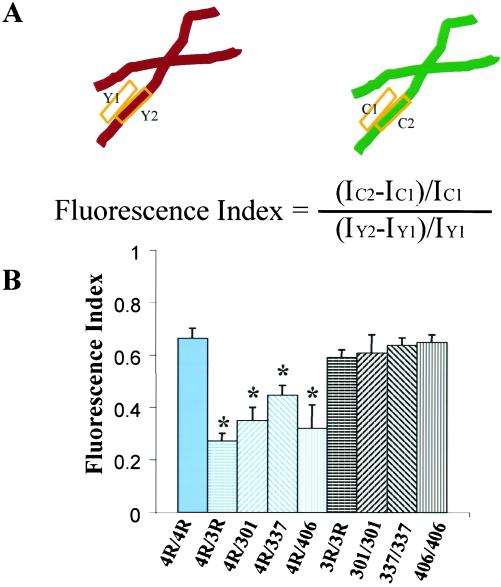
A statistical analysis of the fluorescent signal derived from microtubules compared with microtubule-free regions of the cell was performed for each construct pair. All images were background subtracted by computing an average intensity in three randomly selected 40 × 40 pixel background regions, and the average intensity of the three values was subtracted from the image. For each pair of double-labeled images, two boxes were drawn on the EYFP images: one box contained a microtubule (Y2), and the other box was just adjacent to the microtubule (Y1) (see Figure 8A). The “transfer regions” function was then used to outline the corresponding areas in the ECFP-labeled images from the same cell (C2 and C1). The average intensity of each of the four boxes was measured with the “show region statistics” function and logged into Excel. Nine different construct pairs were analyzed (see Figure 8B). For each construct pair 5–7 cells were analyzed, and 9–10 microtubules (four boxes for each analysis) were analyzed in each cell. A total of 1848 data points were collected. A ratio of the normalized fluorescence intensities (fluorescence index) was computed using the equation shown in Figure 8A. Whether the differences in the values of the indices were significant was determined with a t test.
Figure 8.
Quantification of the ratio of fluorescence intensity between mutant and wild-type tau with regard to their association with microtubules. (A) Top: schematic representation of the analysis on a region of the microtubule (box 2) and a region adjacent to the microtubule (box 1). Y, an area from a EYFP channel; C, an area from a ECFP channel. Bottom: equation for calculating the normalized fluorescence index. I, fluorescence intensity. (B) Bar graph showing the normalized fluorescence indices for sets of cells double-transfected with the tau constructs shown below the bars. 4R/4R is EYFPh4R/ECFPh4R; 4R/3R is EYFPh4R/ECFPh3R; 4R/301 is EYFPh4R/ECFPh4RP301L; 4R/337 is EYFPh4R/ECFPh4RV337M; 4R/406 is EYFPh4R/ECFPh4RR406W; 3R/3R is EYFPh3R/ECFPh3R; 301/301 is EYFPh4RP301L/ECFPh4RP301L; 337/337 is EYFPh4RV337M/ECFPh4RV337M; and 406/406 is EYFPh4RR406W/ECFPh4RR406W. Y axis, the fluorescence index derived from the equation in A. Error bars, SE. *Transfection pairs that significantly differed from the corrresponding black bars and the dual wild-type four-repeat transfection (p < 0.05).
Flow Cytometry
Two days after transfection, cells were suspended in PBS, and flow cytometry was performed in the Dana-Faber Cancer Institute flow cytometry facility on a FACS Bantage (Becton Dickinson Immunocytometry Systems, Mountain View, CA) with Cellquest software.
RESULTS
GFP–Tau Fusion Proteins Behave as Native Tau and Codistribute with Microtubules
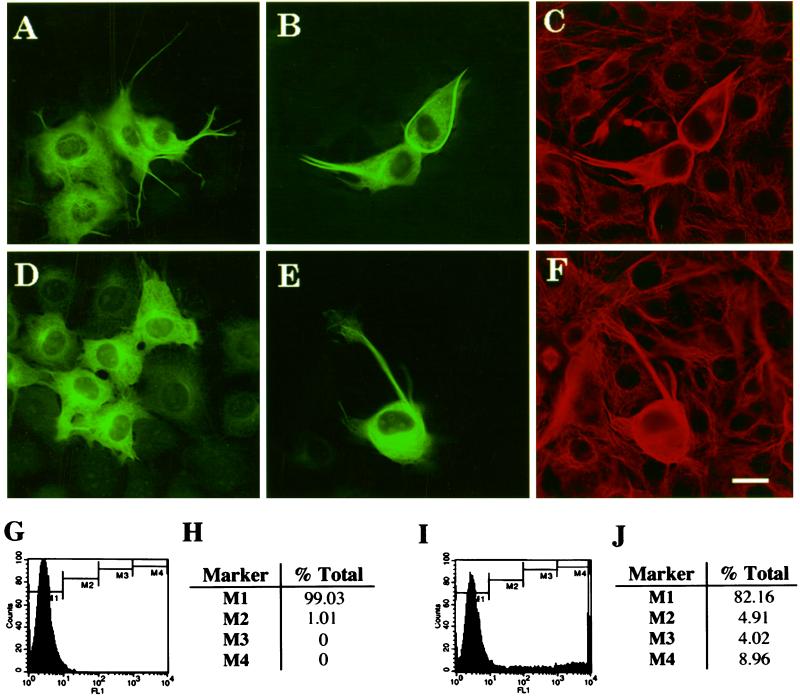
To visualize simultaneously two tau isoforms in living NIH 3T3 cells, we established a dual imaging system to detect individual tau isoforms in separate fluorescence channels. The constructs used were made by fusing the GFP mutants, YFP or CFP, to the amino-termini of various tau mutant or wild-type isoforms. In this way, the location of the emitted fluorescence from the specific mutant GFP indirectly reports on the location of the specific tau isoform to which it was fused. Before embarking on the use of the dual transfection system, we sought to validate the use of GFP–tau fusion protein as an accurate reporter of native tau protein. The effects of the tau fusion proteins on microtubule organization were compared with those of native tau isoforms. Two days after transfection with wild-type 3R or 4R EGFP–tau constructs in NIH 3T3 cells, EGFP–tau fusion proteins, like native tau proteins, were capable of binding to microtubules, bundling microtubules, and increasing the net microtubule mass (Figure 1,A–F). An increased microtubule mass was apparent by labeling the cells with an antibody against α-tubulin, using the GFP signal to detect transfected cells (Figure 1, B and E) and then comparing the corresponding α-tubulin–positive cells with the α-tubulin staining of the nontransfected cells (Figure 1, C and F). The tubulin immunoreactivity was markedly more intense in the EGFP–tau-transfected cells. GFP–tau fusion proteins in a baculoviral construct can also induce processes in Sf9 cells (our unpublished data). All of these effects of GFP–tau fusion proteins characterize native tau isoforms. These results suggest that the GFP–tau fusion proteins and native tau behave similarly in NIH 3T3 cells. A similar conclusion was reached by Kaech et al. (1996).
Figure 1.
Functional competence of GFP–tau. Fluorescence images of fixed cells 2 days after transfection with EGFP–tau-3R (A–C) and EGFP–tau-4R (D–F). (C and F) Cells double-labeled with an antibody to α-tubulin, which correspond to the images in B and E, respectively. EGFP–tau fusion protein induces microtubule polymerization. Scale bar, 10 μm. Tau fluorescence intensity profiles were analyzed by flow cytometry for nontransfected control cells (G and H) and cells 2 days after transfection with EGFP–tau-3R (I and J). For each sample 10,000 cells were analyzed. (G and I) x-axis, the fluorescence intensity in arbitrary units; y-axis, the cell counts normalized for 100 cells. Cells were gated within four different fluorescence intensities marked by M1–M4, and the percentage of cells in each bin are in H and J. Because the maximum fluorescence intensity is 104, transfected cells with a higher intensity fell into the M4 bin, represented by the spike at the end of the x-axis in I.
Some of the transfected cells underwent a more global morphologic transformation with loss of their flattened appearance and the elaboration of processes (Figure 1E). We suspected these differences in cell morphology after tau transfection were related to the amount of tau expressed. To quantitate the variation in tau expression among the transfected cells, we analyzed their fluorescence intensity profiles by flow cytometry (Figure 1, G–J). About 15–18% of the cells were consistently transfected. Higher fluorescence intensities reflect higher concentrations of tau within the volume of the cell. About half of the transfected pool were present in bins M2–M3; the other half was in bin M4 (Figure 1J). Those cells with the lower fluorescence intensity values in bins M2–M3 tended to appear more spread and had fewer microtubule bundles, whether they expressed 3R (Figure 1A) or 4R tau (Figure 1D), than those cells in bin M4.
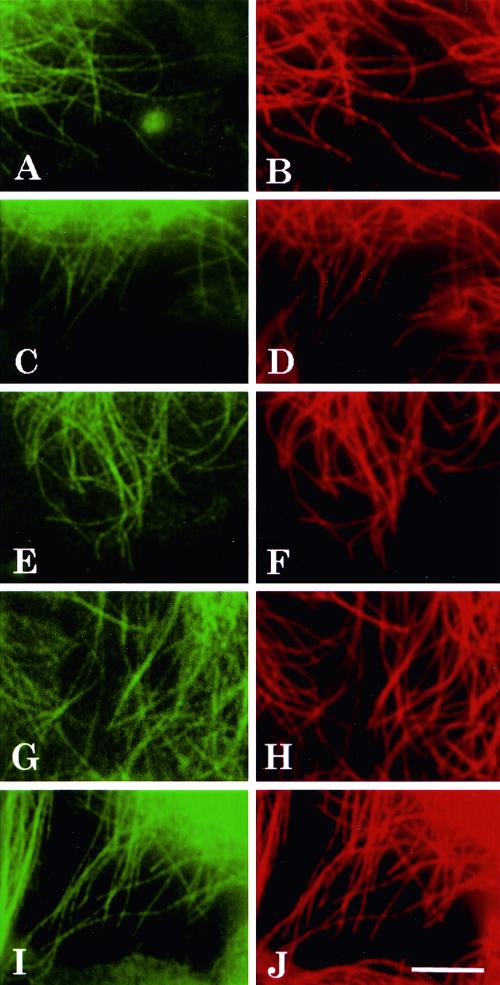
To determine whether the exogenously expressed tau codistributed with the total array of microtubules, EGFP–tau fusion constructs including wild-type tau (3R and 4R) and FTDP-17 tau mutations (4R P301L, 4R V337M, and 4R R406W) were transfected into NIH 3T3 cells. The transfected cells were fixed 2 days after transfection and immunolabeled with a monoclonal antibody against α-tubulin. When any single EGFP–tau construct was transfected, in all cases the EGFP–tau signal codistributed with the microtubules over their entire lengths as observed with a tubulin antibody (Figure 2, A–J). Microtubules devoid of the EGFP–tau signal were not observed. These observations allowed us to conclude that EGFP–tau fusion proteins were competent to bind to microtubules, and when each of the mutant isoforms was singly transfected, they all displayed a microtubule pattern that was indistinguishable from the microtubule patterns observed with wild-type tau transfections.
Figure 2.
The tau protein signal and tubulin antibody label show a near perfect overlap. Double-labeled fluorescence images of fixed cells transfected with different EGFP–tau constructs. Two days after transfection with EGFP–tau-3R (A), EGFP–tau-4R (C), EGFP–tau-4R P301L (E), EGFP–tau-4R V337M (G) and EGFP–tau-4R R406W (I), cells were fixed and double-labeled with antibody to tubulin and are shown in B, D, F, H and J. Scale bar, 5 μm.
Wild-type Tau Displaces Missense Mutant Tau from Microtubules in Dual Transfections
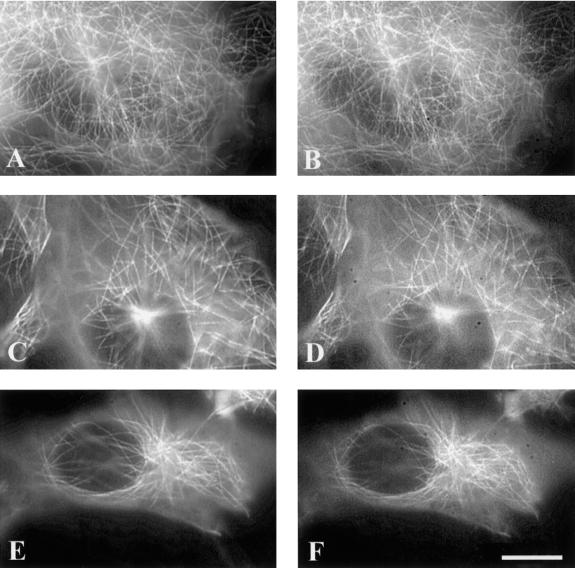
Dual tansfections were performed with 4R wild-type tau isoforms paired with one of the following mutant constructs: 4R P301L (Figure 3F), 4R V337 M (Figure 3B), and 4R R406W (Figure 3D). Although wild-type 4R tau showed a clear microtubule pattern (Figure 3, A, C, and E), in each case, the mutant tau isoform demonstrated a more diffuse pattern that partially obscured the microtubules. Comparisons were made by subtracting the background so that the gray level reading in acellular areas equaled zero for both constructs. Cells with massive microtubule bundles were not included in the analysis. The dual transfections suggested that FTDP-17 mutant tau isoforms bound less well to the microtubules in the presence of wild-type tau than when expressed alone. To eliminate the possibility that with the diminished microtubule binding of the mutant tau isoform was due to the dual transfection, separate constructs of each tau mutant were prepared—one with ECFP and the other with EYFP—and when doubly transfected, a clear microtubule pattern was present (Figure 4). Therefore, a competitive disadvantage of the mutant tau isoform was only revealed in the presence of wild-type tau.
Figure 3.
Fluorescence images of living cells cotransfected with wild-type (A, C, and E) and mutant tau (B, D, and F). Images were captured 2 days after transfection. ECFP was fused to 4RV337M (B), 4RR406W (D), and 4RP301L (F), and EYFP was fused to 4R wild-type tau (A, C, and E). Scale bar, 10 μm.
Figure 4.
Fluorescence images of living cells cotransfected with ECFP (A, C, and E) and EYFP (B, D, and F) constructs that both contain the identical mutant tau isoform (A and B: V337M, C and D: R406W, E and F: P301L). Images were captured 2 days after transfection. Scale bar, 10 μm.
The diminished binding of the mutant isoform was readily apparent in >90% of ∼100 cells examined for each dual transfection. However, differences in the effect among the different mutants were apparent. The diffuse pattern with P301L made it nearly impossible to resolve individual microtubules (Figure 3F); the effects of V337M and R406W were also readily apparent, but less than the effects of P301L (Figure 3, B and D). Differences among the mutations in their relative affinities for microtubules in vitro (Hasegawa et al., 1998) and their relative tendency to form cytochalasin-induced processes in tau-transfected CHO cells have been reported (Dayanandan et al., 1999).
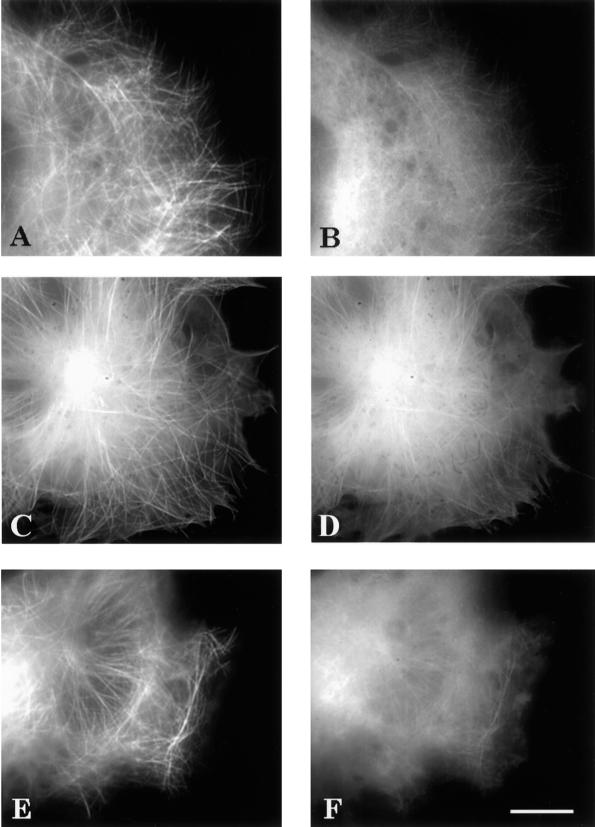
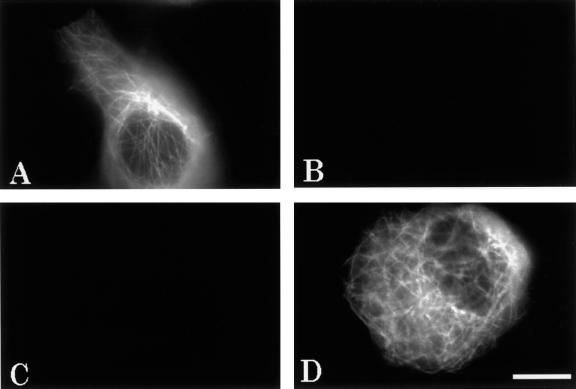
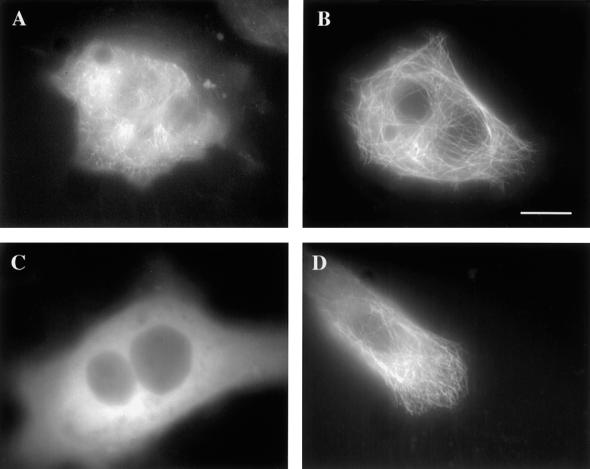
To validate the assumption that the filter sets cleanly distinguished between the ECFP and EYFP signals, cells were transfected with either ECFP or EYFP fusion constructs alone and viewed with both ECFP and EYFP filter sets (Figure 5). The signal from cells transfected with only ECFP–tau-3R suggested a microtubule pattern (Figure 5A), and notably, no fluorescent signal was detected from the EYFP channel in the same cells (Figure 5B). Similarly, when cells were transfected only with EYFP–tubulin (Figure 5D), no signal was detected through the ECFP channel (Figure 5C). These results indicate that the ECFP/EYFP filter sets used here were specific, and no cross-over fluorescent signal occurred between the two channels.
Figure 5.
Specificity of the ECFP and EYFP filter sets. Fluorescence images of cells transfected with either ECFP–tau-3R or EYFP–tubulin. (A) Living cells 2 days after transfection with ECFP–tau-3R alone viewed with ECFP filter set; (B) the same cells viewed with EYFP filter set. (C) Cell transfected with EYFP–tubulin alone viewed with ECFP filter set; (D) the same cell viewed with EYFP filter set. Scale bar, 10 μm.
Four-repeat Tau Displaces Three-repeat Tau from Microtubules in Dual Transfections
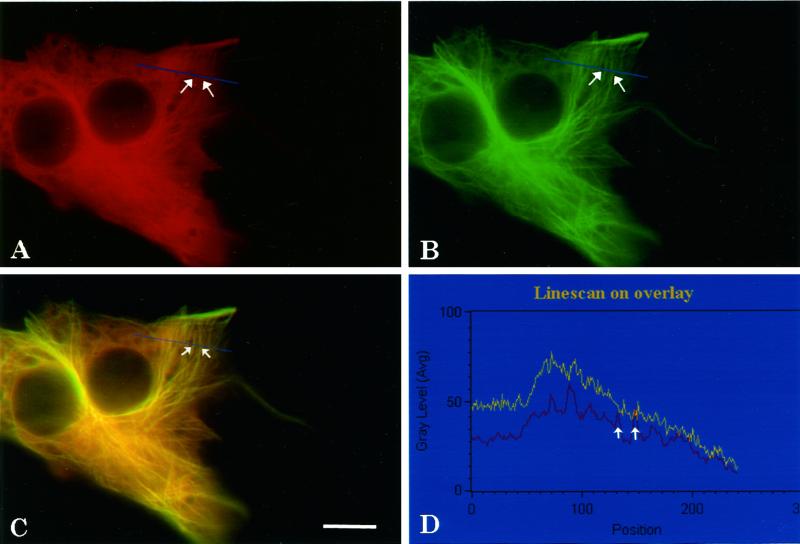
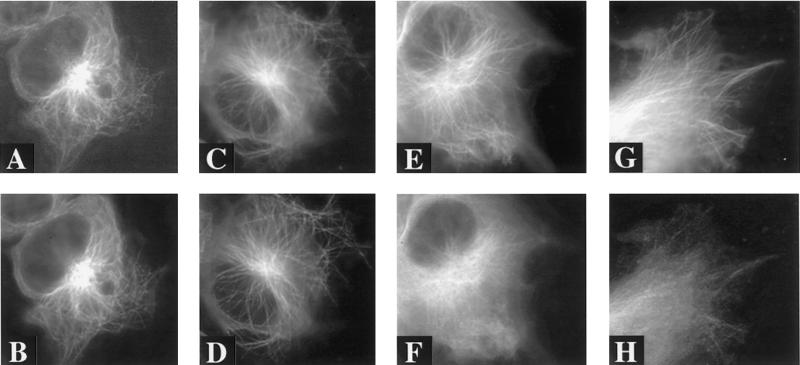
Under physiologic conditions mature CNS neurons have six splice isoforms of tau—three of these isoforms have three microtubule-binding repeats (3R), and three isoforms have four microtubule repeats (4R). The normal average ratio of 3R to 4R in human is about one to one (Hong et al., 1998), but this ratio varies regionally, developmentally, and among different cell types in the brain. In certain forms of FTDP-17 with mutations that affect the generation of the splice isoforms, this ratio is further altered. Because some of these mutations that affect splicing lie in the intron, the coding region remains unaffected, and analyses of these mutations are more difficult than coding region mutations. To approach this problem, we double transfected NIH 3T3 cells with ECFP–tau-3R and EYFP–tau-4R fusion constructs to observe each isoform individually in the same cell. When cells were double transfected with a 1:1 ratio of DNA, nearly 100% of the transfected cells expressed both 3R and 4R protein; however, their distributions differed. EYFP–tau-4R clearly codistributed with the microtubules and contributed relatively modest diffuse fluorescence (Figure 6B). In contrast, ECFP–tau-3R was more diffusely distributed and appeared to bind less well to the microtubules (Figure 6A). This effect was present in over 90% of ∼100 cells examined for each dual transfection. When either EYFP–tau-4R or ECFP–tau-3R was expressed alone, there was little diffuse label, and nearly all of the tau appeared bound to the microtubules (Figure 2, A and C). Importantly, the expression of ECFP–tau-3R alone resulted in a microtubule pattern, but when coexpressed with EYFP–tau-4R, some of the three-repeat isoform became displaced from the microtubules. This result demonstrates that the two isoforms compete for the same binding sites on microtubules and 4R tau can displace 3R tau from microtubules. It is possible that in dual transfections one signal will always appear reduced relative to the other. Several experiments were performed to eliminate this possibility. First we coexpressed ECFP–tau-3R and EYFP–tau-3R in the same cells. In both channels, tau was clearly associated with microtubules, and the signal from the regions of the cell unassociated with microtubules was minimal in both channels (Figure 7, A and B). There was no significant difference in the tau distribution between the two channels. A similar result was observed for cells coexpressing ECFP–tau-4R and EYFP–tau-4R (Figure 7, C and D). Second, the ECFP/EYFP tags for three- and four-repeat tau were switched. Switching the tags did not alter the results: Both EYFP–tau-4R (Figure 7E) and ECFP–tau-4R (Figure 7G) remained microtubule associated, whereas the ECFP–tau-3R (Figure 7F) and EYFP–tau-3R (Figure 7H) were more diffuse. Finally, to eliminate the influence of photobleaching and possible interactions between ECFP and EYFP chromophores, consecutive images were captured rapidly under the control of the computer program, with automatic shutters placed in the excitation light path to allow minimum exposure time. Two exposures in the same channel showed no significant photobleaching. Furthermore, switching the order in which images were captured from the two different channels did not change the results.
Figure 6.
Fluorescence images of living cells cotransfected with ECFP–tau-3R (A), EYFP–tau-4R (B), merged image (C), and line scan analysis (D). Cells were cotransfected with 1 μg DNA of ECFP–tau-3R and 1 μg DNA of EYFP–tau-4R. Images were captured 2 days after transfection and pseudocolored. The same cell viewed with the ECFP filter (A), the EYFP filter (B), and the overlay (C) in which the blue line indicates the path of the line scan (D) performed on the overlay. The white arrows in C indicate two microtubules that correspond to the white arrows in the line scan. In the graph, the x-axis corresponds to the relative position along the line and the y-axis represents the average gray level of fluorescence intensity. Red line, the trace for four-repeat tau; yellow line, the trace for three-repeat tau. Scale bar, 10 μm.
Figure 7.
Fluorescence images of living cells double-transfected with ECFP/EYFP labeled three- and/or four-repeat tau. Images were captured 2 days after transfection. (A) ECFP–tau-3R and (B) EYFP–tau-3R in cells double-transfected with ECFP–tau-3R and EYFP–tau-3R. (C) ECFP–tau-4R and (D) EYFP–tau-4R in cells cotransfected with both isoforms. Panels E–H demonstrate that interchanging the ECFP/EYFP labels does not alter the distributions of tau. (E and G) EYFP–tau-4R, ECFP–tau-4R; (F and H) ECFY–tau-3R, EYFP–tau-3R. Note: increased non–microtubule-associated tau-3R. Scale bar, 10 μm.
Quantification of the Tau Signal
To quantitate the differential distributions of three- and four-repeat tau, images of ECFP–tau-3R (Figure 6A) and EYFP–tau-4R (Figure 6B) were captured from living cells coexpressing the two isoforms and pseudocolored red and green, respectively. The overlay fluorescence image (Figure 6C) suggested more four-repeat tau binding to microtubules (green) and more three-repeat tau distributed diffusely throughout the cytoplasm (reddish hue in regions of the cell devoid of microtubules). Performing line scans under these conditions demonstrated distinct patterns for 3R and 4R tau. Most remarkable was an increased gray level across the entire cell with 3R tau relative to 4R tau. For example in Figure 6D, ECFP–tau-3R (yellow trace) showed a relative increased fluorescence throughout most of the cytoplasm. The broadly increased gray levels observed for the 3R tau isoform obscured the boundaries of the microtubules, making them difficult to distinguish. In contrast, individual microtubules were readily visible from EYFP–tau-4R (Figure 6D, red trace), and they could be distinguished as discrete peaks in the line scan (Figure 6D, white arrows).
To determine if the conclusions from the line scan were statistically valid, a more comprehensive comparison was undertaken for each of the wild-type and mutant tau constructs. For these dual transfections wild-type tau was fused to EYFP, and mutant tau was fused to ECFP. From the experiments described above we established that the isoform with reduced microtubule binding has a higher diffuse cytoplasmic signal regardless of the fluorescent protein to which it was fused (Figure 7, E–H). The average fluorescence intensity within two defined areas in the EYFP cells was measured: these regions were a box containing a microtubule and an adjacent box without a microtubule. The average fluorescence intensity in an exactly corresponding pair of boxes was measured in the ECFP cells, and these values used to establish a ratio of the normalized fluorescence intensities or fluorescence index according to the equation described in Figure 8A, which was written so that the index will be normalized with regard to small local intensity differences in the site of the boxes for each of the multiple measurements. This index was first computed for cells transfected with two identical tau constructs, one fused to ECFP and the other to EYFP. For each pair with identical tau constructs the fluorescence indices did not differ significantly from each other (p > 0.05) (Figure 8B). A fluorescence index less than one in these comparisons indicates that the efficiency of gathering fluorescence from the CFP channel was consistently less than that from the YFP channel. The fluorescence indices among all of these dual transfections with identical tau constructs that differed only by the fluorescent protein to which they were fused were nearly identical. This result suggests that the dual transfections did not saturate the microtubule system, resulting in the displacement of some tau-fluorescent protein to the diffuse cytoplasmic compartment. A similar comparison with mutant and wild-type tau dual transfections resulted in a significantly reduced fluorescence index for each of the mutants tested (p < 0.05). Although all of the tau mutant constructs used in this assay contained four repeats, their behavior in the assay resembled three-repeat tau (Figure 8B).
Validation of the Tau Signal
The diffuse fluorescence unassociated with microtubules most likely represented tau within a soluble cytosolic compartment free of the cytoskeleton. To support this view, we extracted cells transfected with both mutant and wild-type tau. If mutant tau is less well bound and represented by the diffuse signal, then Triton X-100 extraction should selectively diminish the signal from the mutant tau isoform only. NIH 3T3 cells transfected with both EYFP–tau-4R wild-type and ECFP–tau-4R P301L were extracted with 0.1% Triton X-100 before fixation (Figure 9, A and B). Treatment with detergent markedly reduced the diffuse fluorescent signal that was associated with ECFP–tau-4R P301L but had only minimal effects on the fluorescence associated with microtubules (cf. Figure 3F with Figure 9, A and B). This effect was most evident by comparing the gray levels in regions of cytoplasm devoid of microtubules in detergent-extracted and nonextracted cells. After detergent extraction, the signal from these regions of the cell equaled the signal from the background reading outside the cell. In nonextracted cells (Figure 3F), the signal from these regions was considerably greater than the background reading outside the cell. After extraction a pool of ECFP–tau-4R P301L remained associated with the microtubules; however, a considerably greater residual signal derived from the EYFP–tau-4R wild-type (Figure 9, A and B). These results indicate that a portion of the diffuse signal observed from the ECFP–tau-4R P301L is Triton extractable and unassociated with the cytoskeleton. Similar differential effects of Triton X-100 extraction occurred with coexpression of 3R and 4R tau. In cells that coexpressed 3R and 4R tau, extraction with Triton X-100 removed the diffuse pool of mostly 3R tau that was not associated with microtubules. More protracted extractions also reduced the signal of the 3R tau associated with the microtubules (our unpublished data). We concluded that coexpression of both mutant and wild-type or 3R and 4R tau isoforms selectively disassociated mutant or 3R tau from the microtubules and increased the cytosolic pool of these less tightly microtubule-associated isoforms.
Figure 9.
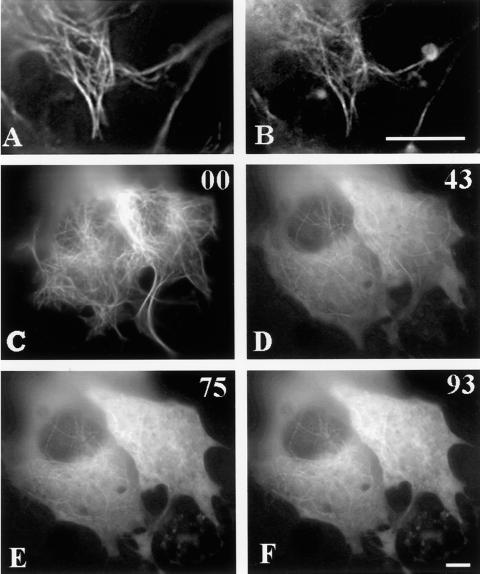
Fluorescence images of cells double-transfected with EYFP–tau-4R and ECFP–tau-4RP301L and then extracted with Triton X-100 (A and B). Two days after transfection, cells were extracted with 0.1% Triton X-100 for 30 s before fixation. (A) The EYFP–tau-4R wild-type signal; (B) the ECFP-4R P301L signal in the extracted cells. Note the decreased diffuse staining in B. Increased diffuse tau after treatment with 165 μM nocadozole (C–F). Cells transfected with ECFP–tau-3R have a microtubule pattern (C). When the cell was perfused with medium containing nocadozole for 43 (D), 75 (E), and 93 (F) minutes, the diffuse tau signal progressively increased. Scale bar, 5 μm.
A second completely independent experiment supported the interpretation that the diffuse signal arose from the pool of tau not bound to microtubules. Cells were treated with nocadozole to depolymerize the microtubules. Normally tau stabilizes microtubules, and therefore a higher dose of nocadozole was required. Application of the drug resulted in a progressive increase of diffuse signal over time because tau will not bind to depolymerized microtubules (Figure 9, C–F).
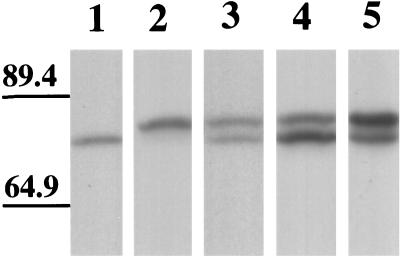
In transient expression systems, the expression level varies over a fairly wide range (Figure 1, I and J). The level of tau expression can be approximated by the tendency of tau to induce microtubule bundles as the level of expression increases. In a single dish at 2 days after transfection, transfected cells displayed a range of microtubule patterns from a loose network in which individual microtubules were readily apparent at low expression levels to increasingly thick microtubule bundles at higher expression levels. To minimize errors possibly introduced by the heterogeneity of expression levels, we changed the ratio of the amount of DNA for three- and four-repeat tau transfections. Among the variables that determine the level of expression are the amount of DNA transfected and the time elapsed from the transfection. In single tau isoform transfections with 1 μg of DNA, cells could not be consistently transfected; 2 μg of DNA was the minimum for consistently successful transfections. When the amount of DNA for transfection was increased from 2 to 4 μg, the percentage of cells with bundled microtubules after 2 days increased. The ratios of 3R to 4R tau tested were 1:1 (1 μg :1 μg, 1.5 μg:1.5 μg, and 2 μg:2 μg), 1:2 (1 μg:2 μg), and 2:1 (2 μg:1 μg). For each of these ratios of three- to four-repeat tau, >100 cells were randomly observed at 2 days after transfection. The various ratios of transfected tau were accurately reflected in amounts of tau detected in immunoblasts of total cell lysates (Figure 10). Regardless of the ratio, when the two isoforms were coexpressed, the pool of 3R tau diffusely present in the cytoplasm was increased relative to 4R tau or relative to the expression of 3R tau alone. Specifically, an increase of 4R tau relative to 3R did not significantly alter the pattern in which 3R tau gave the diffuse cytoplasmic signal. These experiments suggest that 4R tau displaces 3R tau even at altered stoichiometries.
Figure 10.
Immunoblot of cells transfected with different ratios of tau isoforms. Lysates were prepared from cells 2 days after transfection with different GFP–tau isoforms. Lane 1: Tranfection with EGFP–tau-3R (6 μg DNA/60-mm dish) alone. Lane 2: Transfection with ECFP–tau-4R (6 μg DNA/60-mm dish) alone. Lane 3: Double transfection with both EGFP–tau-3R (3 μg DNA/60-mm dish) and EGFP–tau-4R (3 μg DNA/60-mm dish). Lane 4: Double transfection with both EGFP–tau-3R (6 μg DNA/60-mm dish) and EGFP–tau-4R (3 μg DNA/60-mm dish). Lane 5: Double transfection with both EGFP–tau-3R (3 μg DNA/60-mm dish) and EGFP–tau-4R (6 μg DNA/60-mm dish). Note that the amount of protein expression in transfected cells approximates the ratios of DNA used for transfection. Molecular weights are indicated on the left.
The final experiment that demonstrates the validity of this approach is the use of kinases to displace tau from the microtubules. The p25/CDK5 complex hyperphosphorylates tau, which reduces tau's ability to associate with microtubules (Patrick et al., 1999). Triple transfection with EGFP–tau-3R and either p25/CDK5 (Figure 11A) or p25/DNCDK5 (a catalytically inactive mutant of cdk5) (Figure 11B) displaced tau from the microtubules, as indicated by increased diffuse fluorescence in the cytoplasm, only with active cdk5. Similarly, triple tansfection with EGFP–tau-4R P301L and either p25/CDK5 (Figure 11C) or p25/DNCDK5 (Figure 11D) displaced tau only in the presence of active cdk5.
Figure 11.
Effects of p25/cdk5 on tau–microtubule binding in living cells. Triple transfection with EGFP–tau-3R and either p25/cdk5 (A) or p25/DNK5 (a catalytically inactive mutant of cdk5). (B) Displacement of tau from the microtubules as indicated by increased diffuse fluorescence in the cytoplasm only in the presence of active cdk5. Cells were studied 2 days after transfection. Similar results were obtained in cells transfected with EGFP–tau-4RP301L and either p25/cdk5 (C) or p25/DNK5 (D). Scale bar, 10 μm.
DISCUSSION
Two proteins that differ by only a single amino acid can be individually detected in a living cell with fusion constructs of mutant GFPs that fluoresce at different wavelengths. This approach allowed us to visualize separately mutant and wild-type tau in a single cell. We detected the dissociation from the microtubules of the lower affinity tau isoform when two tau isoforms with unequal affinities for microtubules were coexpressed. In contrast, when the lower affinity isoform was expressed alone, it bound well to the microtubules. We validated these findings obtained by dual imaging as follows: 1) in cells transfected only with ECFP–tau, no signal could be detected with the filter set corresponding to the emission and excitation wavelengths of EYFP; likewise, in cells transfected only with EYFP–tau, no signal could be detected with the filter set corresponding to the emission and excitation wavelengths of ECFP; 2) interchanging the ECFP and EYFP fused to a specific tau isoform did not alter the results; 3) whether the first images were captured from the ECFP or the EYFP channel not affect the results; 4) fusing the same tau isoform to constructs with a ECFP and a EYFP caused neither the dissociation of the ECFP nor the EYFP signal from the microtubules in dual-transfection experiments; 5) titration of the isoform ratios did not alter the results; and 6) tau hyperphosphorylation reproduced the dissociation observed with isoform competition.
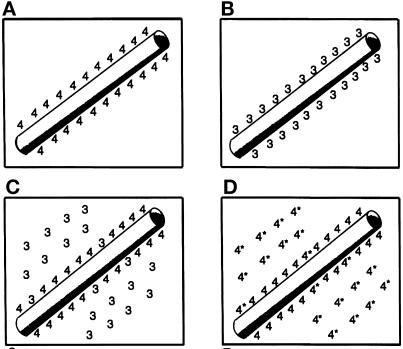
Tau with the missense mutations, 4R P301L, 4R V337M and 4R R406W, all distributed with microtubules when expressed alone (Figure 2) but were significantly dissociated from microtubules and appeared diffuse in the cytoplasm when coexpressed with wild-type tau. This in vivo data is consistent with the reduced binding properties of these mutant isoforms observed in vitro (Hong et al., 1998) but suggests a more complex regulation that includes competition among the tau isoforms for binding to microtubules. The size of both the free and bound pools of tau depends on competition among the isoforms (Figure 12, A–D). Within a certain concentration range, the isoform that predominates in the free pool depends more on the presence of competing isoforms than on concentration effects (see titration experiments above). Because the mutations that cause FTDP-17 are present in the heterozygous condition, indeed both the wild-type and mutant isoforms will be present in affected neurons, thus altering the competitive kinetic interactions with the microtubules.
Figure 12.
A cartoon representation of tau isoform binding to microtubules. When expressed alone 3R and 4R tau (A and B) bind well to the microtubules. In coexpression assays 4R displaces 3R (C) and mutant tau (4*) (D).
Intuitively, the decreased binding of the mutant tau isoforms squares well with the generally accepted view that the inclusions found in patients with FTDP-17 arise from the free pool of tau. However, the results of the 3R and 4R tau coexpression experiments here, together with the known increase in 4R tau that occurs with the splice site mutations, may force some revision of the view that tau inclusions arise from the free pool of cellular tau. 4R tau has a greater affinity for microtubules than 3R tau (Goode and Feinstein, 1994; Lee et al., 1989), and when the 3R and 4R tau isoforms were expressed together in the same cell, the 3R isoform dissociated from the microtubules. However, when expressed alone, 3R tau appeared mostly bound to the microtubules. Splice site mutations, which increase the amount of 4R tau relative to 3R tau (reviewed in Spillantini and Goedert [1998]), induce inclusions which consist of 4R tau (Clark et al., 1998; Goedert et al., 1999; Hong et al., 1998). Paradoxically, the shift in expression to 4R tau, which dissociates 3R tau from microtubules, results in inclusions made of 4R tau.
One resolution of this paradox is that mutations that alter tau binding differ mechanistically from those mutations that affect splicing. Mutations such as P301L, which affect tau binding to microtubules, may first preferentially dissociate from the microtubules and then self-assemble. However, dissociation of tau from the microtubules alone is insufficient to cause inclusions because treatment of neurons with depolymerizing drugs does not induce tau self-assembly. Furthermore, very high levels of tau expression in cell culture increases free tau without inducing tau self-assembly. Therefore, one needs to postulate a second effect of the mutation, which is a tendency for tau to self-assemble. On the other hand, some evidence for the increased assembly properties of mutant tau has been published (Arrasate et al., 1999; Nacharaju et al., 1999).
In the case of the splice mutations, it is difficult to conclude that the tau inclusions arise from the free pool of tau. In addition to displacement of 3R tau from the microtubule with increased 4R tau, most of the splice mutations do not affect the tau coding sequence, and so it seems unlikely that tau gains the property of self-assembly. Increased 4R expression would either increase the total pool of bound tau (if additional tau binding sites were available on the microtubule) or shift the population of bound tau isoforms further toward 4R while displacing 3R tau (if all the tau binding sites were occupied). Because the cell culture system involves overexpression, the later seems more likely; however, tau promotes the polymerization of microtubules, and therefore additional sites for tau binding will emerge as tau expression continues unchecked in a transfected cell.
One speculation proposed to resolve these contradictions is that the 4R and 3R tau isoforms have different binding sites on the microtubule (Hutton, 1999). This possibility also seems unlikely given our observations that 4R tau can displace 3R tau from binding to the microtubules. Furthermore, when the ratios of 3R:4R were altered, 4R tau still displaced 3R tau. And even though free 3R tau increases with more 4R tau, one cannot argue that 3R is incapable of forming inclusions in vivo because exclusively 3R tau inclusions occur (Delacourte et al., 1998).
Perhaps the most likely, but somewhat surprising resolution to these contradictions is that the microtubule must maintain an exquisitely controlled distribution of tau isoforms and when that distribution is altered, the microtubule itself seeds the formation of tau assembly. If tau from the microtubule-bound pool seeds self-assembly, where within this pool is tau most vulnerable? Based on the observation that tau aggregation is induced by polyanions including polyglutamate, two sites are possible. Polyglutamylation is a posttranslational modification that occurs at the carboxy terminus of both α- and β-tubulin, particularly in the brain (Alexander et al., 1991; Edde et al., 1990) and can affect the interaction of tau with the microtubules (Boucher et al., 1994). The presence of these charge groups on tubulin may seed tau polymerization from the microtubule. The second possibility is that tau polymerization is seeded from the ends of dynamically unstable microtubules. In vitro studies have shown that tau can bind to microtubules in a tau:tubulin ratio of nearly one to one; however, very small amounts of tau (1:175 tau to tubulin) can suppress microtubule dynamics even in the absence of any detectable change in polymer mass (Panda et al., 1995) and in a ratio of 1 molecule of tau to 15 molecules of tubulin suppress the treadmilling rate by 70% (Panda et al., 1999). This observation raises the possibility of favored binding sites at the dynamically less stable ends of the microtubules. Here tau is less tightly bound to the microtubules and may be more phosphorylated. As microtubules grow and shrink and the protofilaments bundle together or splay (reviewed in Drechsel and Kirschner [1994]), the carboxy terminal glutamic acids of tubulin, which appear unordered in the crystal structure (Nogales et al., 1998), may assume conformations capable of inducing the assembly of tau.
ACKNOWLEDGMENTS
We thank Michael Hutton for the gift of the tau clones with the coding mutations used here, Lisa Orrechio and Jimin Zhang for technical help, Miguel Medina and Martha Rook for many helpful comments, and Stu Feinstein for a critical reading of the manuscript. This work was supported by National Institutes of Health grant AG06601.
REFERENCES
- Alexander JE, Hunt DF, Lee MK, Shabanowitz J, Michel H, Berlin SC, MacDonald TL, Sundberg RJ, Rebhun LI, Frankfurter A. Characterization of posttranslational modifications in neuron-specific class III beta-tubulin by mass spectrometry. Proc Natl Acad Sci USA. 1991;88:4685–4689. doi: 10.1073/pnas.88.11.4685. [DOI] [PMC free article] [PubMed] [Google Scholar]
- Arrasate M, Perez M, Armas-Portela R, Avila J. Polymerization of tau peptides into fibrillar structures. The effect of FTDP-17 mutations. FEBS Lett. 1999;446:199–202. doi: 10.1016/s0014-5793(99)00210-0. [DOI] [PubMed] [Google Scholar]
- Boucher D, Larcher JC, Gros F, Denoulet P. Polyglutamylation of tubulin as a progressive regulator of in vitro interactions between the microtubule-associated protein Tau and tubulin. Biochemistry. 1994;33:12471–12477. doi: 10.1021/bi00207a014. [DOI] [PubMed] [Google Scholar]
- Bugiani O, et al. Frontotemporal dementia and corticobasal degeneration in a family with a P301S mutation in tau. J Neuropathol Exp Neurol. 1999;58:667–677. doi: 10.1097/00005072-199906000-00011. [DOI] [PubMed] [Google Scholar]
- Clark LN, et al. Pathogenic implications of mutations in the tau gene in pallido-ponto-nigral degeneration and related neurodegenerative disorders linked to chromosome 17. Proc Natl Acad Sci USA. 1998;95:13103–13107. doi: 10.1073/pnas.95.22.13103. [DOI] [PMC free article] [PubMed] [Google Scholar]
- D'Souza I, Poorkaj P, Hong M, Nochlin D, Lee VM, Bird TD, Schellenberg GD. Missense and silent tau gene mutations cause frontotemporal dementia with parkinsonism-chromosome 17 type, by affecting multiple alternative R.N.A. splicing regulatory elements [In Process Citation] Proc Natl Acad Sci USA. 1999;96:5598–5603. doi: 10.1073/pnas.96.10.5598. [DOI] [PMC free article] [PubMed] [Google Scholar]
- Dayanandan R, Van Slegtenhorst M, Mack TG, Ko L, Yen SH, Leroy K, Brion JP, Anderton BH, Hutton M, Lovestone S. Mutations in tau reduce its microtubule binding properties in intact cells and affect its phosphorylation. FEBS Lett. 1999;446:228–232. doi: 10.1016/s0014-5793(99)00222-7. [DOI] [PubMed] [Google Scholar]
- Delacourte A, Sergeant N, Wattez A, Gauvreau D, Robitaille Y. Vulnerable neuronal subsets in Alzheimer's and Pick's disease are distinguished by their tau isoform distribution and phosphorylation. Ann Neurol. 1998;43:193–204. doi: 10.1002/ana.410430209. [DOI] [PubMed] [Google Scholar]
- Drechsel DN, Kirschner MW. The minimum GTP cap required to stabilize microtubules [published erratum appears in Curr. Biol. 1995, 5(2), 215] Curr Biol. 1994;4:1053–1061. doi: 10.1016/s0960-9822(00)00243-8. [DOI] [PubMed] [Google Scholar]
- Edde B, Rossier J, Le Caer JP, Desbruyeres E, Gros F, Denoulet P. Posttranslational glutamylation of alpha-tubulin. Science. 1990;247:83–85. doi: 10.1126/science.1967194. [DOI] [PubMed] [Google Scholar]
- Foster NL, Wilhelmsen K, Sima AA, Jones MZ, D'Amato CJ, Gilman S. Frontotemporal dementia and parkinsonism linked to chromosome 17: a consensus conference. Ann Neurol. 1997;41:706–715. doi: 10.1002/ana.410410606. [DOI] [PubMed] [Google Scholar]
- Goedert M, et al. Tau gene mutation in familial progressive subcortical gliosis. Nat Med. 1999;5:454–457. doi: 10.1038/7454. [DOI] [PubMed] [Google Scholar]
- Goedert M, Spillantini MG, Jakes R, Rutherford D, Crowther RA. Multiple isoforms of human microtubule-associated protein tau: sequences and localization in neurofibrillary tangles of Alzheimer's disease. Neuron. 1989;3:519–526. doi: 10.1016/0896-6273(89)90210-9. [DOI] [PubMed] [Google Scholar]
- Goode BL, Feinstein SC. Identification of a novel microtubule binding and assembly domain in the developmentally regulated inter-repeat region of tau. J Cell Biol. 1994;124:769–782. doi: 10.1083/jcb.124.5.769. [DOI] [PMC free article] [PubMed] [Google Scholar]
- Hasegawa M, Smith MJ, Goedert M. Tau proteins with FTDP-17 mutations have a reduced ability to promote microtubule assembly. FEBS Lett. 1998;437:207–210. doi: 10.1016/s0014-5793(98)01217-4. [DOI] [PubMed] [Google Scholar]
- Hasegawa M, Smith MJ, Iijima M, Tabira T, Goedert M. FTDP-17 mutations N279K and S305N in tau produce increased splicing of exon 10. FEBS Lett. 1999;443:93–96. doi: 10.1016/s0014-5793(98)01696-2. [DOI] [PubMed] [Google Scholar]
- Hong M, et al. Mutation-specific functional impairments in distinct tau isoforms of hereditary FTDP-17. Science. 1998;282:1914–1917. doi: 10.1126/science.282.5395.1914. [DOI] [PubMed] [Google Scholar]
- Hutton M. Missense and splicing mutations in tau associated with FTDP-17: multiple pathogenic mechanisms. NeuroSci News. 1999;2:73–82. doi: 10.1212/wnl.56.suppl_4.s21. [DOI] [PubMed] [Google Scholar]
- Hutton M, et al. Association of missense and 5′-splice-site mutations in tau with the inherited dementia FTDP-17. Nature. 1998;393:702–705. doi: 10.1038/31508. [DOI] [PubMed] [Google Scholar]
- Kaech S, Ludin B, Matus A. Cytoskeletal plasticity in cells expressing neuronal microtubule-associated proteins. Neuron. 1996;17:1189–1199. doi: 10.1016/s0896-6273(00)80249-4. [DOI] [PubMed] [Google Scholar]
- Kosik K, Orecchio L, Bakalis S, Neve R. Developmentally regulated expression of specific tau sequences. Neuron. 1989;2:1389–1397. doi: 10.1016/0896-6273(89)90077-9. [DOI] [PubMed] [Google Scholar]
- Kosik KS. ed. Brain Microtubule Associated Proteins, J. Avila, R. Brandt, and K.S. Kosik. Amsterdam, Netherlands: Harwood Academic Publishers; 1997. Tau: structure and function; pp. 43–52. [Google Scholar]
- Lee G. Brain Microtubule Associated Proteins: Modifications in Disease. J. Avila, R. Brandt, and K. S. Kosik. Amsterdam, Netherlands: Harwood Academic Publishers; 1997. Expression of map cDNAs in eukaryotic cells; pp. 293–311. [Google Scholar]
- Lee G, Neve RL, Kosik KS. The microtubule binding domain of tau protein. Neuron. 1989;2:1615–1624. doi: 10.1016/0896-6273(89)90050-0. [DOI] [PubMed] [Google Scholar]
- Nacharaju P, Lewis J, Easson C, Yen S, Hackett J, Hutton M, Yen SH. Accelerated filament formation from tau protein with specific FTDP-17 missense mutations. FEBS Lett. 1999;447:195–199. doi: 10.1016/s0014-5793(99)00294-x. [DOI] [PubMed] [Google Scholar]
- Nogales E, Wolf SG, Downing KH. Structure of the alpha beta tubulin dimer by electron crystallography [see comments] [published erratum appears in Nature 1998, May 14, 393(6681),191] Nature. 1998;391:199–203. doi: 10.1038/34465. [DOI] [PubMed] [Google Scholar]
- Panda D, Goode BL, Feinstein SC, Wilson L. Kinetic stabilization of microtubule dynamics at steady state by tau and microtubule-binding domains of tau. Biochemistry. 1995;34:11117–11127. doi: 10.1021/bi00035a017. [DOI] [PubMed] [Google Scholar]
- Panda D, Miller HP, Wilson L. Rapid treadmilling of brain microtubules free of microtubule-associated proteins in vitro and its suppression by tau [In Process Citation] Proc Natl Acad Sci USA. 1999;96:12459–12464. doi: 10.1073/pnas.96.22.12459. [DOI] [PMC free article] [PubMed] [Google Scholar]
- Patrick GN, Zukerberg L, Nikolic M, de la Monte S, Dikkes P, Tsai LH. Conversion of p35 to p25 deregulates Cdk5 activity and promotes neurodegeneration. Nature. 1999;402:615–622. doi: 10.1038/45159. [DOI] [PubMed] [Google Scholar]
- Rizzu P, et al. High prevalence of mutations in the microtubule-associated protein tau in a population study of frontotemporal dementia in the Netherlands. Am J Hum Genet. 1999;64:414–421. doi: 10.1086/302256. [DOI] [PMC free article] [PubMed] [Google Scholar]
- Spillantini MG, Goedert M. Tau protein pathology in neurodegenerative diseases. Trends Neurosci. 1998;21:428–433. doi: 10.1016/s0166-2236(98)01337-x. [DOI] [PubMed] [Google Scholar]
- Yasuda M, et al. A mutation in the microtubule-associated protein tau in pallido-nigro-luysian degeneration. Neurology. 1999;53:864–868. doi: 10.1212/wnl.53.4.864. [DOI] [PubMed] [Google Scholar]


