Abstract
STAT factors act as signal transducers of cytokine receptors and transcriptionally activate specific target genes. The recently discovered protein PIAS3 binds directly to STAT3 and blocks transcriptional activation. Here, we present experimental evidence implementing the zinc finger protein Gfi-1 as a new regulatory factor in STAT3-mediated signal transduction. The interaction between the two proteins first became evident in a yeast two-hybrid screen but was also seen in coprecipitation experiments from eukaryotic cells. Moreover, we found that both Gfi-1 and PIAS3 colocalize in a characteristic nuclear dot structure. While PIAS3 exerts a profound inhibitory effect on STAT3-mediated transcription of target promoters, Gfi-1 can overcome the PIAS3 block and significantly enhances STAT3-mediated transcriptional activation. In primary T cells, Gfi-1 was able to amplify IL-6-dependent T-cell activation. As Gfi-1 is a known, dominant proto-oncogene, our findings bear particular importance for the recently described ability of STAT3 to transform cells malignantly and offer an explanation of the oncogenic potential of Gfi-1 in T lymphocytes.
Keywords: cytokine signaling/Gfi-1/nuclear dots/STAT3/T-cell proliferation
Introduction
The gfi-1 gene was first discovered as an integration site for Moloney murine leukemia virus (MoMuLV) in virally infected cells that were selected for IL-2-independent proliferation (Gilks et al., 1993). Other studies involving MoMuLV-infected transgenic mice carrying the trans-oncogenes pim-1 and L-myc showed that the gfi-1 gene is a frequent target for MoMuLV provirus and is most likely involved in the accelerated progression of lymphoid malignancies in MoMuLV-infected mice (Schmidt et al., 1996; Zörnig et al., 1996; Scheijen et al., 1997). These and subsequent findings provided evidence that Gfi-1 can act as a dominant oncogene and cooperates in the process of lymphomagenesis with Myc, an HLH-LZ transcription factor and Pim-1, a cytoplasmic serine/threonine kinase (Zörnig et al., 1996; Scheijen et al., 1997; Schmidt et al., 1998). Gfi-1 is a member of a protein family that includes Gfi-1b (Fuchs et al., 1997; Rödel et al., 1998; Tong et al., 1998) as well as the murine proteins Snail and Slug (Grimes et al., 1996; Zweidler-McKay et al., 1996). All proteins of the Gfi-1 family share the six C-terminal C2-H2 zinc finger domains and the characteristic ‘SNAG’ domain that comprises the first 20 amino acid residues (Zweidler-McKay et al., 1996).
Several studies with cultured cells indicated that constitutive Gfi-1 expression can relieve peripheral mature T cells from a requirement of IL-2 to overcome a G1 arrest (Grimes et al., 1996) or could help to sustain cell proliferation of IL-2-dependent cells in the absence of the cytokine (Zörnig et al., 1996), which suggested a role for Gfi-1 in IL-2-dependent cell cycle progression of T cells. Cytokines such as IL-2 or IL-6 mediate their signals after binding the respective membrane-bound cytokine receptors through the activation of several cytoplasmic proteins. In particular, signal transducers and activators of transcription (STAT) proteins are critical constituents of cytokine-mediated signal transduction (for a review see Ihle, 1996; Heinrich et al., 1998; Shuai, 1999). All seven STAT proteins identified so far are located in the cytoplasm as latent transcription factors. They are recruited via their SH2 domains to phosphotyrosine motifs of activated receptors and subsequently become tyrosine phosphorylated by Janus kinases (JAKs) (Schindler and Darnell, 1995; Darnell, 1997; Heinrich et al., 1998; Shuai, 1999). Phosphorylated STAT proteins dimerize and translocate to the nucleus where they act as transcriptional activators of specific target genes. STAT5 and STAT3 for instance can relay signals from the IL-2 receptor and STAT3 from the IL-6 receptor. Among its many functions, IL-6 is similar to IL-2 in inducing T-cell proliferation that depends on the presence of STAT3 (Akaishi et al., 1998).
The cytokine response and the activation of STATs can also be negatively regulated. Among the known antagonists for STAT function are the suppressor of cytokine signaling (SOCS) proteins also known as JAK binding proteins or STAT-induced STAT inhibitors (Endo et al., 1997; Naka et al., 1997; Starr et al., 1997). While SOCS proteins interact with JAKs and very probably reduce their tyrosine kinase activity, other inhibitors called PIAS (protein inhibitor of activated STAT) bind to activated STAT dimers and block their DNA binding activity (Chung et al., 1997; Liu et al., 1998). The PIAS3 protein has been shown to bind specifically to STAT3 but not to other STATs and to inhibit transactivation of a STAT3-responsive reporter gene (Chung et al., 1997). PIAS3 is a protein of 583 amino acids, has a molecular weight of 68 kDa and belongs to a family of proteins that includes several other members (reviewed in Shuai, 1999).
To gain more insight into the functional details of Gfi-1 and to elucidate a potential role of Gfi-1 in cytokine-mediated signal transduction we set out to identify proteins that interact with Gfi-1. To this end, we have performed a yeast two-hybrid screen and were able to identify PIAS3 as a potential binding partner for Gfi-1. We show that Gfi-1 interacts with PIAS3 and affects its function, as it is able to relieve the inhibitory effect of PIAS3 on STAT3 activity. Our findings implicate Gfi-1 as a novel regulator of cytokine signaling and offer an explanation of both the positive effect of Gfi-1 on cell proliferation and its oncogenic properties.
Results
Gfi-1 interacts with PIAS3 in yeast
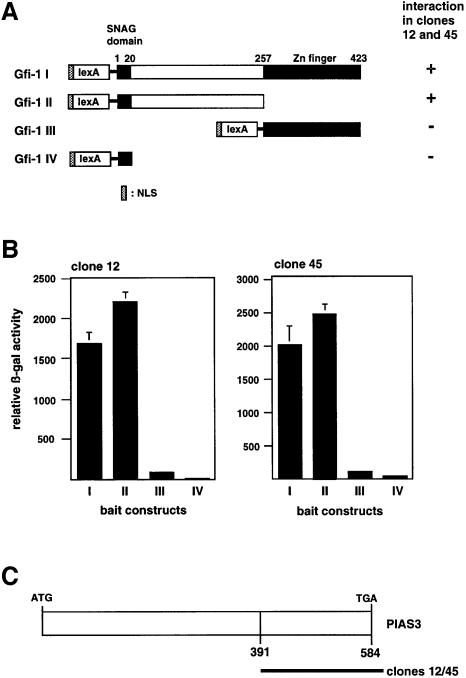
The entire coding region of Gfi-1 fused to the LexA DNA binding domain driven by a Met25 promoter was constructed as bait for a yeast two-hybrid screening. The cDNA expression library that was used had been generated from day 10.5 p.c. murine embryos and contained size-selected inserts of 350–700 nucleotides in length (Hollenberg et al., 1995) fused to the open reading frame encoding the transcriptional transactivation domain of the herpes simplex virus VP16 protein. The screen was performed by plating a total of 1.5 million clones in the presence of 20 mM aminotriazole under histidine selection. The emerging clones were picked and tested for β-galactosidase activity. The library plasmids of β-galactosidase positive clones were isolated and retransfected into yeast together with the LexA–Gfi-1 bait construct or other constructs containing Gfi-1 mutants (Figure 1A). The cDNA inserts of two yeast clones (#12, #45) showed good interaction upon retransfection with Gfi-1 judged on the relative β-galactosidase activity (Figure 1B). Both inserts were found to contain a C-terminal fragment of the PIAS3 starting from amino acid 391 (Figure 1C).
Fig. 1. Yeast two-hybrid screen identifies PIAS3 as a partner protein for Gfi-1. (A) Schematic representation of the LexA–Gfi-1 fusion protein used as the bait in a yeast two-hybrid screening and three LexA–Gfi-1 mutants. Only the full-length Gfi-1 and the N-terminal part spanning amino acids 1–257 were able to interact with the protein fragments expressed by clones 12 and 45, but not the SNAG domain comprising amino acids 1–20 or the zinc finger domain stretching from amino acid 257 to 423. NLS, nuclear localization signal. (B) Quantification of the Gfi-1–PIAS3 interaction by β-galactosidase assay in the yeast clones #12 and #45 (strain L40) transformed with the indicated LexA–Gfi-1 fusion constructs. (C) The sequences contained in the library plasmids of clone #12 and clone #45 were identical and encode the C-terminal part of the PIAS3 protein from amino acid 391 to 583.
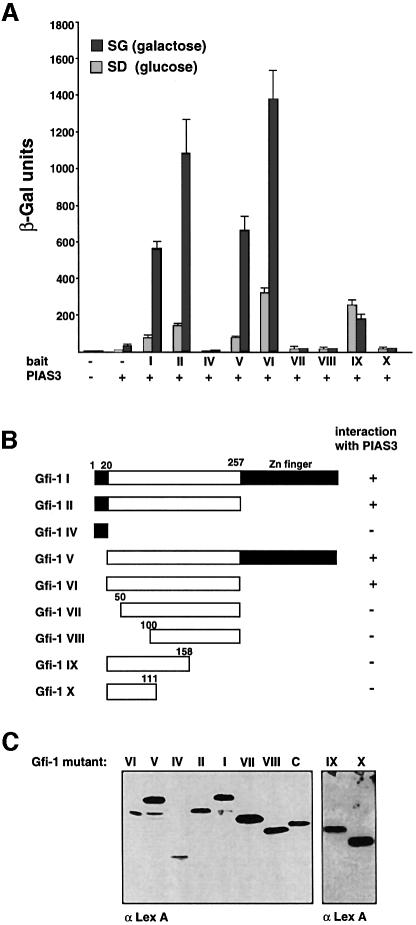
To analyze further the Gfi-1–PIAS3 interaction, we cotransfected the full-length murine PIAS3 cDNA in a galactose-inducible vector together with several LexA–Gfi-1 deletion mutants into the yeast strain L40 and again performed β-galactosidase assays. Western blot analysis of extracts from transformed yeast cells demonstrated that all Gfi-1 mutants were properly expressed (Figure 2C) as well as the full-length PIAS3 cDNA (not shown). In the presence of galactose, only those mutants that contained at least the N-terminal region of Gfi-1 from amino acid 20 to 257 showed interaction with PIAS3 (Figure 2). The zinc finger region alone (Figure 1) or the N-terminal 20 amino acid SNAG domain did not interact with PIAS3 (Figure 2A and B). Any deletion of the region of amino acids 20–257 from either side led to an ablation of the interaction with PIAS3 (Figure 2B, see mutants Gfi-1 VII, VIII, IX and X).
Fig. 2. A large N-terminal region in Gfi-1 is required for interaction with PIAS3. (A) Yeast two-hybrid assay in strain L40 with either a full-length LexA–Gfi-1 bait construct (Gfi-1 I) or the indicated mutants and a galactose-inducible construct encoding the full-length PIAS3 protein as a fusion with the transactivation domain VP16. Interaction depends on the presence of galactose (SG bars) and is only detectable with baits that bear the Gfi-1 region from amino acid 20 to 257. (B) Schematic representation of the Gfi-1 mutants that were expressed in the bait vector as fusions with the LexA DNA binding domain. The mutants that are able to interact with full-length PIAS3 protein are indicated. (C) Expression control of the LexA–Gfi-1 fusion protein and the Gfi-1 mutant baits Gfi-1 II and IV–X. Expression control (lane C) was a LexA fusion with the cytoplasmic domain of CD95. Yeast extracts were separated on SDS–PAGE and transferred on to a solid support by electroblotting. LexA–Gfi-1 proteins and the control protein were detected with an anti-LexA antibody.
PIAS3 and Gfi-1 form complexes in murine and human cells
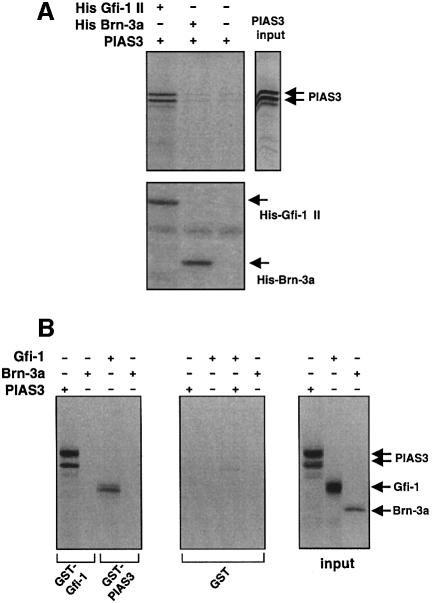
In the next step we wished to test whether PIAS3 and Gfi-1 can form complexes in vitro. To this end, we purified the N-terminal Gfi-1 II fragment comprising amino acids 1–257 as an RGS-histidine-tagged protein in bacteria and have produced radioactively labeled PIAS3 protein in an in vitro transcription–translation system. To demonstrate an association between Gfi-1 and PIAS3, both proteins were incubated at room temperature for 4 h in the presence of magnetic NTA beads that are able to interact with the RGS-histidine tag. Complexes fixed to NTA beads were separated from the suspension by magnetic force, washed and subjected to SDS–PAGE and autoradiography. PIAS3 protein could be pulled down by the NTA matrix only when RGS-histidine-tagged Gfi-1 protein (N-terminal part, i.e. His–Gfi-1 II) was present (Figure 3A). When NTA beads alone or NTA beads coupled to the unrelated histidine-tagged protein Brn-3a (His–Brn-3a, N-terminal amino acids 1–108) were used, PIAS3 could not be pulled down from the mixture (Figure 3A). The input levels of both His–Gfi-1 II and the unrelated His–Brn-3a were monitored and found to be equivalent (Figure 3A, lower panel), indicating an efficient interaction of Gfi-1 and PIAS3 in vitro. Similar results were obtained when in vitro translated Gfi-1 or PIAS3 protein was incubated with full-length glutathione S-transferase (GST)–PIAS3 or GST–Gfi-1 fusion proteins coupled to Sepharose beads, respectively (Figure 3B). Gfi-1 could be precipitated with GST–PIAS3 and, vice versa, PIAS3 protein was able to bind to Sepharose-coupled GST–GFI-1 fusion protein (Figure 3B). The unrelated control protein Brn-3a did not bind to either GST fusion protein. Moreover, GST– Sepharose alone was not able to bind to Gfi-1 or PIAS3 or to the control protein Brn-3a (Figure 3B), demonstrating a strong and specific in vitro interaction between PIAS3 and Gfi-1.
Fig. 3. PIAS3 and Gfi-1 interact in vitro. (A) PIAS3 protein was produced and labeled with [35S]methionine by in vitro transcription–translation (single right lane). The Gfi-1 mutant Gfi-1 II, which comprises the N-terminal region, amino acids 1–257, but lacks the zinc finger region, was produced in bacteria as a histidine-tagged protein (His–Gfi-1 II). As a control the histidine-tagged form of the N-terminal region of the POU factor Brn-3a was used. The 35S-labeled PIAS3 protein could be precipitated by NTA beads from a mixture with His–Gfi-1 II but not from a mixture with the irrelevant protein His–Brn-3a (autoradiograph, upper panel). Both His–Gfi-1 II and His–Brn-3a were produced at equal levels (Coomassie staining, lower panel). (B) SDS–PAGE analysis of Gfi-1, PIAS3 and Brn-3a in vitro translation products directly from the transcription–translation reaction (input, lanes 1–3, right panel) and after incubation of the indicated in vitro translated proteins with GST–Gfi-1- or GST–PIAS3-coupled Sepharose beads (lanes 1–4, left panel). SDS–PAGE analysis after incubation of the indicated in vitro translated proteins with Sepharose beads coupled to GST alone (lanes 1–4, middle panel).
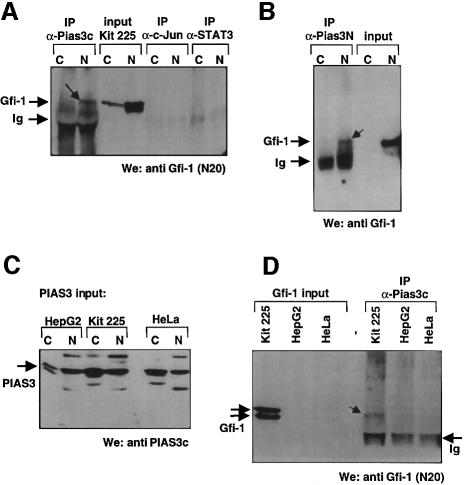
To test whether endogenous PIAS3 and Gfi-1 can interact in eukaryotic cells, we prepared nuclear and cytoplasmic extracts from the human T-cell line KIT 225 where both proteins are naturally expressed and from HepG2 and HeLa cells where only PIAS3 is expressed (see input lanes in Figure 4A–D). With these extracts, we performed immunoprecipitations with the anti-PIAS3c antiserum (Chung et al., 1997) or the anti-PIAS1/3 (Santa Cruz) antibody, which recognize the C- or N-terminus, respectively, of PIAS3 (Figure 4A, B and D). The precipitates were analyzed by SDS–PAGE and western blotting using either the anti-Gfi-1 N20 antibody (Santa Cruz) or affinity-purified anti-Gfi-1 rabbit antibodies (Schmidt et al., 1998). In all sets of experiments, Gfi-1 could be precipitated with antibodies against PIAS3 (Figure 4A, B and D). Irrelevant antibodies that recognize c-Jun or STAT3 were unable to precipitate Gfi-1 (Figure 4A) and extracts from cells without Gfi-1 expression did not produce signals after immunprecipitation with anti-PIAS3 antibodies (Figure 4D), indicating the specificity of the reaction of Gfi-1 with PIAS3.
Fig. 4. Endogenous PIAS3 and Gfi-1 proteins can be coprecipitated from human cells. (A and B) Nuclear and cytoplasmic extracts (see lanes marked N and C) were prepared from human KIT 225 T cells and immunoprecipitations (IP) were performed with anti-PIAS3c (Chung et al., 1997) or anti-PIAS1/3 (α-Pias3N) antibodies (Santa Cruz). To detect Gfi-1 (arrowheads) the precipitates were analyzed by SDS–PAGE and western blotting (We) using either the anti-Gfi-1 N20 antibody (Santa Cruz) or affinity-purified anti-Gfi-1 rabbit antibodies (Schmidt et al., 1998). (C) The expression level of endogenous PIAS3 was determined in nuclear and cytoplasmic extracts (lanes N and C) from human KIT 225 T cells, HepG2 cells and HeLa cells by western blotting using the anti-PIAS3c antibody. (D) Immunoprecipitations were performed with the nuclear extracts from (C) and the anti-PIAS3c antibody. The extracts and the precipitates were analyzed by SDS–PAGE and western blotting (We) using the anti-Gfi-1 N20 antibody. Gfi-1 could be precipitated only from KIT 225 extracts (arrowhead) but not from HepG2 or HeLa cell extracts. All data shown are representative of several independent experiments.
PIAS3 and Gfi-1 colocalize in nuclear dot structures
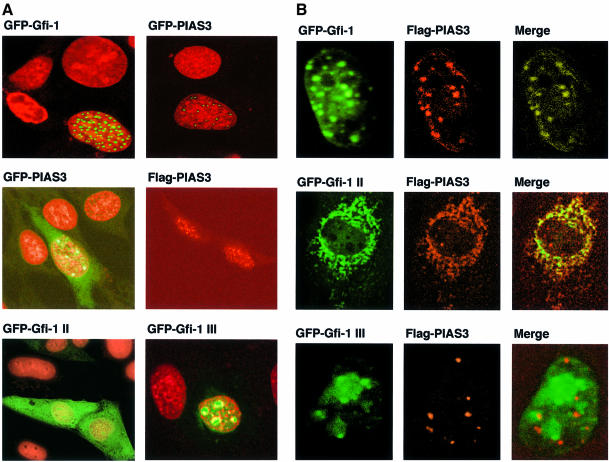
To test the subcellular localization of PIAS3 and Gfi-1 we transfected NIH 3T3 cells with constructs able to direct the expression of fusion proteins between Gfi-1 or PIAS3 and green fluorescent protein (GFP–Gfi-1, GFP–PIAS3). Transiently transfected cells were analyzed by confocal laser scanning microscopy and revealed that both Gfi-1 and PIAS3 reside in the nucleus within dotted structures (Figure 5A). Expression of a Flag-tagged PIAS3 and detection of the protein with an anti-Flag antibody and a TRITC-labeled secondary antibody yielded the same localization of PIAS3 in nuclear dots (Figure 5A). In both GFP–PIAS3 and Flag-tagged PIAS3 transfected cells a slight cytoplasmic staining was observed, indicating that PIAS3 can reside in both compartments (Figure 5A). Next, constructs expressing fusions between GFP and the Gfi-1 mutant proteins Gfi-1 II, which lacks the zinc finger domain, or Gfi-1 III, which contains only the zinc finger region, were transfected in NIH 3T3 cells. As Gfi-1 II lacks the nuclear localization signal, this mutant is now found to be localized perinuclearly and cytoplasmically, whereas Gfi-1 III remained in the nucleus still within nuclear dots (Figure 5A, lower panel).
Fig. 5. Gfi-1 and PIAS3 are detected in nuclear dots. (A) NIH 3T3 cells transfected with GFP constructs were fixed in ethanol 24 h later and stained with propidium iodide. To detect Flag epitope-tagged PIAS3, live cells were treated after transfection with anti-Flag antibody and a TRITC-labeled secondary antibody. All preparations were then analyzed by laser scanning confocal microscopy. GFP–Gfi-1 fusion protein (top left), GFP–PIAS3 (top right and center left) as well as Flag epitope-tagged PIAS3 (center right) localize in the nucleus in a dotted structure. GFP–Gfi-1 II fusion proteins lacking an NLS were found in the cytoplasm (bottom left). The fusion protein between GFP and the Gfi-1 mutant Gfi-1 III (GFP–Gfi-1 III), which consists only of the zinc finger domain, resides in the nucleus still in a dotted structure (bottom right). (B) NIH 3T3 cells were cotransfected with constructs directing expression of Flag-tagged PIAS3 and either GFP–Gfi-1, GFP–Gfi-1 II (N-terminus only) or GFP–Gfi-1 III (zinc finger only) fusion proteins. Confocal microscopy revealed that GFP–Gfi-1 (top row, left) as well as Flag–PIAS3 (top row, middle) are localized in nuclear dots that perfectly overlap when the pictures are merged (top row, right). GFP–Gfi-1 II remains outside the nucleus and prevents the Flag–PIAS3 from entering the nucleus (middle row). Both GFP–Gfi-1 II and Flag–PIAS3 are perfectly colocalized outside the nucleus when both pictures are merged (middle row, right). GFP–Gfi-1 III (bottom row, left) and Flag–PIAS3 (bottom row, middle) enter the nucleus when the appropriate constructs are cotransfected, but do not colocalize (note red and green dots in bottom row, right) because the N-terminal interaction domain is lacking in GFP–Gfi-1 III.
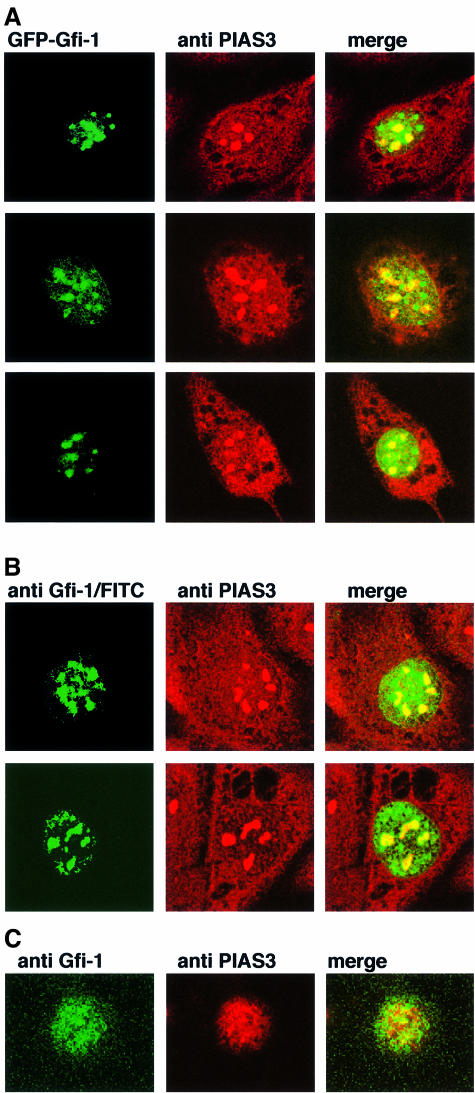
When GFP–Gfi-1 and Flag–PIAS3 were co-expressed in NIH 3T3 cells, we observed that both proteins colocalize in nuclear dot structures (Figure 5B, top row). In contrast, co-expression of Flag–PIAS3 with the GFP–Gfi-1 II mutant apparently led to an accumulation of Gfi-1 II–PIAS3 complexes in the perinuclear region, indicating that this Gfi-1 mutant interacts with PIAS3 and is able to exclude it from the nucleus (Figure 5B, middle row). When only the zinc finger domain of Gfi-1 is co-expressed with PIAS3 (mutant Gfi-1 III), both proteins are found in nuclear dot structures but no longer colocalize, very probably because the N-terminal region responsible for the interaction with PIAS3 is deleted in Gfi-1 III (Figure 5B, bottom row). Immunostaining of untransfected NIH 3T3 cells with anti-PIAS3c antibodies confirmed that the endogenous PIAS3 protein resides in nuclear dots as well as in the cytoplasm (Figure 6A and B). Transfected GFP-tagged Gfi-1 or untagged Gfi-1 detected with anti-Gfi-1 N20 and a specific FITC-labeled secondary antibody colocalizes with PIAS3 in these nuclear dots (Figure 6A and B). In addition, immunostaining of KIT 225 T cells in which Gfi-1 and PIAS3 are endogenously expressed with antibodies against both proteins and specific secondary antibodies also demonstrated their colocalization (Figure 6C). Whereas the merged pictures of Gfi-1 and PIAS3 clearly show colocalization of both proteins as yellow-stained areas (Figure 6A–C) it is also evident that areas in the nuclei exist where both PIAS3 and Gfi-1 are not bound to each other (Figure 6A–C). This suggests that not all PIAS3 and Gfi-1 molecules in a cell form complexes, pointing to additional, separate functions of these proteins.
Fig. 6. Endogenous PIAS3 and transfected Gfi-1 colocalize in nuclear dots. (A) NIH 3T3 cells were transfected with GFP–Gfi-1 constructs, immunostained with anti-PIAS3c antibodies and a TRITC-labeled secondary antibody and analyzed by confocal microscopy. Shown are three independent sets of cells where the endogenous PIAS3 is found in nuclear dots and in the cytoplasm (red panels). GFP–Gfi-1 forms nuclear dots (green panels) and partly colocalizes with PIAS3 within the nuclear dots (see merged pictures, right). (B) As in (A) but instead of GFP–Gfi-1 a LTR–Gfi-1 construct was transfected that directs expression of an untagged Gfi-1 protein. Gfi-1 is detected by immunostaining with anti-Gfi-1 antibodies and a specific FITC-labeled secondary antibody (green panels). As demonstrated in (A), the endogenous PIAS3 (red panels) and the transfected Gfi-1 colocalize in nuclear dots (merged pictures, yellow areas) but regions are seen in which both proteins appear separate (merged pictures, green and red areas). (C) KIT 225 cells were immunostained with both anti-Gfi-1 and anti-PIAS3 antibodies and specific secondary antibodies labeled with FITC to detect Gfi-1 (green, left panel) or with TRITC to detect PIAS3 (red, middle panel). The merge of both pictures (right panel) demonstrates colocalization of both endogenous Gfi-1 and PIAS3 in KIT 225 cells (merged picture, yellow areas) but also reveals areas where both proteins do not form a complex.
Gfi-1 activates IL-6/STAT3-mediated transcription
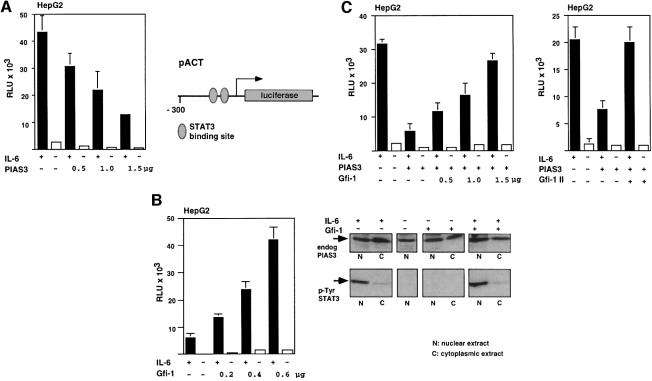
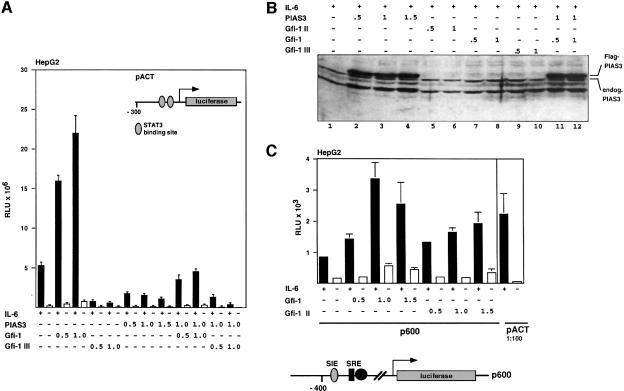
In the next step we performed reporter gene assays using a construct in which the expression of the luciferase gene depends on the promoter of the α1-antichymotrypsin gene (pACT), which is regulated by STAT3 (Kordula et al., 1998). This promoter contains two STAT3 binding sites (Figure 7A, right panel) and can be efficiently activated in HepG2 cells by transfection with a STAT3 expression construct and treatment with IL-6 (Figure 7A), which leads specifically to the activation of STAT3 through tyrosine phosphorylation (Figure 7B, right panel). Cotransfection of PIAS3 expression constructs leads to a reduction of STAT3/IL-6-mediated pACT transcription in a concentration-dependent manner, confirming earlier reports (Figure 7A and Chung et al., 1997). In contrast, activation of the pACT reporter can be significantly enhanced ∼5-fold by cotransfection of a Gfi-1 expression construct (Figure 7B). Moreover, this enhanced activation of pACT depends on the amount of Gfi-1 expression vector transfected and suggests that Gfi-1 positively affects STAT3-mediated transcriptional activation. Furthermore, the inhibition of pACT transcription by PIAS3 can be relieved by cotransfecting Gfi-1 expression constructs also in a concentration-dependent manner (Figure 7C). This relief of the PIAS3 block concurs with an unchanged expression level of the endogenous PIAS3 (Figure 7B, right panel, see also Figure 8B). It can also be achieved with a Gfi-1 expression construct lacking the zinc finger region (Gfi-1 II mutant, Figure 7C, right panel) and it is detected in the presence of IL-6 (Figure 7C). However, the Gfi-1 III mutant, which contains only the six zinc finger domains and is unable to interact with PIAS3, is ineffective in stimulating transcription from the pACT reporter gene in the absence or presence of exogenous PIAS3 (Figure 8A). Whole cell extracts from the transfections were prepared and analyzed for the expression level of endogenous and exogenous PIAS3, which can be detected and distinguished by anti-PIAS3 antibodies or anti-Flag antibodies, respectively, in an immunoblot. Neither the level of endogenous PIAS3 nor the amount of exogenous Flag-tagged PIAS3 was altered by co-expression of Gfi-1 (Figure 8B). Gfi-1 was also able to enhance STAT3-mediated transactivation of the c-fos promoter (Hill and Treisman, 1995; Leaman et al., 1996), which contains a STAT3 binding site within the sis-inducible element (SIE, Figure 8C). The transcription from this reporter gene was less efficient upon IL-6 stimulation compared with pACT but still demonstrated that Gfi-1 and the Gfi-1 II mutant were able to enhance STAT3-dependent transcription (Figure 8C), confirming the findings with the pACT reporter.
Fig. 7. Gfi-1 relieves STAT3-mediated transcriptional transactivation from PIAS3 block. (A) HepG2 cells were transfected with the pACT reporter, a STAT3 construct and the indicated amounts of CMV–PIAS3. The structure of the α1-antichymotrypsin promoter with the two STAT3 binding sites is given in the right panel. In the presence of STAT3 and IL-6, the pACT reporter could be activated ∼15-fold (black bars) compared with values obtained without IL-6 (open bars) and this stimulation could be inhibited by cotransfection of CMV–PIAS3 in a concentration-dependent manner. (B) Left panel: cotransfection of HepG2 cells with pACT, a STAT3 construct and a Gfi-1 expression construct (LTR–Gfi-1, amounts as indicated). Gfi-1 can further stimulate pACT transcription up to ∼6-fold in a concentration-dependent manner in the presence of IL-6 (black bars). Right panel: nuclear (N) and cytoplasmic (C) extracts were prepared from HepG2 cells that had been transfected with LTR–Gfi-1 or had been treated with IL-6 as indicated. The extracts were analyzed by SDS–PAGE and immunoblotting with anti-PIAS3 antibodies or antibodies that exclusively recognize STAT3 when phosphorylated on tyrosine 705. (C) Left panel: HepG2 cells were transfected with pACT, STAT3 and PIAS3 expression constructs and treated with IL-6. A marked repression of pACT reporter gene transcription is observed as in (B). This repression can be almost entirely relieved by co-expression of a Gfi-1 expression construct (LTR–Gfi-1) in a concentration-dependent manner. Right panel: a similar relief of pACT transcription could be reached in the presence of IL-6 with a construct expressing the Gfi-1 mutant Gfi-1 II, which lacks the zinc finger region but still interacts with PIAS3.
Fig. 8. Gfi-1 regulates pACT and p600 c-fos promoters. (A) In comparison with full-length Gfi-1, the mutant Gfi-1 III, which contains only the zinc finger region, is unable to stimulate pACT transcription effectively in the presence of IL-6, regardless of whether a high exogenous PIAS3 level is reached by transfection or only the endogenous PIAS3 is present. Conditions of the experiment are as described for Figure 7. Numbers indicate the amount of plasmid transfected in µg. (B) Expression level of endogenous PIAS3 and transfected Flag-tagged PIAS3 is unaltered by co-expression of Gfi-1, Gfi-1 II or Gfi-1 III. PIAS3 protein is detected by immunoblotting with the anti-PIAS3c antibody in whole cell extracts of HepG2 cells that have been treated as indicated. (C) Gfi-1 can enhance IL-6/STAT3-mediated transcription of the c-fos promoter. Transcription of a reporter gene construct in which a 600 bp fragment of the c-fos promoter drives the luciferase gene can be stimulated in HepG2 cells with IL-6 ∼2.5-fold compared with values without IL-6. Cotransfection of constructs directing expression of Gfi-1 or Gfi-1 II lead to further stimulation of c-Fos reporter activity. SRE, serum response element; SIE, STAT-inducible element.
Gfi-1 increases the sensitivity of primary T cells towards IL-6
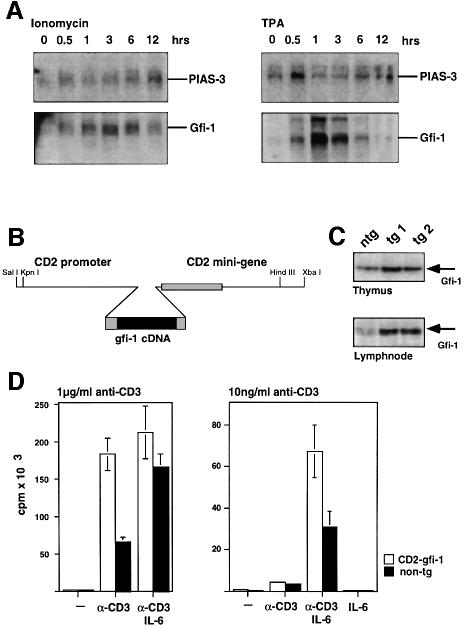
Gfi-1 expression is strongly upregulated in T cells within 30 min of ionomycin or TPA stimulation whereas PIAS3 expression was found to be less affected by the same treatment (Figure 9A). As it had been shown previously that STAT3 can be responsible for the IL-6-dependent T-cell proliferation in response to antigenic stimulation (Takeda et al., 1998) we wished to investigate whether a high level expression of Gfi-1 could enhance IL-6/STAT3-dependent T-cell activation in vivo. To this end, we generated transgenic mice that express Gfi-1 constitutively under the control of the CD2 locus control region in peripheral, resting T cells (Figure 9B). Two different transgenic lines were established that showed similarly elevated levels of Gfi-1 transgene expression compared with non-transgenic controls (Figure 9C). Both transgenic lines behaved similarly in a number of experiments, which are described in detail elsewhere (Karsunky and Möröy, in preparation).
Fig. 9. Gfi-1 can enhance IL-6-dependent T-cell proliferation upon antigenic stimulation. (A) RNA expression levels of endogenous PIAS3 and Gfi-1 genes detected by northern blotting in extracts from isolated primary murine T cells after stimulation as indicated over time. (B) Schematic representation of the construct used to generate CD2–Gfi-1 transgenic mice. (C) Gfi-1 protein levels were analyzed by western blotting in extracts from thymocytes and T cells isolated from lymph nodes of animals representing the CD2–Gfi-1 transgenic lines tg1 and tg2. Extracts from non-transgenic age matched littermates (ntg) served as controls. (D) Peripheral T cells were prepared from either non-transgenic control mice (black bars) or CD2–Gfi-1 transgenic mice (open bars) and cultured under the conditions indicated. The cells were cultivated for 72 h and pulsed with [3H]thymidine for the last 12 h. The uptake of [3H]thymidine was measured and is given on the y-axis. All measurements were taken in triplicate. Given are average values with standard deviations representative of several independent experiments.
To test a functional interdependence of STAT3 and Gfi-1, purified T cells from CD2–Gfi-1 transgenic animals or from wild-type age-matched littermate controls were treated with anti-CD3 antibodies or with a combination of anti-CD3 antibodies and IL-6 to mimic antigenic stimulation. Using a high concentration (1 µg/ml) of anti-CD3 antibody, T cells from CD2–Gfi-1 transgenic mice showed increased activation measured by [3H]thymidine uptake as compared with non-transgenics (Figure 9D, left panel). In the presence of IL-6, this activation was further enhanced but cells from CD2–Gfi-1 transgenics and non-transgenics did not show a marked difference (Figure 9D, left panel). In contrast, the situation is different when low concentrations (10 ng/ml) of anti-CD3 antibodies are used that mimic a weak antigenic stimulus (Figure 9D, right panel). Under these conditions, T cells from CD2–Gfi-1 transgenic mice show a significantly enhanced response towards IL-6 compared with non-transgenic T cells (Figure 9D, right panel).
Discussion
Influence of Gfi-1 on STAT3 signaling
In this study we present experimental evidence that supports the hypothesis of a biochemical and functional interaction between the STAT3 inhibitory protein PIAS3 and the zinc finger protein Gfi-1 implicating Gfi-1 as a new regulatory factor in STAT3-mediated signal transduction. The physical interaction of the two proteins was evident through several independent experimental approaches suggesting that the formation of a complex that contains PIAS3 and Gfi-1 is of physiological significance. The finding that Gfi-1 can intensify STAT3-dependent transcriptional activation by sequestering PIAS3 adds further support to our hypothesis. The effect of Gfi-1 on STAT3 reporter gene transcription was measured in HepG2 cells and was apparent in the presence of IL-6, which demonstrates the specificity of the observed effect of Gfi-1 because IL-6 relays signals through the IL-6 receptor and the activation of Jak1/2 and Tyk2, which in turn phosphorylates and activates STAT3 (reviewed in Heinrich et al., 1998).
The observed enhancement of STAT3 reporter gene activity is independent of the DNA binding domain of Gfi-1 and can also be achieved with the Gfi-1 mutant Gfi-1 II, which lacks the zinc finger region, but not with the mutant Gfi-1 III, which contains only the zinc finger region. This finding excludes the possibility that the enhancement of STAT3 signaling observed in the presence of Gfi-1 is mediated by a transcriptional regulation of endogenous or transfected genes by Gfi-1. Moreover, it indicates that the enhancement of STAT3 signaling is mediated directly by Gfi-1 through its interaction with PIAS3. In addition, biochemical analysis excluded any influence of Gfi-1 on the endogenous expression level of PIAS3. The role of the zinc finger region that is conserved among Gfi-1 family members remains open. It has been shown that this region contains a nuclear localization signal and that it can bind specifically to an in vitro selected DNA sequence (Grimes et al., 1996; Zweidler-McKay et al., 1996). However, the zinc finger domain alone can still be found in nuclear dots albeit not at the same locations as PIAS3. It may be crucial in recruiting other proteins that take part in STAT3-dependent transcriptional regulation or for the correct positioning of Gfi-1 within the nuclear matrix.
PIAS3 binds to activated, tyrosine phosphorylated STAT3 dimers and prevents DNA binding of the complex (Chung et al., 1997). How this is achieved by PIAS3 is not known. It is possible that PIAS3 either induces a conformational change in the activated STAT3 dimer or recruits another protein to the PIAS3–STAT3 complex that leads to the abrogation of DNA binding. The exact mechanism by which the interaction between Gfi-1 and PIAS3 can lead to a re-activation of STAT3 also remains to be resolved. In vitro electrophoretic mobility shift assays did not reveal any influence of Gfi-1 on the DNA binding of STAT3 or the lack of binding of the STAT3–PIAS3 complex (K.Tavassoli and T.Möröy, unpublished data). It is therefore likely that other proteins have to be recruited in vivo to STAT3, possibly via Gfi-1, that reinstall STAT3 DNA binding and antagonize the effect of PIAS3. A simple competition between Gfi-1 and STAT3 for PIAS3 is also possible or, alternatively, Gfi-1 acts before PIAS3 can bind to STAT3 and renders PIAS3 unavailable for STAT3 inhibition. The question remains to be answered whether Gfi-1 contacts DNA during interaction with PIAS3. Our experiments have shown that a STAT3 reporter gene can still be activated by a Gfi-1 mutant that lacks the zinc finger domain and hence is unable to contact DNA. This suggests that an interaction with PIAS3 alone may suffice to abrogate its inhibitory activity but other possibilities may exist in vivo. One attractive hypothesis is that only those STAT3 target genes that also harbour a Gfi-1 recognition site close to the STAT3 binding region might be activated by Gfi-1 but further experiments have to demonstrate whether this is indeed the case.
Gfi-1 as a regulator of cytokine signaling?
Signaling initiated by IL-2 is mediated mainly through the activation of STAT5 (Gaffen et al., 1995; Gilmour et al., 1995; Morrigl et al., 1999) but also to a certain extent through STAT3 (Nielsen et al., 1994; Frank et al., 1995; Ng and Cantrell, 1997; Gerwien et al., 1999). In this respect, the effect of Gfi-1 to act as an enhancer of signals transduced by STAT3 could offer an explanation for the ability of Gfi-1 to confer partial IL-2 independence to T-cell lines that depend on this cytokine for proliferation (Gilks et al., 1993; Grimes et al., 1996; Zörnig et al., 1996). In addition to signals transduced by IL-2 and the IL-2 receptor, a number of findings implicate also IL-6 in T-cell proliferation. Studies with genetically altered mice that lack STAT3 specifically in the T-lymphoid lineage have shown that IL-6-mediated signaling through STAT3 is necessary for the proliferation of T cells upon antigenic stimulation by a STAT3-mediated prevention of apoptosis (Takeda et al., 1998). Here we find that Gfi-1 can render primary, resting T cells more sensitive to IL-6 upon a weak antigenic stimulus. This suggests that Gfi-1 has an important role in STAT3/IL-6-dependent processes in vivo, in particular in antigenic stimulation of T-cell proliferation. However, our finding that Gfi-1 when overexpressed as a transgene can already accelerate entry of resting T cells into the S phase upon antigenic stimulation in the absence of IL-6 also suggests that Gfi-1 has other functions, which are independent of STAT3.
Gfi-1 and STAT3 in oncogenesis
STAT factors have been suspected to play a role in malignant transformation since they are involved in the regulation of cellular growth and differentiation. A number of tumor cell lines and cells from primary tumor samples display constitutively activated STAT proteins, in particular STAT3 (Garcia and Jove, 1998). The most prominent examples are multiple myelomas and head and neck cancer (Grandis et al., 1998; Catlett-Falcone et al., 1999). Recently, a mutant STAT3 protein that was rendered constitutively active through the introduction of cysteines was shown to be oncogenic in immortalized fibroblasts. Cells transformed by these mutant STAT3 proteins were clearly malignant according to such criteria as anchorage-independent growth and the formation of tumors in vivo (Bromberg et al., 1999). The oncogenic properties of constitutively active STAT3 immediately offers an explanation for the ability of Gfi-1 to predispose mice for the development of malignant lymphomas when overexpressed and for its mode of action as a proviral target of MoMuLV (Schmidt et al., 1996, 1998; Zörnig et al., 1996). As all the data shown here support a role of Gfi-1 as a positive regulatory factor of STAT3 activity, it is conceivable that the oncogenic potential of Gfi-1 is at least in part mediated by an enhancement of STAT3-triggered events. Previous experiments with MoMuLV-infected mice or with transgenic mice that constitutively express Gfi-1 in the T-cell compartment suggested that Gfi-1 rather promotes but does not initiate lymphoma development. One reason for this is the fact that Gfi-1 requires additional cooperating oncoproteins such as Pim-1 or Myc for efficient tumor predisposition (Schmidt et al., 1996, 1998; Zörnig et al., 1996; Scheijen et al., 1997). In this respect, the ability of Gfi-1 to enhance and possibly prolong the effects of cytokines, as for example the IL-6 response, is in agreement with this view and further establishes Gfi-1 in the regulation of factor-dependent cell growth and proliferation.
Materials and methods
Yeast two-hybrid assay
The expression library was made with randomly primed, size selected cDNA fragments derived from 9.5–10.5 day old mouse embryo RNA. The cDNA fragments were amplified by PCR and inserted into the pVP16 vector (Hollenberg et al., 1995). For the screening of this cDNA library by histidine selection in yeast the Li-acetate transfection method was used. LexA bait fusion constructs and the library plasmid were introduced into the strain L40 and clones were selected for growth on histidine-deficient plates containing 25–50 mM aminotriazole and for β-galactosidase production. Interactions were confirmed by retransfecting isolated library plasmids into yeast cells containing the LexA bait fusion vector and testing the β-galactosidase activity in a liquid assay.
β-galactosidase assay
Yeast cells were grown to an OD600 of 0.4–0.5, pelleted and resuspended in 1.2 ml of buffer Z (60 mM Na2HPO4, 40 mM NaH2PO4, 10 mM KCl, 1 mM MgSO4, 50 mM 2-mercaptoethanol pH 7.0). From this suspension, 100–150 µl (VE) were diluted to 1 ml with buffer Z and cells were lysed with chloroform–SDS. The mixture was equilibrated at 30°C for a few minutes and the reaction was started by adding 200 µl of ONPG (4 mg/ml o-nitrophenol galactose in 0.1 M K2PO4 pH 7.0). After a defined reaction period (tR, e.g. 2–3 h) the reaction was stopped by the addition of 500 µl of 1 M Na2CO3. The reaction was cleared of insoluble material by centrifugation and the OD was measured at 420 nm and at 550 nm. The β-galactosidase activity (A) was calculated in units by the following equation:
A = 1000 × OD420 – 1750 × OD550/OD600 × VE × tR
Transient transfections, reporter gene assays and immunofluorescence
For immunofluorescence studies and the detection of GFP fusion proteins, NIH 3T3 cells were seeded in 6 cm plates (1 × 10⁵ cells/plate) on glass coverslips and transfected 24 h later in medium containing 0.5% fetal calf serum (FCS) with 2–10 µg of the respective plasmids by the calcium phosphate method. Cells were refed with fresh medium containing 10% FCS 16 h after transfection. The cells were harvested 24–48 h later in cold phosphate-buffered saline (PBS), fixed with methanol, again washed with PBS and with IF buffer [10 mM Tris pH 7.5, 300 mM NaCl, 0.05% (v/v) Tween 20]. In the next step, cells were blocked for 30 min in 1% bovine serum albumin (BSA) in IF buffer, incubated with primary antibody for 1 h, washed twice with IF buffer, again incubated with secondary antibody and after washing with IF buffer mounted on slides with aquamount (BDH Laboratories). Where indicated cell nuclei were stained with propidium iodide or DAPI. Reporter gene assays were carried out as described previously (Haas et al., 1997).
Generation and manipulation of proteins
In vitro translation was performed in a single step transcription– translation system using the TNT-coupled reticulocyte lysate (Promega) according to the supplier’s information. The reaction contained 1 µg of plasmid DNA and 40 µCi of 35S-labeled methionine in a total volume of 50 µl. His fusion proteins were prepared using the vector from the pQE series and following the manufacturer’s instructions. To generate GST fusion proteins, the appropriate DNA fragments were subcloned into the bacterial expression vector pGEX-4T2 and expressed under isopropyl-β-d-thiogalactopyranoside induction. The fusion protein was isolated via affinity chromatography using glutathione-coupled Sepharose beads according to the supplier’s instructions. The eluates from Sepharose beads showed one single band on SDS–PAGE analysis and Coomassie staining, indicating successful purification. For the analysis of protein–protein interactions 0.5 µg of GST fusion protein or as a control 3 µg of GST protein was incubated with 2.5 µl of an in vitro translation reaction in 200 µl of binding buffer [50 mM Tris–HCl pH 8.0, 120 mM NaCl, 1 mM dithiothreitol (DTT), 0.5% v/v NP-40] for 1 h at 4°C. Glutathione–Sepharose beads were washed several times in binding buffer and were added to the binding reaction, which was then further incubated for 30 min at 4°C. The beads were spun down and washed five times in binding buffer containing 0.5 M NaCl. Bound proteins were eluted from the beads by incubation with SDS sample buffer and were analyzed via SDS–PAGE.
Immunoprecipitation
For immunoprecipitation the lysate volume equivalent to 100 µg of protein was dissolved in 1 ml of Dignam D buffer (20 mM HEPES pH 7.9, 20% glycerol, 0.1% NP-40, 75 mM NaCl, 100 mM KCl, 0.2 mM EDTA, 3% BSA) and precleared with 40 µl of a pre-equilibrated protein A–Sepharose slurry for 30 min. The supernatant was then incubated with 0.2 mg of the respective antibody for 30 min and 30 µl of a pre-equilibrated 50% (v/v) protein A–Sepharose slurry for another 90 min. The Sepharose beads were sedimented and washed three times with incubation buffer (20 mM HEPES pH 7.9, 75 mM KCl, 2.5 mM MgCl2, 1 mM DTT, 0.1% NP-40, 0.5 mM phenylmethylsulfonyl fluoride, 1 µg/ml aprotinin, 1 µg/ml pepstatin A, 1 µg/ml leupeptin, 1 mM Na3VO4) and resuspended in 4 × SDS–gel loading buffer [62 mM Tris pH 6.8, 2% (w/v) SDS, 10% (v/v) glycerol, 5% (v/v) 2-mercaptoethanol, 0.005% (w/v) bromphenol blue]. All the incubations mentioned above were carried out at 4°C and with constant movement using a head-over-tail rotator.
T-cell proliferation assay
Thymocytes and splenic T cells were prepared as described previously (Möröy et al., 1993; Zörnig et al., 1995). For [3H]thymidine incorporation assay 1 × 10⁵ thymocytes or 5 × 10⁴ purified splenic T cells were cultured in 96-well plates (Nunc) in RPMI1640 supplemented with 10% FBS, l-glutamine, penicillin G, streptomycin and 2-mercaptoethanol in the presence of the indicated amounts of anti-CD3 antibody (2C11, Pharmingen) or a combination of anti-CD3 antibody and recombinant human IL-6 (10 ng/ml; Strathmann Biotech) for 72 h. For the last 8 h 0.5 mCi of [3H]thymidine were added as a single pulse. After harvesting the cells, the amount of incorporated [3H]thymidine in DNA was measured using a β-scintillation counter (Wallac).
Generation of transgenic mice
A schematic representation of the construct used to generate CD2–Gfi-1 transgenic mice is given in Figure 9. The construct was obtained by inserting a 2 kb HincII fragment containing the murine gfi-1 cDNA (Zörnig et al., 1996) into the CD2 vector, which contained the CD2 promoter and the CD2 minigene (Zhumabekov et al., 1995) in bluescript. The construct was freed from backbone sequences, purified and injected into fertilized mouse oocytes essentially as described (Hogan et al., 1994). The fertilized mouse oocytes were derived from matings between (C57Bl/6 × C3H) F1 mice. Successful integration of the injected DNA was monitored by Southern analysis of tail-tip DNA as described (Hogan et al., 1994). All transgenic mouse lines were maintained by breeding the founders with inbred C57Bl/6 animals.
Acknowledgments
Acknowledgements
The authors thank J.E.Darnell and T.Hirano for STAT3 expression plasmids. This work was supported by the Deutsche Forschungsgemeinschaft (grant Mo 435/9-1, 9-3), the Fonds der chemischen Industrie, by the European Community Framework 5 Program and the IFORES Program of the University of Essen Medical School.
References
- Akaishi H., Takeda,K., Kaisho,T., Shineha,R., Satomi,S., Takeda,J. and Akira,S. (1998) Defective IL-2-mediated IL-2 receptor α chain expression in Stat3-deficient T lymphocytes. Int. Immunol., 10, 1747–1751. [DOI] [PubMed] [Google Scholar]
- Bromberg J.F., Wrzeszczynska,M.H., Devgan,G., Zhao,Y., Pestell,R.G., Albanese,C. and Darnell,J.E. (1999) Stat3 as an oncogene. Cell, 98, 295–303. [DOI] [PubMed] [Google Scholar]
- Catlett-Falcone R. et al. (1999) Constitutive activation of STAT3 signaling confers resistance to apoptosis in human U266 myeloma cells. Immunity, 10, 105–115. [DOI] [PubMed] [Google Scholar]
- Chung C.D., Liao,J., Liu,B., Rao,X., Jay,P., Berta,P. and Shuai,K. (1997) Specific inhibition of Stat3 signal transduction by PIAS3. Science, 278, 1803–1805. [DOI] [PubMed] [Google Scholar]
- Darnell J.E. (1997) STATs and gene regulation. Science, 277, 1630–1635. [DOI] [PubMed] [Google Scholar]
- Endo T.A. et al. (1997) A new protein containing an SH2 domain that inhibits JAK kinases. Nature, 387, 921–924. [DOI] [PubMed] [Google Scholar]
- Frank D.A., Robertson,M.J., Bonni,A., Ritz,J. and Greenberg,M. (1995) Interleukin 2 signaling involves the phosphorylation of Stat proteins. Proc. Natl Acad. Sci. USA, 92, 7779–7783. [DOI] [PMC free article] [PubMed] [Google Scholar]
- Fuchs B., Wagner,T., Rössel,N., Antoine,M., Beug,H. and Niessing,J. (1997) Structure and erythroid cell-restricted expression of a chicken cDNA encoding a novel zinc finger protein of the Cys + His class. Gene, 195, 277–284. [DOI] [PubMed] [Google Scholar]
- Gaffen S.L., Lai,S.Y., Xu,W., Gouilleux,F., Groner,B., Goldsmith,M.A. and Greene,W.C. (1995) Signaling through the interleukin 2 receptor β chain activates an STAT-5-like DNA-binding activity. Proc. Natl Acad. Sci. USA, 92, 7192–7196. [DOI] [PMC free article] [PubMed] [Google Scholar]
- Garcia R. and Jove,R. (1998) Activation of STAT transcription factors in oncogenic tyrosine kinase signaling. J. Biomed. Sci., 5, 79–85. [DOI] [PubMed] [Google Scholar]
- Gerwien J., Nielsen,M., Labuda,T., Nissen,M.H., Svejgaard,A., Geisler,C., Röpke,C. and Odum,N. (1999) Cutting edge: TCR stimulation by antibody and bacterial superantigen induces Stat3 activation in human T cells. J. Immunol., 163, 1742–1745. [PubMed] [Google Scholar]
- Gilks C.B., Bear,S.E, Grimes,H.L. and Tsichlis,P.N. (1993) Progression of interleukin-2 (IL-2)-dependent rat T cell lymphoma lines to IL-2-independent growth following activation of a gene (Gfi-1) encoding a novel zinc finger protein. Mol. Cell. Biol., 13, 1759–1768. [DOI] [PMC free article] [PubMed] [Google Scholar]
- Gilmour K., Pine,R. and Reich,N.C. (1995) Interleukin 2 activates STAT5 transcription factor (mammary gland factor) and specific gene expression in T lymphocytes. Proc. Natl Acad. Sci. USA, 92, 10772–10776. [DOI] [PMC free article] [PubMed] [Google Scholar]
- Grandis J.R., Drenning,S.D., Chakraborty,A., Zhou,M.Y., Zeng,Q., Pitt,A.S. and Tweardy,D.J. (1998) Requirement of STAT3 but not STAT1 activation for epidermal growth factor receptor mediated cell growth in vitro. J. Clin. Invest., 102, 1385–1392. [DOI] [PMC free article] [PubMed] [Google Scholar]
- Grimes H.L., Chan,T.O., Zweidler-McKay,P.A., Tong,B. and Tsichlis,P.N. (1996) The Gfi-1 proto-oncoprotein contains a novel transcriptional repressor domain, SNAG and inhibits G1 arrest induced by interleukin-2 withdrawal. Mol. Cell. Biol., 16, 6263–6272. [DOI] [PMC free article] [PubMed] [Google Scholar]
- Haas K., Staller,P., Geisen,C., Bartek,J., Eilers,M. and Möröy,T. (1997) Mutual requirement of CDK4 and Myc in malignant transformation: evidence for cyclin D1/CDK4 and p16INK4A as upstream regulators of Myc. Oncogene, 15, 179–192. [DOI] [PubMed] [Google Scholar]
- Heinrich P.C., Behrmann,I., Müller-Newen,G., Schaper,F. and Graeve,L. (1998) Interleukin-6-type cytokine signalling throug the gp130/Jak/STAT pathway. Biochem. J., 334, 297–314. [DOI] [PMC free article] [PubMed] [Google Scholar]
- Hill C.C. and Treisman,R. (1995) Differential activation of c-fos promoter elements by serum, lysophosphatidic acid, G proteins and polypeptide growth factors. EMBO J., 14, 5037–5047. [DOI] [PMC free article] [PubMed] [Google Scholar]
- Hogan B., Beddington,R., Costantini,F. and Lacy,E. (1994) Manipulating the Mouse Embryo. Cold Spring Harbor Laboratory Press, Cold Spring Harbor, NY. [Google Scholar]
- Hollenberg S.M., Sternglanz,R., Cheng,P.F. and Weintraub,H. (1995) Identification of a new family of tissue specific helix–loop–helix proteins with a two hybrid system. Mol. Cell. Biol., 15, 3813–3822. [DOI] [PMC free article] [PubMed] [Google Scholar]
- Ihle J.N. (1996) STATs: signal transducers and activators of transcription. Cell, 84, 331–334. [DOI] [PubMed] [Google Scholar]
- Kordula T., Ryde.,R.E., Brigham,E.F., Horn,F., Heinrich,P.C. and Travis,J. (1998) Oncostatin M and the interleukin-6 and soluble interleukin-6 receptor complex regulate α1-antichymotrypsin expression in human cortical astrocytes. J. Biol. Chem. 273, 4112–4118. [DOI] [PubMed] [Google Scholar]
- Leaman D.W., Pisharody,S., Flickinger,T.W., Commane,M.A., Schlessinger,J., Kerr,I.M., Levy,D.E. and Stark,G.R. (1996). Roles of JAKs in activation of STATs and stimulation of c-fos gene expression by epidermal growth factor. Mol. Cell. Biol., 16, 369–375. [DOI] [PMC free article] [PubMed] [Google Scholar]
- Liu B., Liao,J., Rao,X., Kushner,S.A., Chung,C.D., Chang,D.D. and Shuai,K. (1998) Inhibition of Stat 1-mediated gene activation by PIAS 1. Proc. Natl Acad. Sci. USA, 95, 10626–10631. [DOI] [PMC free article] [PubMed] [Google Scholar]
- Moriggl R. et al. (1999) Stat5 is required for IL-2-induced cell cycle progression of peripheral T cells. Immunity, 10, 249–259. [DOI] [PubMed] [Google Scholar]
- Möröy T., Grzeschiczek,A., Petzold,S. and Hartmann,K.U. (1993) Expression of a pim-1 transgene accelerates lymphoproliferation and inhibits apoptosis in lpr/lpr mice. Proc. Natl Acad. Sci. USA, 90, 10734–10738. [DOI] [PMC free article] [PubMed] [Google Scholar]
- Naka T. et al. (1997) Structure and function of a new STAT-induced STAT inhibitor. Nature, 387, 924–929. [DOI] [PubMed] [Google Scholar]
- Ng J. and Cantrell,D. (1997) STAT3 is a serine kinase target in T lymphocytes. Interleukin 2 and T cell antigen receptor signals converge upon serine 727. J. Biol. Chem., 272, 24542–24549. [DOI] [PubMed] [Google Scholar]
- Nielsen M., Sveijgaard,A., Skov,S. and Odum,N. (1994) Interleukin-2 induces tyrosine phosphorylation and nuclear translocation of STAT3 in human T-lymphocytes. Eur. J. Immunol., 24, 3082–3086. [DOI] [PubMed] [Google Scholar]
- Rödel B., Wagner,T., Zörnig,M., Niessing,J. and Möröy,T. (1998) The human homologue (GFI1B) of the chicken GFI gene maps to chromosome 9q34.13-A locus frequently altered in hematopoietic diseases. Genomics, 54, 580–582. [DOI] [PubMed] [Google Scholar]
- Scheijen B., Jonkers,J., Acton,D. and Berns,A. (1997) Characterization of pal-1, a common proviral insertion site in murine leukemia virus-induced lymphomas of c-myc and Pim-1 transgenic mice. J. Virol., 71, 9–16. [DOI] [PMC free article] [PubMed] [Google Scholar]
- Schindler C. and Darnell,J.E. (1995) Transcriptional responses to polypeptide ligands: The JAK–STAT pathway. Annu. Rev. Biochem., 64, 621–651. [DOI] [PubMed] [Google Scholar]
- Schmidt T., Zörnig,M., Beneke,R. and Möröy,T. (1996) MoMuLV proviral integrations identified by Sup-F selection in tumors from infected myc/pim bitransgenic mice correlate with activation of the gfi-1 gene. Nucleic Acids Res., 24, 2528–2534. [DOI] [PMC free article] [PubMed] [Google Scholar]
- Schmidt T., Karsunky,H., Gau,E., Zevnik,B., Elsasser,H.P. and Möröy,T. (1998) Zinc finger protein GFI-1 has low oncogenic potential but cooperates strongly with pim and myc genes in T-cell lymphomagenesis. Oncogene, 17, 2661–2667. [DOI] [PubMed] [Google Scholar]
- Shuai K. (1999) The STAT family of proteins in cytokine signaling. Prog. Biophys. Mol. Biol., 71, 405–422. [DOI] [PubMed] [Google Scholar]
- Starr R. et al. (1997) A family of cytokine-inducible inhibitors of signalling. Nature, 387, 917–921. [DOI] [PubMed] [Google Scholar]
- Takeda K., Kaisho,T., Yoshida,N., Takeda,J., Kishimoto,T. and Akira,S. (1998) Stat3 activation is responsible for IL-6-dependent T cell proliferation through preventing apoptosis: generation and characterization of T cell-specific Stat3-deficient mice. J. Immunol., 161, 4652–4660. [PubMed] [Google Scholar]
- Tong B., Grimes,H.L., Yang,T.-Y., Bear,S.E., Qin,Z., Du,K., el-Deiry,W.S. and Tsichlis,P.N. (1998) The Gfi-1B proto-oncoprotein represses p21waf1 and inhibits myeloid cell differentiation. Mol. Cell. Biol., 18, 2462–2473. [DOI] [PMC free article] [PubMed] [Google Scholar]
- Zhumabekov T., Corbella,P., Toliani,M. and Kioussis,D. (1995). Improved version of a human CD2 minigene based vector for T cell-specific expression in transgenic mice. J. Immunol. Methods, 185, 133–140. [DOI] [PubMed] [Google Scholar]
- Zörnig M., Busch,G., Beneke,R., Gulbins,E., Lang,F., Ma,A., Korsmeyer,S. and Möröy,T. (1995) Survival and death of prelymphomatous B-cells from N-myc/bcl-2 double transgenic mice correlates with the regulation of intracellular Ca2+ fluxes. Oncogene, 11, 2165–2174. [PubMed] [Google Scholar]
- Zörnig M., Schmidt,T., Karsunky,H., Grzeschiczek,A. and Möröy,T. (1996) Zinc finger protein GFI-1 cooperates with myc and pim-1 in T-cell lymphomagenesis by reducing the requirements for IL-2. Oncogene, 12, 1789–1801. [PubMed] [Google Scholar]
- Zweidler-McKay P.A., Grimes,H.L., Flubacher,M.M. and Tsichlis,P.N. (1996) Gfi-1 encodes a nuclear zinc finger protein that binds DNA and functions as a transcriptional repressor. Mol. Cell. Biol., 16, 4024–4034. [DOI] [PMC free article] [PubMed] [Google Scholar]


