Long interspersed nuclear elements-1 (LINE-1 or L1s) are abundant retrotransposons that comprise approximately 20% of mammalian genomes1–3. Active L1 retrotransposons can impact the genome in a variety of ways, creating insertions, deletions, new splice sites or gene expression fine-tuning4–6. We have previously shown that L1 retrotransposons are capable of mobilization in neuronal progenitor cells from rodents and humans and evidence of massive L1 insertions was observed in adult brain tissues but not in other somatic tissues7,8. In addition, L1 mobility in the adult hippocampus can also be influenced by the environment9. The neuronal specificity of somatic L1 retrotransposition in neural progenitors is partially due to the transition of a Sox2/HDAC1 repressor complex to a Wnt-mediated TCF/LEF transcriptional activation7,10. The transcriptional switch accompanies chromatin remodeling during neuronal differentiation, allowing a transient stimulation of L1 transcription7. The activity of L1 retrotransposons during brain development can impact gene expression and neuronal function, thereby increasing brain-specific genetic mosaicism11,12. Further understanding of the molecular mechanisms that regulate L1 expression should provide new insights into the role of L1 retrotransposition during brain development. Here we show that L1 neuronal transcription and retrotransposition in rodents is increased in the absence of methyl-CpG-binding protein 2 (MeCP2), a protein involved in global DNA methylation and human neurodevelopmental diseases. Using neuronal progenitor cells derived from human induced pluripotent stem cells and human tissues, we revealed that patients with Rett syndrome (RTT), carrying MeCP2 mutations, have increased susceptibility for L1 retrotransposition. Our data demonstrate that L1 retrotransposition can be controlled in a tissue-specific manner and that disease-related genetic mutations can influence the frequency of neuronal L1 retrotransposition. Our findings add a new level of complexity to the molecular events that can lead to neurological disorders.
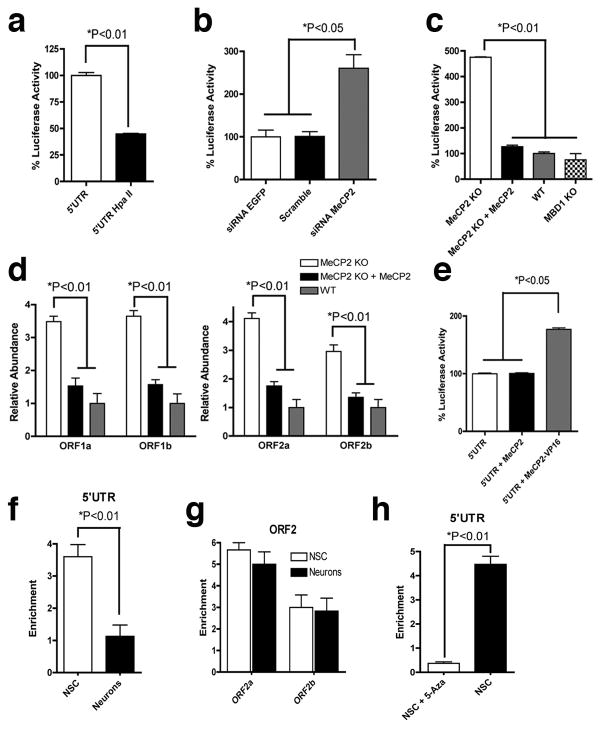
In neural stem cells, the repressor complex on the L1 promoter region (L1 5’UTR) includes the transcriptional factor Sox2 and the histone deacetylase 1 protein (HDAC1)7, a MeCP2 partner13,14. MeCP2 has been shown to interfere with the L1 5’UTR promoter activity in transformed cell lines15. To investigate the role of MeCP2 in the activity of L1 promoter in neural stem cells, we cloned the L1 promoter region upstream to the luciferase gene, generating the L1 5’UTR-Luc plasmid7. Methylation of the L1 5’UTR-Luc reduced the promoter activity in neural stem cells (Fig. 1a and Supplementary Fig. 1a). Reduction of MeCP2 levels using siRNAs, led to an increase in luciferase activity (Fig. 1b and Supplementary Fig. 1b). Transfection of the L1 5’UTR-Luc methylated plasmid in mouse neuroepithelial cells revealed that the L1 promoter activity was approximately 4 times more active in the MeCP2 knockout (KO) background than in wild-type (WT) (Fig. 1c and Supplementary Fig. 1c). Ectopic MeCP2 expression reduced the luciferase activity in MeCP2 KO cells close to WT levels (Fig. 1c).
Fig. 1.
MeCP2 silences L1 expression. a, Methylation of the L1 5’UTR-Luc reduced its transcriptional activity. b, Reduction of MeCP2 transcripts correlates with increased L1 promoter activity. c, Increased L1 promoter activity in the absence of MeCP2 but not MBD1. d, L1 RNA levels correlate with MeCP2 expression. e, Expression of the MeCP2-VP16 increased the activity of the L1 5’UTR promoter. f and g, Recruitment of MeCP2 on L1 sequences by ChIP in neural stem cells (NSC) or neurons, using 5’UTR primers (f) and two ORF2 regions (g). h, Occupancy of MeCP2 on the L1 promoter requires DNA methylation. Removal of DNA methylation with 5-Azacytidine (5-Aza) reduced MeCP2 association to L1 promoter. ChIP-qPCR shows enrichment over IgG control precipitation. All experiments show experimental triplicates. Error bars in all panels show s.e.m.
We repeated the luciferase assay using neuroepithelial cells from a sibling MBD1 KO animal16. MBD1 (methyl-binding protein 1) is part of the methyl-binding protein family and has differential DNA specificity when compared to MeCP217. The L1 promoter was not activated in MBD1 KO background, a finding that is consistent with the idea that L1 transcriptional repression is specific to MeCP2 (Fig. 1c). Moreover, the promoter activity correlated well with the level of L1 RNA, as measured by qPCR (Fig. 1d). Ectopic MeCP2 expression reduced L1 RNA levels in the MeCP2 KO background (Fig. 1d). We co-transfected neural stem cells with the methylated L1 5’UTR-Luc and a plasmid containing either the MeCP2 cDNA or the MeCP2 fused with the transactivator domain VP16. The overexpression of MeCP2 alone did not change the luciferase levels but the MeCP2-VP16 fusion increased luciferase levels 2-fold (Fig. 1e).
Using chromatin immunoprecipitation (ChIP) followed by quantitative PCR (qPCR), we detected high levels of MeCP2 in association with endogenous L1 promoter regions in neural stem cells compared to neurons (Fig. 1f). MeCP2 was also associated with other L1 regions (ORF2) but this association did not change during differentiation (Fig. 1g and Supplementary Fig. 1d, e). After treatment with 5-Azacytidine, the MeCP2 ChIP signal was reduced and L1 expression increased (Fig. 1h and Supplementary Fig. 1f). A set of the CpG sites within the L1 promoter had a tendency to de-methylate during neuronal differentiation, indicating that DNA methylation may silence L1 expression in neural stem cells by attracting MeCP2 (Supplementary Fig. 1g, h).
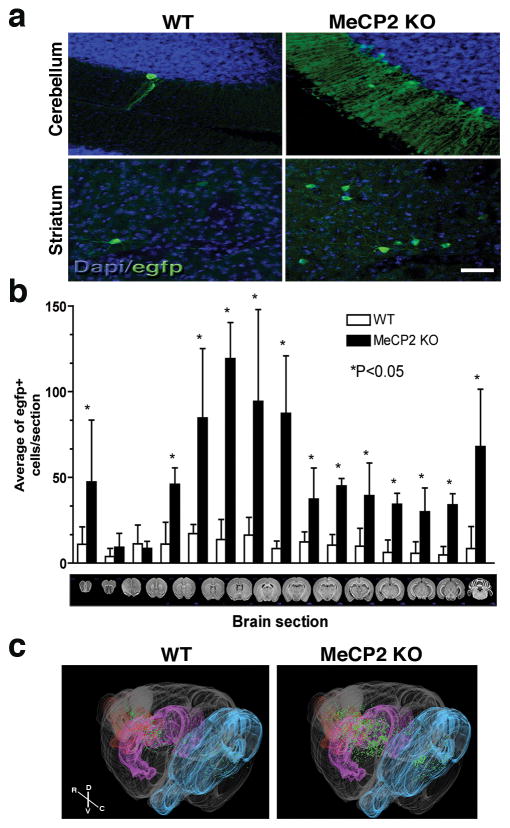
To study L1 regulation in vivo, we compared the brains of the L1-EGFP transgenic mice in WT and MeCP2 KO backgrounds. L1-EGFP transgenic mice have a L1 indicator cassette that will only activate the EGFP reporter after retrotransposition7 (Supplementary Fig. 2a). The numbers of EGFP-positive cells in the brains of MeCP2 KO mice were significantly higher than in WT (Fig. 2a, b). EGFP-positive cells were also observed in the germ line of MeCP2 KO at similar frequency as in WT animals, but not in other somatic tissues (Supplementary Fig. 2b). To visualize the distribution of EGFP-positive cells, we generated high-resolution, 3-dimensional maps of both MeCP2 KO and WT brains. Although MeCP2 KO brain sections had an average of 3.5-fold more EGFP-positive cells than WT, certain brain structures were more prone to L1 retrotransposition (Fig. 2b, c). Specifically, the cerebellum, striatum, cortex, hippocampus and olfactory bulb contained 4.2-, 5.3-, 2.8-, 6.3- and 3.8-fold more EGFP-positive neurons, respectively, in the MeCP2 KO genetic background than in WT (Supplementary Fig. 3 and Supplementary movie). More EGFP-positive cells may suggest an increased rate of L1 retrotransposition and/or higher rate of MeCP2 KO cell proliferation with the newly retrotransposed EGFP reporter. We found no evidence that neuroepithelial cells from the MeCP2 KO genetic background had a higher rate of division than WT (Supplementary Fig. 4a).
Fig. 2.
MeCP2 modulates neuronal L1 retrotransposition in vivo. a, EGFP-positive cells, indicating de novo L1 retrotransposition, were found in several regions of the brain. The images were taken from sections that were highly affected by L1 retrotransposition. Bar=30 μm. b, Quantification of brain sections in MeCP2 KO background revealed more EGFP-positive cells compared to WT (n=6 animals for each group). Error bars show s.d. c, Representative images from a 3-dimensional reconstruction of WT and MeCP2 KO brains carrying the L1-EGFP transgene. Single dots (green) represent neurons that supported L1-EGFP retrotransposition. Olfactory bulb is shown in red, striatum in magenta and cerebellum in cyan. R, rostral; C, caudal; D, dorsal and V, ventral.
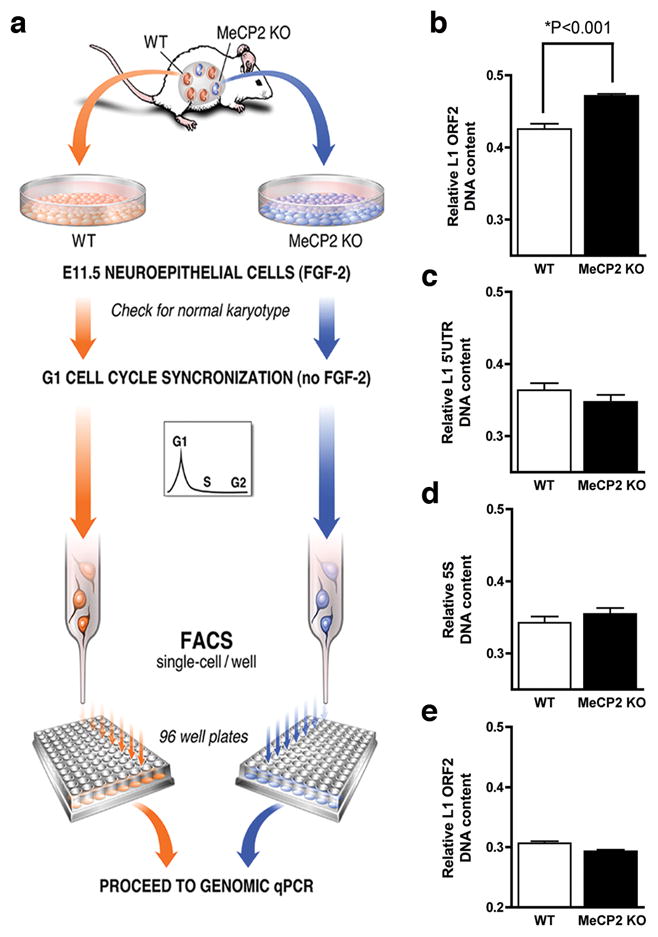
We next asked whether endogenous L1 retrotransposition was also increased in the MeCP2 KO brain. New retroelements insertions can be quantified using a qPCR approach8,18. To determine the activity of endogenous L1 elements, we developed a technique based on single-cell genomic qPCR that measures the frequency of mouse L1 sequences within the genome (Fig. 3a). We hypothesized that MeCP2 KO-derived neuroepithelial cells would have increased genomic content of L1 sequences compared to WT cells. Neuroepithelial cells from WT and MeCP2 KO sibling mouse embryos were synchronized in G1 phase and karyotyped, to avoid interference during genomic L1 detection (Supplementary Fig. 4b, c). Finally, single-cell amplification using primers for ORF2 from active L1 families confirmed the presence of the expected amplicons (Supplementary Fig. 4d). MeCP2 KO-derived neuroepithelial cells displayed significantly more ORF2 genomic copies than WT cells (Fig. 3b). Specific primers for the L1 5’UTR were also tested in neuroepithelial cells and did not reveal an increase in copy number in MeCP2 KO background (Fig. 3c). This lack of difference can be explained by the fact that, upon retrotransposition, the 5’ region of the L1 sequence is frequently truncated19,20. Also, no difference between genetic backgrounds was observed when using primers for non-mobile 5S ribosomal RNA repetitive sequences (Fig. 3d). Another control experiment was performed using fibroblasts isolated from the two backgrounds (Fig. 3e). We did not observe a highly significant increase in L1 copy number in MeCP2 KO compared to WT.
Fig. 3.

Endogenous L1 retrotransposition in mouse neuroepithelial cells. a, Neuroepithelial cells harvested from E11.5 sibling embryos were synchronized and sorted in individual wells followed by qPCR. b, Neuroepithelial cells in the MeCP2 KO background had higher L1 ORF2 DNA content than WT cells (P<0.001). c, L1 5’UTR primers did not reveal a significant increase in copy number in MeCP2 KO background. d, Non-mobile 5S ribosomal genes were used as controls. e, The difference in the amount of L1 ORF2 DNA in fibroblasts from the different genetic backgrounds was smaller than in the neural lineage. All experiments show experimental triplicates (n=192 cells for each primer pair). Error bars in all panels show s.e.m.
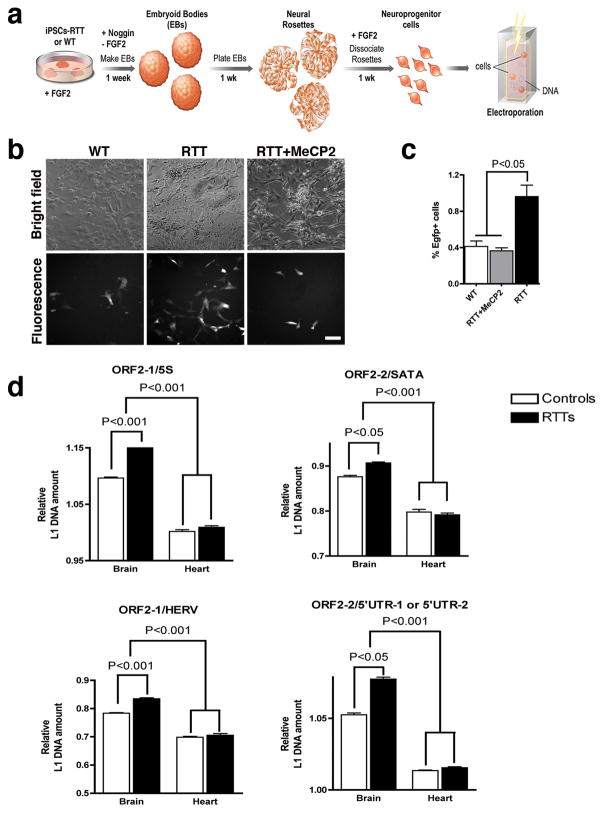
Mutations on the MeCP2 gene cause RTT, characterized by arrested development in early childhood and autistic behavior at different levels of intensity21. To determine if L1 retrotransposition could occur in neuronal progenitor cells (NPC) derived from RTT patients, we generated induced pluripotent stem cells (iPSC) from a RTT patient’s fibroblasts carrying a frameshift MeCP2 mutation and from a control, non-affected individual. All clones were pluripotent and able to produce NPC and neurons (Supplementary Fig. 5). Thus, we decided to test if the iPSC-derived NPC supported L1 retrotransposition (Fig. 4a).
Fig. 4.
L1 retrotransposition in RTT patients. a, Schematic view of the NPC differentiation from iPSC followed by L1RE3-EGFP electroporation. b, Representative images of iPSC-derived NPC expressing EGFP after L1 retrotransposition. Bar=30 μm. c, Quantification of the EGFP-positive cells after transfection. d, Primers for ORF2 were used to multiplex with primers for control sequences, such as the 5S ribosomal gene (5S), the satellite alpha (SATA) region, the human endogenous retrovirus H (HERV) sequence and the 5’UTR. The inverse ratio of ORF2/5S represents the amount of L1 ORF2 sequence in each sample (n=5 individuals/group). Similar results were obtained when different primers/probe for ORF2 (ORF2-2) were multiplex/normalized to other control sequences, using two pair of primers (5’UTR-1 or 5’UTR-2). Error bars show s.e.m, and the experiments were performed in triplicate.
NPC from both WT and RTT iPSC expressed the neural markers Sox1, Musashi1, Nestin and Sox2 at similar rates at the time of the experiment (Supplementary Fig. 6a, b). RTT and WT cells were electroporated with the L1RE3-EGFP reporter construct22,23. EGFP expression was detected in both WT and RTT cells (Fig. 4b). The frequency of EGFP-positive cells was approximately 2-fold higher in RTT than in control cells. Moreover, MeCP2 complementation reduced the levels of EGFP-positive cells in RTT NPC (Fig. 4b,c and Supplementary Fig. 6c). PCR confirmed the presence of the retrotransposed EGFP and sequencing confirmed the precise splicing of the intron (Supplementary Fig. 6d). We concluded that L1 activity could be facilitated by loss of MeCP2 function in human cells. We extended the iPSC findings in vivo using postmortem human tissues. To analyze the amounts of L1 retrotransposition in RTT patients and controls, brain and heart tissue were obtained from the same individuals. After genomic DNA extraction, a qPCR was used to compare the number of L1 ORF2 sequences normalized by four distinct non-mobile repetitive sequences. The number of L1 ORF2 sequences in the brains of RTT patients was significantly higher than in age/gender-matched controls (Fig. 4d). Moreover, the number of ORF2 sequences was higher in brain tissues in both controls and RTT patients when compared to heart tissue from the same individuals.
Our findings support previous data demonstrating that L1 5’UTR sequences are MeCP2 targets that may be subject to methylation-dependent repression15,17. However, we cannot exclude an indirect effect of MeCP2 in regulating genes involved in L1 expression and/or in changing the chromatin epigenetic landscape to facilitate de novo L1 insertions. An additive effect of multiple mechanisms is likely. Using different strategies, we have shown that L1 retrotransposition can be modulated by MeCP2. First, we demonstrated that MeCP2 can downregulate L1 promoter activity. Second, L1 retrotransposition from the L1-EGFP transgenic mice was significantly higher in the brains of a MeCP2 KO background than in a WT sibling animal. The L1-EGFP indicator system underestimates the actual capacity of retrotransposition and does not take into account insertions that truncate or silence the reporter cassette, in trans retrotransposition of Alus or other RNAs24–26. Third, we developed a new technique based on single-cell genomic qPCR to measure the relative abundance of L1 sequences, revealing that MeCP2 KO neuroepithelial cells have more L1 sequences in the genome than WT cells. Lastly, RTT-NPC showed a higher L1 retrotransposition frequency than control cells. A qPCR experiment extended these observations to human brain samples from RTT patients compared to controls.
Our data provide evidence of a role for DNA methylation-dependent MeCP2 activity in controlling L1 mobility in the nervous system. Re-activation of MeCP2 expression was shown to reverse some of the neurological symptoms in MeCP2 KO mice27. The high rates of neuronal retrotransposition in the MeCP2 KO mice and RTT patients may be a consequence, rather than a cause, of the disease process. Nonetheless, new somatic insertions, especially at early developmental stages, may contribute to the genetic and epigenetic status of mature neurons at later stages of life. Early developmental structural and functional modulations could have potential consequences for RTT, where the detrimental effects of MeCP2 mutation occur at later postnatal stages. It is plausible to conclude that the RTT process leads to an increased rate of somatic mutations in the brain. Increased L1 neuronal retrotransposition is a novel and unexpected characteristic of RTT pathology. Our findings add a new layer of complexity to the understanding of genomic plasticity and may have direct implications for individual variation and for neurological diseases.
Methods Summary
For the luciferase activity experiments, rat neural stem cells were isolated, characterized and cultured as described28. Freshly isolated neuroepithelial cells from time-pregnant midgestation (E11.5) telencephalons from male WT, MBD1 KO, and MeCP2 KO sibling mouse embryos, from the same genetic background (C57BL/6J), were cultured for 2–3 passages in DMEMF12 media with N2 supplement and FGF2 as described elsewhere29. Plasmid and siRNA transfections were performed by electroporation (Lonza/Amaxa Biosystem). Luciferase activity was measured with the Dual-Luciferase reporter assay system (Promega) according to the manufacturer’s protocol. Chromatin immunoprecipitation (ChIP) assays were performed following the manufacturer’s protocol using a kit from Millipore/Upstate. Antibodies used were anti-MeCP2 and IgG (Upstate). After IP, recovered chromatin fragments were subjected to PCR using primers for the rat L1 sequence. QPCR values were normalized to the IgG precipitation and shown as fold enrichment. For human iPSC derivation, RTT and control fibroblasts were infected with retroviral vectors containing the Oct4, c-Myc, Klf4 and Sox2 human cDNAs as described previously by Yamanaka’s group30. iPSC-derived neural progenitors were electroporated (Lonza/Amaxa Biosystem) with L1-EGFP plasmid and FACS sorted for EGFP to quantify L1 de novo insertion. Single-cell genomic quantitative PCR (qPCR) was performed in cell cycle arrested neuroepithelial cells and fibroblasts from wt and MeCP2 KO mice. The plates containing 1 cell/well were then snap frozen at −80°C until the day of the qPCR. The qPCR was performed using the protocol available on the manufacturer’s website (Applied Biosystems). Briefly, a solution containing forward/reverse primers and SYBRR Green PCR Master Mix was added to the previously sorted cells and the detection of DNA products was carried out in a ABI PRISMR 7900HT Sequence Detection System. For multiplex genomic qPCR in human tissues the qPCR strategy and L1 copy estimation were done as previously described8.
Supplementary Material
Acknowledgments
A.R.M. is supported by the National Institutes of Health through the NIH Director's New Innovator Award Program, 1-DP2-OD006495-01 and by the Emerald Foundation. F.H.G. is supported by the Mathers Foundation, Lookout Fund, and NIH R01MH088485. The authors would like to thank A. Huynh, B. Aimone, K. Stecker, B. Berg and D. Sepp for help during the 3D brain model assembly, J. Moran and J. Garcia-Perez for discussion and critical review of the manuscript, M. Gage for editorial comments, and B. Moddy and G. Peng for experimental assistance.
Footnotes
Supplementary Information
Full Methods and respective references
Authors Contributions
A.R.M. and M.C.N.M. are the leading authors. They contributed to the concept, designed, performed the experiments, analyzed the data, and wrote the manuscript. N.G.C. performed and analyzed qPCR experiments. R.O. performed tissue culture experiments and quantification. G.Y. helped with statistical analysis and data interpretation. K.N. contributed reagents, and performed data analyses and manuscript revision. F.H.G. contributed to the concept, analyzed the data, and revised the manuscript.
Reprints and permissions information is available at www.nature.com/reprints.
The authors declare that they have no competing financial interests.
References
- 1.Lander ES, et al. Initial sequencing and analysis of the human genome. Nature. 2001;409 (6822):860–921. doi: 10.1038/35057062. [DOI] [PubMed] [Google Scholar]
- 2.Gibbs RA, et al. Genome sequence of the Brown Norway rat yields insights into mammalian evolution. Nature. 2004;428 (6982):493–521. doi: 10.1038/nature02426. [DOI] [PubMed] [Google Scholar]
- 3.Waterston RH, et al. Initial sequencing and comparative analysis of the mouse genome. Nature. 2002;420 (6915):520–562. doi: 10.1038/nature01262. [DOI] [PubMed] [Google Scholar]
- 4.Kazazian HH., Jr Mobile elements and disease. Curr Opin Genet Dev. 1998;8 (3):343–350. doi: 10.1016/s0959-437x(98)80092-0. [DOI] [PubMed] [Google Scholar]
- 5.Han JS, Szak ST, Boeke JD. Transcriptional disruption by the L1 retrotransposon and implications for mammalian transcriptomes. Nature. 2004;429 (6989):268–274. doi: 10.1038/nature02536. [DOI] [PubMed] [Google Scholar]
- 6.Perepelitsa-Belancio V, Deininger P. RNA truncation by premature polyadenylation attenuates human mobile element activity. Nat Genet. 2003;35 (4):363–366. doi: 10.1038/ng1269. [DOI] [PubMed] [Google Scholar]
- 7.Muotri AR, et al. Somatic mosaicism in neuronal precursor cells mediated by L1 retrotransposition. Nature. 2005;435 (7044):903–910. doi: 10.1038/nature03663. [DOI] [PubMed] [Google Scholar]
- 8.Coufal NG, et al. L1 retrotransposition in human neural progenitor cells. Nature. 2009;460 (7259):1127–1131. doi: 10.1038/nature08248. [DOI] [PMC free article] [PubMed] [Google Scholar]
- 9.Muotri AR, Zhao C, Marchetto MC, Gage FH. Environmental influence on L1 retrotransposons in the adult hippocampus. Hippocampus. 2009;19 (10):1002–1007. doi: 10.1002/hipo.20564. [DOI] [PMC free article] [PubMed] [Google Scholar]
- 10.Kuwabara T, et al. Wnt-mediated activation of NeuroD1 and retro-elements during adult neurogenesis. Nat Neurosci. 2009;12 (9):1097–1105. doi: 10.1038/nn.2360. [DOI] [PMC free article] [PubMed] [Google Scholar]
- 11.Muotri AR, Gage FH. Generation of neuronal variability and complexity. Nature. 2006;441 (7097):1087–1093. doi: 10.1038/nature04959. [DOI] [PubMed] [Google Scholar]
- 12.Singer T, McConnell MJ, Marchetto MC, Coufal NG, Gage FH. LINE-1 retrotransposons: mediators of somatic variation in neuronal genomes? Trends Neurosci. 33(8):345–354. doi: 10.1016/j.tins.2010.04.001. [DOI] [PMC free article] [PubMed] [Google Scholar]
- 13.Nan X, et al. Transcriptional repression by the methyl-CpG-binding protein MeCP2 involves a histone deacetylase complex. Nature. 1998;393 (6683):386–389. doi: 10.1038/30764. [DOI] [PubMed] [Google Scholar]
- 14.Jones PL, et al. Methylated DNA and MeCP2 recruit histone deacetylase to repress transcription. Nat Genet. 1998;19 (2):187–191. doi: 10.1038/561. [DOI] [PubMed] [Google Scholar]
- 15.Yu F, Zingler N, Schumann G, Stratling WH. Methyl-CpG-binding protein 2 represses LINE-1 expression and retrotransposition but not Alu transcription. Nucleic Acids Res. 2001;29 (21):4493–4501. doi: 10.1093/nar/29.21.4493. [DOI] [PMC free article] [PubMed] [Google Scholar]
- 16.Zhao X, et al. Mice lacking methyl-CpG binding protein 1 have deficits in adult neurogenesis and hippocampal function. Proc Natl Acad Sci U S A. 2003;100 (11):6777–6782. doi: 10.1073/pnas.1131928100. [DOI] [PMC free article] [PubMed] [Google Scholar]
- 17.Klose RJ, et al. DNA binding selectivity of MeCP2 due to a requirement for A/T sequences adjacent to methyl-CpG. Mol Cell. 2005;19 (5):667–678. doi: 10.1016/j.molcel.2005.07.021. [DOI] [PubMed] [Google Scholar]
- 18.Rowe HM, et al. KAP1 controls endogenous retroviruses in embryonic stem cells. Nature. 463(7278):237–240. doi: 10.1038/nature08674. [DOI] [PubMed] [Google Scholar]
- 19.Grimaldi G, Skowronski J, Singer MF. Defining the beginning and end of KpnI family segments. Embo J. 1984;3 (8):1753–1759. doi: 10.1002/j.1460-2075.1984.tb02042.x. [DOI] [PMC free article] [PubMed] [Google Scholar]
- 20.Moran JV, Gilbert N. Mammalian LINE-1 retrotransposons and related elements. ASM Press; Washington, DC: 2002. [Google Scholar]
- 21.Amir RE, et al. Rett syndrome is caused by mutations in X-linked MECP2, encoding methyl-CpG-binding protein 2. Nat Genet. 1999;23 (2):185–188. doi: 10.1038/13810. [DOI] [PubMed] [Google Scholar]
- 22.Moran JV, et al. High frequency retrotransposition in cultured mammalian cells. Cell. 1996;87 (5):917–927. doi: 10.1016/s0092-8674(00)81998-4. [DOI] [PubMed] [Google Scholar]
- 23.Ostertag EM, Prak ET, DeBerardinis RJ, Moran JV, Kazazian HH., Jr Determination of L1 retrotransposition kinetics in cultured cells. Nucleic Acids Res. 2000;28 (6):1418–1423. doi: 10.1093/nar/28.6.1418. [DOI] [PMC free article] [PubMed] [Google Scholar]
- 24.Esnault C, Maestre J, Heidmann T. Human LINE retrotransposons generate processed pseudogenes. Nat Genet. 2000;24 (4):363–367. doi: 10.1038/74184. [DOI] [PubMed] [Google Scholar]
- 25.Dewannieux M, Esnault C, Heidmann T. LINE-mediated retrotransposition of marked Alu sequences. Nat Genet. 2003;35 (1):41–48. doi: 10.1038/ng1223. [DOI] [PubMed] [Google Scholar]
- 26.Wei W, et al. Human L1 retrotransposition: cis preference versus trans complementation. Mol Cell Biol. 2001;21 (4):1429–1439. doi: 10.1128/MCB.21.4.1429-1439.2001. [DOI] [PMC free article] [PubMed] [Google Scholar]
- 27.Guy J, Gan J, Selfridge J, Cobb S, Bird A. Reversal of neurological defects in a mouse model of Rett syndrome. Science. 2007;315 (5815):1143–1147. doi: 10.1126/science.1138389. [DOI] [PMC free article] [PubMed] [Google Scholar]
- 28.Palmer TD, Takahashi J, Gage FH. The adult rat hippocampus contains primordial neural stem cells. Mol Cell Neurosci. 1997;8 (6):389–404. doi: 10.1006/mcne.1996.0595. [DOI] [PubMed] [Google Scholar]
- 29.Nakashima K, et al. Synergistic signaling in fetal brain by STAT3-Smad1 complex bridged by p300. Science. 1999;284 (5413):479–482. doi: 10.1126/science.284.5413.479. [DOI] [PubMed] [Google Scholar]
- 30.Takahashi K, et al. Induction of pluripotent stem cells from adult human fibroblasts by defined factors. Cell. 2007;131 (5):861–872. doi: 10.1016/j.cell.2007.11.019. [DOI] [PubMed] [Google Scholar]
Associated Data
This section collects any data citations, data availability statements, or supplementary materials included in this article.


