

Abstract
There are many liver diseases that could be treated with delivery of therapeutics such as DNA, proteins or small molecules. Nanoparticles are often proposed as delivery vectors for such therapeutics, however, achieving nanoparticle accumulations in the therapeutically relevant hepatocytes is challenging. In order to address this issue, we have synthesized polymer coated, fluorescent iron oxide nanoparticles that bind and deliver DNA, as well as produce contrast for magnetic resonance imaging (MRI), fluorescence imaging and transmission electron microscopy (TEM). The composition of the coating can be varied in a facile manner to increase the quantity of polyethylene glycol (PEG) from 0% to 5%, 10% or 25%, with the aim of reducing opsonization, but maintaining DNA binding. We investigated the effect of the nanoparticle coating on DNA binding, cell uptake, cell transfection and opsonization in vitro. Furthermore, we exploited MRI, fluorescence imaging and TEM to investigate the distribution of the different formulations in the liver of mice. While MRI and fluorescence imaging showed that each formulation was heavily taken up in the livers at 24 hours, the 10% PEG formulation was taken up by the therapeutically relevant hepatocytes more extensively than either the 0% PEG or the 5% PEG, indicating its potential for delivery of therapeutics to the liver.
Keywords: Tunable coating, PEGylation, MRI, iron oxide, liver disease, nanoparticles
Introduction
Nanoparticle targeting to the liver is of great interest as there are numerous liver diseases that could be treated by delivery of DNA, proteins, small molecules or other therapeutics. For example, there are several diseases whose source is a mutated gene in the liver(1) such as familial hypercholesterolemia,(2) hereditary haemochromatosis,(3) anti-trypsin deficiency(4) or ornithine transcarbamylase deficiency.(5) These diseases can potentially be treated by transfection of the hepatocytes of the liver with the correct genes or delivery of the missing protein.(6)
Blood flowing into the liver is dispersed via a dense network of vessels called sinusoids (Figure 1A). A mixed layer of fenestrated endothelial cells and Kupffer cells surrounds the sinusoids.(7) This layer is separated from the hepatocytes by the space of Disse. Kupffer cells are an important component of the reticuloendothelial system (RES) that clears foreign entities from the body. They phagocytose nanoparticles that have been coated with opsonins,(8) blocking nanoparticle access to hepatocytes. To enter hepatocytes, nanoparticles need to evade the Kupffer cells, penetrate the fenestrated endothelium and pass the space of Disse. Therefore, efficient nanoparticle targeting to hepatocytes requires judicious tuning of nanoparticle coating without affecting nanoparticle size and/or morphology. In the case of liposomes for example the PEG density cannot exceed 5–10 % without affecting their size and morphology.(9)
Figure 1.

A) Left, cellular structure around a liver sinusoid and right, nanoparticle interactions at the sinusoid. B) Schematic depiction of the polymer-coated iron core, fluorescent nanoparticles used as gene delivery agents in this study. C) Depiction of nanoparticle synthesis and subsequent complexation with plasmid DNA.
A recent trend in nanomedicine has been to combine diagnostically active components in drug delivery systems in order to have imaging readouts on distribution and targeting. This field has been termed ‘theranostics’.(10) For example, in a seminal study, Medarova et al. reported a dextran coated iron oxide nanoparticle labeled with Cy5.5, whose delivery of siRNA could be tracked by MRI and fluorescence imaging, respectively.(11) More recently, Qi and Gao reported a quantum dot system for imaging of siRNA delivery.(12) Park et al. devised a quantum dot and iron oxide containing micelle that was used to track the delivery of the small molecule anti-cancer drug doxorubicin.(13) A composite gold nanoparticle-iron oxide platform was shown by Wang et al. to be effective for imaging and also photothermal ablation of cancer cells.(14)
In the current study we report an iron oxide nanoparticle platform whose coating can be precisely tuned with respect to PEG density and charge. The former prevents aggregation and Kupffer cell uptake while the latter allows complexation with nucleic acids. Moreover, the iron oxide core and fluorescent dye incorporation enable nanoparticle tracking by magnetic resonance imaging (MRI) and fluorescence imaging. Importantly, the iron oxides can also be detected using transmission electron microscopy (TEM), which allows the investigation of nanoparticle distribution at the (sub)cellular level.
The nanoparticle we used consists of an oleic acid coated iron oxide core coated with a DNA binding polymer and was additionally labeled with a near infrared fluorophore. The method of synthesis allowed polyethylene glycol (PEG) amphiphiles to be easily incorporated in the nanoparticle coating at variable levels. Due to the zwitterionic nature of the polymer coating of the nanoparticles synthesized (Supporting Figure 1), we surmised that without PEG the nanoparticles would be swiftly opsonized and sequestered in the Kupffer cells, but, by increasing the level of PEG in the nanoparticle coating, opsonization could be avoided(15) and the nanoparticles would gain access to therapeutically relevant hepatocytes (Figure 1A). However, increasing levels of PEG might reduce the DNA binding potential of the nanoparticles. Therefore we synthesized nanoparticles with 0%, 5%, 10% and 25% of PEG in the coating (Figure 1B), in order to try to find an optimized formulation that could bind DNA and also reach the hepatocytes in vivo.
The goals of our study were to determine the effect of the different coating compositions on DNA binding, the nanoparticle behavior in vitro and in vivo and to evaluate this using variety of imaging systems. Therefore, these nanoparticles were characterized, tested for their DNA binding and transfection potential in vitro. We performed in vivo studies in wild type mice where the nanoparticle half-life and tissue distribution were determined by in vivo MRI and fluorescence techniques. Last, the nanoparticle distribution in the cells of the liver was investigated via TEM.
Experimental
Materials
Oleic acid coated iron oxide nanocrystals in non-polar solvent were supplied by NN-labs, LLC (Fayetteville, AR). Poly (maleic anhydride-alt-1-octadecene) substituted with 3-(Dimethylamino) propylamine (PMAL) was purchased from Anatrace, OH. Distearoyl phosphoethanolamine-N-[methoxy(polyethylene glycol)-2000] ammonium salt (PEG-DSPE) and distearoyl phosphatidylethanolamine (DSPE) were obtained from Avanti Polar Lipids, AL. NIR664-labeled dimyristoyl phosphoethanolamine (NIR664-DMPE) was synthesized as described below. DNA plasmids (peGFP-N2) were produced by Aldevron, ND. Cell culture supplies were purchased from Invitrogen, CA.
NIR664-DSPE Synthesis
In this study we used the fluorophore NIR664, which has similar excitation and emission characteristics as Cy5.5. NIR664-labeled DSPE was synthesized by a modification of a recently reported method.(16) Typically, 9 mg of DSPE was dissolved in 2 ml of a 4:1 chloroform:methanol solvent mixture to form solution A. 5 mg of NIR-664-N-succinimidyl ester was dissolved in 1 ml of a 1:4 DMSO:chloroform solvent mixture, to make solution B. 10 μl of triethylamine was mixed with 90 μl of the 1:4 DMSO:chloroform solvent mixture to make solution C. Solution A, B and 10 μl of solution C were mixed to form solution D, which was stirred overnight at 4 °C under nitrogen atmosphere. 7 mg of stearoyl-hydroxy phosphatidylcholine was dissolved in 4:1 chloroform:methanol and added to solution D. The solvents were removed from this mixture to form a lipid film, which was hydrated with 5 ml of deionized water. 50 kDa Vivaspin molecular weight cut-off tubes were used to separate unconjugated NIR-664 ester from NIR-664 conjugated lipid micelles, by washing 5 times with deionized water until the filtrate was completely colorless. The NIR-664 micelles were subsequently freeze dried for 3 days to remove all water, after which they were dissolved in a 4:1 chloroform:methanol mixture such that the concentration of NIR-664 was 1 mmol/ml.
Synthesis of polymer coated iron oxide nanoparticles
Iron oxide nanocrystals were coated with the DNA binding polymer PMAL, varying quantities of PEG-DSPE and NIR664-DMPE. Four different coatings were established: 100% PMAL + 0.5% NIR664-DMPE, 95% PMAL + 5 % PEG-DSPE + 0.5% NIR664-DMPE, 90% PMAL + 10% PEG-DSPE + 0.5% NIR664-DMPE and 75% PMAL + 25% PEG-DSPE + 0.5% NIR664-DMPE.
Syntheses of the different formulations used the same approach, but with varying quantities of coating reagents. In an example protocol, 5% PEG nanoparticles were synthesized by dissolving 0.057 g PMAL, 0.005 g PEG-DSPE and 0.209 μmol NIR664-DMPE were dissolved in 5 ml of a 20:1 chloroform:methanol solvent mixture. This solution was added to 5 ml of chloroform in which 14.3 mg of 20 nm iron oxide nanocrystals were dissolved. The resulting mixture was added dropwise to 10 ml of stirred, 80 °C DI-water. After cooling, the mixture was centrifuged for 8 minutes at 3000 rpm and the resulting supernatant retained. The solution was concentrated to 2.4 ml. In order to separate the coated iron cores from empty coating aggregates, the mixture was ultracentrifuged at 14,000 rpm in a 30% KBr solution. An Eppendorf minispin plus centrifuge was used. The pellet was resuspended in PBS and the resulting coated iron oxide nanoparticles were thereafter washed 3 times in 1x PBS using 10 kDa Vivaspin molecular weight cut-off tubes to remove residual KBr.
Particle composition analysis
Iron content was determined by inductively coupled plasma mass spectrometry (Cantest Ltd, Burnaby, Canada). Phosphorous analysis was carried out by the method of Rouser.(17)
Relaxometry
T1 values of solutions were determined on a 60 MHz Bruker Minispec (Bruker Medical GmbH, Ettlingen) operating at 40 °C. In order to find the longitudinal and transverse relaxivities of the nanoparticles, 10, 20, 40 and 60 μl of sample were diluted to 200 μl using 1x PBS and the T1 and T2 was measured for each solution. The longitudinal (r1) and transverse (r2) relaxivities of the samples were then calculated from the slope of the graph of 1/T1 and 1/T2 plotted against the iron concentration.
Dynamic light scattering/zeta potential
100 μl of nanoparticles were diluted with 1900 μl of filtered deionized water and characterized with respect to diameter and zeta potential using a ZetaPALS instrument with BI-MAS particle sizing option from Brookhaven Instruments Corporation, Holtsville, NY.
DNA binding studies
DNA (1.2 μg) was added to each type of nanoparticle (5.8 μg Fe) at a 1:1 molar ratio and incubated at 4 °C for 1 hour or 24 hours. 1.2 μg of free DNA was used as control. This made a total of 7 samples. A 1% agarose gel with ethidium bromide was prepared and covered in TAE buffer. The 7 samples were mixed with loading buffer (1:4) and added to the wells. Fisher BioReagents* exACTGene* > 1kb DNA Ladder was added to an eighth well. The gel ran at 100 mV for approximately 45 minutes, after which the gel was photographed using a BioDoc-It system (UVP, Upland, CA).
Nanoparticle stability in serum
We determined the effect of PEG density on nanoparticle stability in serum by incubating them in PBS containing 10% FBS. Nanoparticle sizes were determined by DLS before incubation in 10% FBS, after 1 hour and again after 24 hours.
Cell incubations
293T (Human Embryonic Kidney 293 cells, ATCC, Manassas, VA) were cultured in DMEM supplemented with 10% FBS. After the fifth splitting, the cells were seeded into six well plates with 2 ml of DMEM in each well. The cells were allowed to grow to 70- 80% confluency. On the day of transfection the cells were washed with 1x PBS and 2 ml of Opti-Mem Reduced Serum Medium were added to each well.
Nanoparticle-DNA complexes were prepared in a 1:1 ratio by mixing 0.0013 nmol (4 μg) DNA with 0.0013 nmol of NPs (18.5 μg IO). As a positive control Lipofectamine (Invitrogen, CA) was prepared as described by the manufacturer. One well with free DNA and one well with media were used as negative controls. After 4 hours of incubation the serum free media was carefully removed and 2 ml of DMEM was added to each well. After 16 hours, the cells were washed 3 times with PBS and used for confocal microscopy imaging. When the cells were used for MRI, they were collected by trypsin- EDTA treatment, subsequently centrifuged to form pellets, dispersed in 4% paraformaldehyde and finally allowed to loosely settle. For TEM, pellets were prepared in the same way, except 2% glutaraldehyde was used.
MRI of cell pellets
For MR imaging, cell pellets were embedded in a 2% agarose gel that contained 0.27 mM Gd-DTPA (Magnevist, Berlex). The cell pellets and the gel were imaged using a 1.5 T whole body scanner (Siemens Sonata, Siemens Medical Solutions, Erlangen, Germany) using a volume knee coil for signal reception. A 2D gradient echo (GRE) sequence was used. Relevant imaging parameters were: echo time (TE), 2.38ms; repetition time (TR), 80 ms; 1 slice, with slice thickness 3 mm; 4 signal averages, flip angle (FA), 30 degrees; acquisition matrix, 512×512; in-plane spatial resolution, 0.2344 mm2; field of view (FOV), 120 mm2. The resulting images were processed using Osirix v.3.0.1 32-bit (Geneva, Switzerland; www.osirix-viewer.com).
Transmission Electron Microscopy (TEM)
A Hitachi H7650 instrument linked to a SIA (Scientific Instruments and Applications) digital camera controlled by Maxim CCD software was used. TEM was performed on nanoparticle samples suspended in an ammonium acetate buffer using a 2% sodium phosphotungstate (pH=7) negative stain as described by Forte and Nordhausen.(18) 293T cells were incubated with NP-DNA-complexes (see Cell incubations for details) and prepared for TEM by fixation in glutaraldehyde, followed by osmium tetraoxide and stained post-sectioning with 4% uranyl acetate and Reynold’s lead citrate.(19) More than 30 cells were surveyed per grid. TEM images displayed are representative of the results from these cells.
Liver sections were prepared for TEM using the same protocol as for cultured cells. The percentage of nanoparticle positive (>20 nanoparticle cores per cell) was determined via the following method. The operator (DPC) was trained to identify hepatocyte cells by the pathologist (RG). Grid squares were imaged to prevent repetitive imaging. Next, hepatocytes in the squares were imaged at one thousand-fold magnification. Each such hepatocyte was scanned for areas of hypointensity that might correspond to nanoparticle uptake. These areas were imaged under ten and twenty-five thousand-fold magnification, to allow identification of nanoparticles. The cells were classed as nanoparticle positive or negative by a reader blinded to the nanoparticle type used in the mice (MWG).
Confocal microscopy
Confocal imaging was performed on a Leica SP5DM microscope. DAPI was imaged using a 405 nm diode and 410–480 nm filters and GFP was image using a 488 nm Argon laser with a 500–580 nm filter set. For confocal microscopy, 293T cells were grown on cover slips placed at the bottom of six well plates. After transfection (see Cell incubation for details) the cover slips were washed with PBS and mounted on slides using a DAPI mounting media and sealed with nail polish. Slides were imaged immediately after preparation. The signal from the signal from the GFP was displayed as green and DAPI as blue.
Cell viability
As a measure of cell viability, incubations were carried out as described above, after which CellTiter-Glo® Luminescent Cell Viability Assay (Promega, Madison, WI), a measure of ATP content was added and the luminescence measured according to the manufacturers instructions.
Nanoparticle blood circulation half-life determination
Nanoparticle blood circulation half-lives were determined by measuring the fluorescence of plasma drawn from the mice, a technique we have previously established to be reliable via comparisons with ICP-MS measurements.(20) Wild type mice (n=2 per formulation) were prepared for blood circulation half-life experiments by shaving their hind limbs and removing the stubble with Nair, a consumer hair removal product, thus exposing the saphenous veins. Nanoparticle-DNA complexes (2:1 NP:DNA molar ratio, 60 μg DNA/mouse), were injected via the tail vein. 10–20 μl of blood were drawn from the saphenous veins of these mice at the following timepoints post-injection: 15 minutes, 30 minutes, 1 hour, 2 hours, 3 hours, 4 hours, 20 hours and 25 hours. The blood was mixed with 40 μl of heparin in pre-weighed vials. The vials were weighed again to determine the volume of blood draws. The blood was centrifuged at 3000 rpm for 7 minutes. 20 μl of the plasma thus isolated was placed in PCR cups and analyzed using the fluorescence imaging system described below. Values were adjusted for the volumes of blood drawn. Half-lives were calculated from analysis of the variance of fluorescence in the Cy5.5 channel over time with the MatLab software package using a biexponential model.
Fluorescence imaging
Fluorescence imaging was performed using a Xenogen IVIS 200 (Alameda, CA). Samples were excited and the photon emission was quantitatively recorded with a Cy5.5 filter set, to visualize the fluorescence of the NIR664 dye. Images were analyzed using software supplied with the instrument.
MR imaging
A 9.4 T MRI system (Bruker Instruments, Billerica, MA) used for mouse imaging in this study. Mice were anesthetized with 4% isoflurane and oxygen and strapped into a special cradle for imaging. The cradle incorporates a gas inlet that allows a continuous isoflurane (1.5–2%) flow can be delivered to maintain anesthesia. Mice were imaged using a gradient echo sequence with the following parameters: Echo time of 5.1 ms, repetition time of 200 ms, field of view of 2.56 × 2.56 cm, matrix size of 128 × 128, 1 mm slice thickness, 10 slices and 32 averages resulting in a scan time of 13 minutes and 39 seconds. Imaging was performed pre- and post-injection with nanoparticle-DNA complexes (2:1 ratio, 60 μg DNA/mouse). Three wild type mice were used per formulation. The resulting images were processed using Osirix.
Results
The nanoparticles were synthesized by dissolving oleic acid coated iron oxide nanoparticles in chloroform. A 20-fold excess of coating materials, poly (maleic anhydride-alt-1-octadecene) substituted with 3-(dimethylamino) propylamine (PMAL), 1% NIR-664 (a fluorophore that absorbs and emits at similar wavelengths to Cy5.5) labeled distearoyl phosphatidyl ethanolamine (DSPE) and varying amounts of PEG2000-DSPE were co-dissolved in the iron oxide chloroform solution. The resulting mixture was added dropwise to a hot (70 °C), stirred solution of deionized water (Figure 1C). This process caused evaporation of the organic solvents, resulting in swift formation of micellar structures with inorganic nanoparticles in the core of some of these polymer/phospholipid aggregates. The polymer coated iron cores were separated from excess coating materials by centrifugation. All procedures were carried out with autoclaved or nuclease free (as supplied from the manufacturer) materials. The advantage of our synthetic procedure is that the iron cores are given a hydrophilic coating, made fluorescent and PEGylated in a single step. Importantly, the quantity of PEG in the coating can be varied by simply varying the input quantity of PEG-DSPE.
Using this synthetic methodology, we formulated four variants, where the proportion of PEG in the nanoparticle coating was 0%, 5%, 10% and 25% (Figure 1B). These nanoparticles are henceforth referred to as 0% PEG, 5% PEG, 10% PEG and 25% PEG. The nanoparticles were characterized for their size by DLS, their zeta potential, their DNA binding ability, stability in serum and effect on cell viability. Phosphorous determination experiments(17) showed that the PEG lipids had been successfully incorporated into the purified nanoparticles and in proportion to their input values (Figure 2E). From calculations based on a lipid headgroup area of 0.603 nm2,(21) there should be 162, 326 and 814 PEG groups/nanoparticle for the 5%, 10% and 25% PEG formulations respectively.
Figure 2.

A–D) Negative stain TEM images of the different nanoparticles. The same scale is used in each image. Insets are a 2× magnification of a region of the main image. E) Phosphorous analysis of the different formulations indicating successful DSPC-PEG inclusion. F) Gel electrophoresis of DNA-NP complexes. G) Effect of incubation with FBS on nanoparticle size.
The hydrodynamic diameters of the particles, as found from DLS experiments, were 28.5 ± 0.2 nm, 35.5 ± 0.5 nm, 43.8 ± 0.4 nm and 48.2 ± 0.9 nm for the 0% PEG, 5% PEG, 10% PEG and 25% PEG nanoparticles, respectively. The general trend is that addition of PEG led to increases in the hydrodynamic diameter of nanoparticles, which is in agreement with previously reported results.(22, 23) Negative stain TEM of the samples (Figure 2A–D) showed the 0% PEG nanoparticles contained one to three iron cores per coating (the coating can be seen as white rims around the particles), while 5% PEG, 10% PEG and 25% PEG particles contained one nanocrystal core exclusively per coating. Image analysis using ImageJ software revealed the size of the cores used to be 20.8 ± 2.8 nm. Little difference in size was observed using negative stain TEM, as the PEG chains are not visualized by the stain.(24)
When incubated for 24 hours with GFP-expressing plasmid DNA, the diameter of the particles increased by 22.0 ± 0.6, 12.5 ± 0.1, 13.6 ± 0.7 and 0.3 ± 0.3 nm for the 0% PEG, 5% PEG, 10% PEG and 25% PEG nanoparticles, respectively. This indicated that the 0–10% PEG nanoparticles bound DNA, whereas the 25% PEG nanoparticles did not. Furthermore, zeta potential measurements showed that the surface charges of the 0% PEG, 5% PEG, 10% PEG and 25% PEG nanoparticles were 8, 16, 4 and −7 mV, respectively. Incubation with DNA decreased the surface charge of the 0% PEG, 5% PEG and 10% PEG nanoparticles by as much as 26 mV, whereas no decrease was observed in the case of the 25% PEG nanoparticle. DNA is a polyanion and therefore when DNA binds to nanoparticles, it is expected that the zeta potential of the particles will drop. Consequently, the zeta potential data further strengthened the case that the 0–10% PEG nanoparticles bound DNA, whereas the 25% PEG nanoparticles did not. From these results, we concluded that 25% PEG in the coating completely prevented DNA-binding and therefore this particle was not studied further.
As a further confirmation of DNA binding, samples of DNA and nanoparticles, incubated together for either 1 hour or 24 hours, were analyzed using electrophoresis on an ethidium bromide impregnated agarose gel (Figure 2F). Ethidium bromide intercalates into free DNA forming a highly fluorescent complex. However, it is common for DNA to enter a condensed form when bound to a nanoparticle. Ethidium bromide is excluded from this condensed form and hence there is little fluorescence when DNA is bound to a nanoparticle.(25, 26) The lack of fluorescence in lanes of this gel revealed the 0% PEG and 5% PEG nanoparticles to bind DNA swiftly, while the 10% PEG nanoparticle required more time to bind to the DNA, as evidenced by the DNA bands being similar for the 10% PEG nanoparticle and free DNA at 1 hour, whereas most of the DNA was bound to the nanoparticles after a 24 hour incubation.
As an initial test of the ability of the PEG included in the nanoparticle coating to prevent opsonization, the nanoparticles were incubated with a 10% fetal bovine serum (FBS) solution. If nanoparticles are susceptible to opsonization, they will form aggregates with the opsonins in serum and an increase in average diameter will be observed.(27) While only minimal increases in diameter were observed for the PEGylated nanoparticles, the diameter of the 0% PEG nanoparticles almost tripled in 24 hours, indicating that they had been heavily opsonized (Figure 2G), demonstrating the value of PEGylation.
The longitudinal relaxivities of the nanoparticles, uncomplexed with DNA, were found to be 5.0 ± 0.3. 6.6 ± 0.1 and 3.0 ± 0.2 mM−1s−1, while the transverse relaxivities were 78.4 ± 4.9, 104.2 ± 4.1 and 58.3 ± 3.6 for the 0% PEG, 5% PEG and 10% PEG nanoparticles respectively.
We found that the nanoparticles did not significantly alter the cell viability (Figure 3A). Uptake of nanoparticles was investigated using MR imaging of cell pellets and TEM imaging of cell sections (Figure 3B and C). Iron oxides cause signal loss in MRI, so the increasing signal in the pellets with increasing amounts of PEG in the nanoparticle indicate a reduction in nanoparticle uptake. The TEM images are representative of the uptake observed in the cells on the grids, and confirm the reduction in nanoparticle uptake with increasing PEGylaton. Seemingly, the effect of PEGylation was to decrease the level of particle uptake, a further indication that the PEGylation will help to avoid recognition by the RES in vivo.
Figure 3.
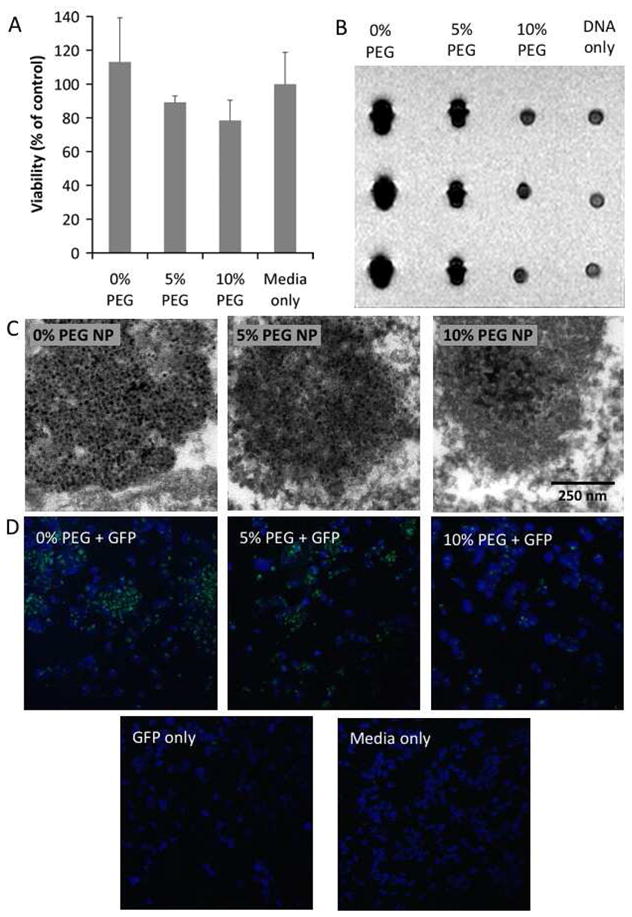
A) Cell viability of the different nanoparticle formulations as expressed as a percentage of cells incubated with media only. B) MR images of pellets of 293T cells incubated under different conditions. The three pellets in each column represents triplicate experiments. C) TEM images depicting nanoparticle uptake in 293T cells. D) Confocal microscopy of GFP transfection of 293T cells where green is GFP and blue is DAPI staining (nuclei).
The in vitro transfection ability of these nanoparticles was tested in 293T cells. Cells were grown on coverslips prior to transfection, while GFP-expressing plasmid DNA was incubated with the nanoparticles in a 1:2 DNA:nanoparticle ratio, for 24 hours prior to the experiment. DNA:nanoparticle complexes were added so that the final concentration of DNA in the wells was 50 ng/ml and incubated with the cells for 6 hours, before the media was refreshed. After a further 18 hours of incubation, the coverslips were washed in PBS, fixed in 4% paraformaldehyde and mounted on slides with DAPI containing media. Confocal microscopy of the resulting slides revealed GFP to be expressed in the cells (Figure 3D), with the level of expression seemingly related to the quantity of nanoparticles taken up.
The nanoparticles were intravenously applied to mice to investigate their circulation half-lives, their effectiveness as MRI and fluorescence imaging contrast agents and their cellular distribution in the liver. In these studies, 60 μg of DNA was complexed with nanoparticles in a 2:1 DNA:nanoparticle ratio. The quantity of nanoparticles is equivalent to a 10 mg Fe/kg dose. Nanoparticle circulation half-lives were determined by sequential blood draws from the saphenous veins of mice, and subsequent fluorescence imaging of the serum, a technique previously established to be reliable.(20) The half-lives of the nanoparticles were observed to increase with increasing PEGylation as the half-lives were 0.2 hours, 0.6 hours and 1.8 hours for the 0% PEG, 5% PEG and 10% PEG nanoparticles, respectively.
The mice (n=3 per nanoparticle formulation) were imaged at the level of the liver using a 9.4 T small animal MRI system, pre- and 24 hours post-injection with nanoparticles. A gradient echo scanning sequence with an echo time of 5.1 ms and repetition time of 200 ms was used. As can be seen in Figure 4A, the injection of the iron oxide nanoparticles resulted in hypointensity in MR images of livers of the mice, which is typical for iron oxide contrast agents. After MR imaging, the mice were sacrificed via exsanguination, perfused with PBS and their livers were excised. Fluorescent imaging in the Cy5.5 channel of the livers of mice injected with the nanoparticles showed a tremendous increase in signal compared to control livers (Figure 4B). Non-color coded images are displayed in Supplemental Figure 2. Each of the three nanoparticle formulations gave similar contrast in livers in these imaging techniques. For transmission electron microscopy (TEM), portions of the livers were fixed in 2.5% glutaraldehyde followed by osmium tetraoxide and stained post-sectioning with 4% uranyl acetate and Reynold’s lead citrate.(19) Imaging these liver sections revealed that the 0% PEG nanoparticles were almost exclusively located in Kupffer cells, the 5% PEG nanoparticles were distributed between the Kupffer cells and the hepatocytes, while the 10% PEG nanoparticles were very frequently found in the hepatocytes, the cells of therapeutic interest (Figure 4C).
Figure 4.

A) MR images of the livers of mice pre- and 24hr post-injection with plasmid carrying iron oxide nanoparticles. B) Cy5.5 channel fluorescence images of liver of mice. C) TEM images of sections of liver tissue indicating the nanoparticle cellular distribution. For each row of images, the scale is indicated on the rightmost image.
In a semi-quantitative measure, we systematically examined hepatocytes through the sections and classified them as nanoparticle positive or negative (positive defined as >20 nanoparticle cores/cell). We found 4%, 58% and 86% of the hepatocytes to be nanoparticle positive for three nanoparticle formulations, confirming the shift in nanoparticle distribution into the hepatocytes upon increasing PEGylation (Figure 5).
Figure 5.

Analysis of TEM images of >150 cells/formulation for hepatocyte uptake.
Discussion
The results show the nanoparticles to be effective MRI, TEM and fluorescence contrast agents. That there was similar contrast produced by these particles in the liver at 24 hours is unsurprising as that timepoint is more than ten times even the longest nanoparticle half-life, and therefore all the nanoparticles should be cleared from the blood into the liver. The PEGylation indeed resulted in extended blood circulation half-lives, avoidance of the RES, i.e. Kupffer cells and penetration into the hepatocytes, improving the potential for delivery of therapeutics to the liver. These results indicate the potential of this system to be used for the delivery of therapeutic nucleic acid material to the liver. The value of using complementary imaging techniques was shown in the liver imaging. MRI and fluorescence imaging allowed imaging at the organ level and showed little differences in signal change for the different nanoparticles. On the other hand, TEM, which allowed imaging at the cellular level, revealed a striking difference in cellular distribution between nanoparticle formulations.
Bryson et al. have reported a system for visualizing gene delivery using MRI and fluorescence techniques via conjugation of gadolinium or europium chelates to polymers,(28) while Oliver et al. have used gadolinium labeled cholesterol and rhodamine in a mixed lipid transfection system.(29) In comparison with our platform, it may prove easier to integrate lanthanide chelates than iron oxide nanoparticles into a wide variety of gene delivery adjuvants and identification of the positive contrast generated by gadolinium in MR images is more straightforward than the negative contrast produced by iron oxides. However, iron oxides produce greater contrast than gadolinium, and are biodegradable,(30) while gadolinium chelates with lengthy residence times have been linked to nephrogenic systemic fibrosis.(31) Furthermore, iron oxide can be identified in TEM images and the fluorophore we used in our study emits in the near-infrared window, the section of the wavelength in which tissue absorbs light the least.(32) In comparison to other iron oxide based systems for nucleic acid delivery,(11, 22, 33) our synthetic procedure is less complicated, more flexible and versatile, and allows for easier control over the nanoparticle coating composition.
Conclusion
In summary, we have synthesized, using a straightforward and facile methodology, a series of fluorescent iron oxide nanoparticles that could be applied for delivery of therapeutics to the liver. We have demonstrated their detection by MR in mice in vivo, by fluorescence and TEM imaging ex vivo, and revealed that these imaging techniques can be used to discern differences in nanoparticle behavior in vivo due to alterations in coating composition. In the current study we show coating of iron oxide nanocrystals, but this coating strategy can just as easily be applied to other nanocrystals, including gold, quantum dots and silica. Lastly, this platform may be applied to the delivery of therapeutics such as proteins, small molecules, DNA, siRNA and microRNA.
Supplementary Material
Acknowledgments
Partial support provided by NIH grants R01 HL71021, R01 HL78667, R01 EB009638 (ZAF) and K99 EB012165 (DPC). We thank the AHA Founder’s Affiliate for Postdoctoral Fellowship 09POST2220194 (DPC) and the Danish Heart Association for studentship 07-10-A1655-22406 (TS). We are grateful to Prof. Edward Fisher (NYU), for his insightful advice.
Footnotes
Contained within the Supporting Information is the chemical structure of the polymer PMAL and unprocessed images (non-color coded) of the livers depicted in Figure 4B. This information is available free of charge via the Internet at http://pubs.acs.org/.
References
- 1.Ferry N, Heard JM. Liver-directed gene transfer vectors. Hum Gene Therapy. 1998;9:1975–1981. doi: 10.1089/hum.1998.9.14-1975. [DOI] [PubMed] [Google Scholar]
- 2.Innerarity TL, Mahley RW, Weisgraber KH, Bersot TP, Krauss RM, Vega GL, Grundy SM, Friedl W, Davignon J, McCarthy BJ. Familial defective apolipoprotein B-100: a mutation of apolipoprotein B that causes hypercholesterolemia. J Lipid Res. 1990;31:1337–1349. [PubMed] [Google Scholar]
- 3.Bacon BR, Olynyk JK, Brunt EM, Britton RS, Wolff RK. HFE genotype in patients with hemochromatosis and other liver diseases. Ann Intern Med. 1999;130:953–962. doi: 10.7326/0003-4819-130-12-199906150-00002. [DOI] [PubMed] [Google Scholar]
- 4.Gooptu B, Ekeowa UI, Lomas DA. Mechanisms of emphysema in {alpha}1-antitrypsin deficiency: molecular and cellular insights. Eur Respir J. 2009;34:475–488. doi: 10.1183/09031936.00096508. [DOI] [PubMed] [Google Scholar]
- 5.Raper SE, Yudkoff M, Chirmule N, Gao GP, Nunes F, Haskal ZJ, Furth EE, Propert KJ, Robinson MB, Magosin S, Simoes H, Speicher L, Hughes J, Tazelaar J, Wivel NA, Wilson JM, Batshaw ML. A pilot study of in vivo liver-directed gene transfer with an adenoviral vector in partial ornithine Transcarbamylase deficiency. Human Gene Therapy. 2002;13:163–175. doi: 10.1089/10430340152712719. [DOI] [PubMed] [Google Scholar]
- 6.Chowdhury NR, Hays RM, Bommineni VR, Franki N, Chowdhury JR, Wu CH, Wu GY. Microtubular disruption prolongs the expression of human bilirubin-uridinediphosphoglucuronate-glucuronosyltransferase-1 gene transferred into Gunn rat livers. J Biol Chem. 1996;271:2341–2346. doi: 10.1074/jbc.271.4.2341. [DOI] [PubMed] [Google Scholar]
- 7.Bloom W, Fawcett DW. A textbook of histology. 11. Saunders; Philadelphia: 1986. [Google Scholar]
- 8.Moghimi SMH, AC, Murray JC. Long-circulating and targetspecific nanoparticles: Theory to practice. Pharmacol Rev. 2001;53:283–318. [PubMed] [Google Scholar]
- 9.Johnsson M, Edwards K. Liposomes, disks, and spherical micelles: Aggregate structure in mixtures of gel phase phosphatidylcholines and poly(ethylene glycol)-phospholipids. Biophysical Journal. 2003;85:3839–3847. doi: 10.1016/S0006-3495(03)74798-5. [DOI] [PMC free article] [PubMed] [Google Scholar]
- 10.Sun D. Nanotheranostics: integration of imaging and targeted drug delivery. Molecular Pharmaceutics. 7:1879–1879. doi: 10.1021/mp1003652. [DOI] [PubMed] [Google Scholar]
- 11.Medarova Z, Pham W, Farrar C, Petkova V, Moore A. In vivo imaging of siRNA delivery and silencing in tumors. Nat Med. 2007;13:372–377. doi: 10.1038/nm1486. [DOI] [PubMed] [Google Scholar]
- 12.Qi LF, Gao XH. Quantum dot–amphipol nanocomplex for intracellular delivery and real-time imaging of siRNA. ACS Nano. 2008;2:1403–1410. doi: 10.1021/nn800280r. [DOI] [PMC free article] [PubMed] [Google Scholar]
- 13.Park JH, von Maltzahn G, Ruoslahti E, Bhatia SN, Sailor MJ. Micellar hybrid nanoparticles for simultaneous magnetofluorescent imaging and drug delivery. Angew Chem Int Ed. 2008;47:7284–7288. doi: 10.1002/anie.200801810. [DOI] [PMC free article] [PubMed] [Google Scholar]
- 14.Wang C, Chen J, Talavage T, Irudayaraj J. Gold nanorod/Fe3O4 nanoparticle “nano-pearl-necklaces” for simultaneous targeting, dual-mode imaging, and photothermal ablation of cancer cells. Angew Chem Int Ed. 2009;48:2759–2763. doi: 10.1002/anie.200805282. [DOI] [PubMed] [Google Scholar]
- 15.Klibanov AL, Maruyama K, Torchilin VP, Huang L. Amphipatic polyethyleneglycols effectively prolong the circulation time of liposomes. FEBS Lett. 1990;268:235–238. doi: 10.1016/0014-5793(90)81016-h. [DOI] [PubMed] [Google Scholar]
- 16.Cormode DP, Chandrasekar R, Delshad A, Briley-Saebo KC, Calcagno C, Barazza A, Mulder WJM, Fisher EA, Fayad ZA. Comparison of synthetic HDL contrast agents for MR imaging of atherosclerosis. Bioconjugate Chem. 2009;20:937–943. doi: 10.1021/bc800520d. [DOI] [PMC free article] [PubMed] [Google Scholar]
- 17.Rouser G, Fleischer S, Yamamoto A. Two dimensional thin layer chromatographic separation of polar lipids and determination of phospholipids by phosphorous analysis of spots. Lipids. 1970;5:494–496. doi: 10.1007/BF02531316. [DOI] [PubMed] [Google Scholar]
- 18.Forte TM, Nordhausen RW. Electron microscopy of negatively stained lipoproteins. Method Enzymol. 1986;128:442–457. doi: 10.1016/0076-6879(86)28086-6. [DOI] [PubMed] [Google Scholar]
- 19.Horak D, Babic M, Jendelova P, Herynek V, Trchova M, Pientka Z, Pollert E, Hajek M, Sykova E. D-Mannose-modified iron oxide nanoparticles for stem cell labeling. Bioconjugate Chem. 2007;18:635–644. doi: 10.1021/bc060186c. [DOI] [PubMed] [Google Scholar]
- 20.van Schooneveld MM, Vucic E, Koole R, Zhou Y, Stocks J, Cormode DP, Tang CY, Gordon R, Nicolay K, Meijerink A, Fayad ZA, Mulder WJM. Improved biocompatibility and pharmacokinetics of silica nanoparticles by means of a lipid coating: a multimodality investigation. Nano Lett. 2008;8:2517–2525. doi: 10.1021/nl801596a. [DOI] [PubMed] [Google Scholar]
- 21.Smondyrev AM, Berkowitz ML. Molecular dynamics simulation of fluorination effects on a phospholipid bilayer. J Chem Phys. 1999;111:9864–9870. [Google Scholar]
- 22.Lee JH, Lee K, Moon SH, Lee Y, Park TG, Cheon J. All-inone target-cell-specific magnetic nanoparticles for simultaneous molecular imaging and siRNA delivery. Angew Chem Int Ed. 2009;48:4174–4179. doi: 10.1002/anie.200805998. [DOI] [PubMed] [Google Scholar]
- 23.Cormode DP, Skajaa T, van Schooneveld MM, Koole R, Jarzyna P, Lobatto ME, Calcagno C, Barazza A, Gordon RE, Zanzonico P, Fisher EA, Fayad ZA, Mulder WJM. Nanocrystal core high-density lipoproteins: A multimodal molecular imaging contrast agent platform. Nano Lett. 2008;8:3715–3723. doi: 10.1021/nl801958b. [DOI] [PMC free article] [PubMed] [Google Scholar]
- 24.Huang X, Bronstein LM, Retrum J, DuFort C, Tsvetkova I, Aniagyei S, Stein B, Stucky G, McKenna B, Remmes N, Baxter D, Kao CC, Dragnea B. Self-assembled virus-like particles with magnetic cores. Nano Lett. 2007;7:2407–2416. doi: 10.1021/nl071083l. [DOI] [PubMed] [Google Scholar]
- 25.Wiethoff CM, Gill ML, Koe GS, Koe JG, Middaugh CR. A fluorescence study of the structure and accessibility of plasmid DNA condensed with cationic gene delivery vehicles. J Pharm Sci. 2003;92:1272–1285. doi: 10.1002/jps.10391. [DOI] [PubMed] [Google Scholar]
- 26.de Ilarduya CT, Arangoa MA, Duzgunes N. Methods in Enzymology. Academic Press; 2003. Transferrin-lipoplexes with protamine-condensed DNA for serum-resistant gene delivery; pp. 342–356. [DOI] [PubMed] [Google Scholar]
- 27.Owens DE, Peppas NA. Opsonization, biodistribution, and pharmacokinetics of polymeric nanoparticles. Int J Pharm. 2006;307:93–102. doi: 10.1016/j.ijpharm.2005.10.010. [DOI] [PubMed] [Google Scholar]
- 28.Bryson JM, Fichter KM, Chu WJ, Lee JH, Li J, Madsen LA, McLendon PM, Reineke TM. Polymer beacons for luminescence and magnetic resonance imaging of DNA delivery. Proc Natl Acad Sci USA. 2009;106:16913–16918. doi: 10.1073/pnas.0904860106. [DOI] [PMC free article] [PubMed] [Google Scholar]
- 29.Oliver M, Ahmad A, Kamaly N, Perouzel E, Caussin A, Keller M, Herlihy A, Bell J, Miller AD, Jorgensen MR. MAGfect: a novel liposome formulation for MRI labelling and visualization of cells. Org Biomol Chem. 2006;4:3489–3497. doi: 10.1039/b605394g. [DOI] [PubMed] [Google Scholar]
- 30.Bulte JWM, Kraitchman DL. Iron oxide MR contrast agents for molecular and cellular imaging. NMR Biomed. 2004;17:484–499. doi: 10.1002/nbm.924. [DOI] [PubMed] [Google Scholar]
- 31.Sieber MA, Pietsch H, Walter J, Haider W, Frenzel T, Weinmann HJ. A preclinical study to investigate the development of nephrogenic systemic fibrosis: A possible role for gadolinium-based contrast media. Invest Radiol. 2008;43:65–75. doi: 10.1097/RLI.0b013e31815e6277. [DOI] [PubMed] [Google Scholar]
- 32.Sosnovik D, Weissleder R. Magnetic resonance and fluorescence based molecular imaging technologies. Progress Drug Res. 2005;62:86–114. doi: 10.1007/3-7643-7426-8_3. [DOI] [PubMed] [Google Scholar]
- 33.Kievit FM, Veiseh O, Bhattarai N, Fang C, Gunn JW, Lee DH, Ellenbogen RG, Olson JM, Zhang M. PEI–PEG–chitosancopolymer-coated iron oxide nanoparticles for safe gene delivery: synthesis, complexation, and transfection. Adv Funct Mater. 2009;19:2244–2251. doi: 10.1002/adfm.200801844. [DOI] [PMC free article] [PubMed] [Google Scholar]
Associated Data
This section collects any data citations, data availability statements, or supplementary materials included in this article.