

Sequence analyses of endangered orang-utan species
The genome of the Southeast Asian great ape or orang-utan has been sequenced — specifically a draft assembly of a Sumatran female individual and short-read sequence data from five further Sumatran and five Bornean orang-utan, Pongo abelii and Pongo pygmaeus, respectively. Orang-utan species appear to have split around 400,000 years ago, more recent than most previous estimates suggested, resulting in an average Bornean–Sumatran nucleotide identity of 99.68%. Structural evolution of the orang-utan genome seems to have proceeded much more slowly than that of other great apes, including chimpanzees and humans. With both orang-utan species on the endangered list, the authors hope that knowledge of the genome sequence and its variation between populations will provide a valuable resource for conservationists.
Supplementary information
The online version of this article (doi:10.1038/nature09687) contains supplementary material, which is available to authorized users.
Subject terms: Evolutionary genetics, Comparative genomics
The genome of the southeast Asian orang-utan has been sequenced. The draft assembly of a Sumatran individual alongside sequence data from five Sumatran and five Bornean orang-utan genomes is presented. The resources and analyses described offer new opportunities in evolutionary genomics, insights into hominid biology, and an extensive database of variation for conservation efforts.
Supplementary information
The online version of this article (doi:10.1038/nature09687) contains supplementary material, which is available to authorized users.
Abstract
‘Orang-utan’ is derived from a Malay term meaning ‘man of the forest’ and aptly describes the southeast Asian great apes native to Sumatra and Borneo. The orang-utan species, Pongo abelii (Sumatran) and Pongo pygmaeus (Bornean), are the most phylogenetically distant great apes from humans, thereby providing an informative perspective on hominid evolution. Here we present a Sumatran orang-utan draft genome assembly and short read sequence data from five Sumatran and five Bornean orang-utan genomes. Our analyses reveal that, compared to other primates, the orang-utan genome has many unique features. Structural evolution of the orang-utan genome has proceeded much more slowly than other great apes, evidenced by fewer rearrangements, less segmental duplication, a lower rate of gene family turnover and surprisingly quiescent Alu repeats, which have played a major role in restructuring other primate genomes. We also describe a primate polymorphic neocentromere, found in both Pongo species, emphasizing the gradual evolution of orang-utan genome structure. Orang-utans have extremely low energy usage for a eutherian mammal1, far lower than their hominid relatives. Adding their genome to the repertoire of sequenced primates illuminates new signals of positive selection in several pathways including glycolipid metabolism. From the population perspective, both Pongo species are deeply diverse; however, Sumatran individuals possess greater diversity than their Bornean counterparts, and more species-specific variation. Our estimate of Bornean/Sumatran speciation time, 400,000 years ago, is more recent than most previous studies and underscores the complexity of the orang-utan speciation process. Despite a smaller modern census population size, the Sumatran effective population size (Ne) expanded exponentially relative to the ancestral Ne after the split, while Bornean Ne declined over the same period. Overall, the resources and analyses presented here offer new opportunities in evolutionary genomics, insights into hominid biology, and an extensive database of variation for conservation efforts.
Supplementary information
The online version of this article (doi:10.1038/nature09687) contains supplementary material, which is available to authorized users.
Main
Orang-utans are the only primarily arboreal great apes, characterized by strong sexual dimorphism and delayed development of mature male features, a long lifespan (35–45 years in the wild, more than 55 years in captivity) and the longest interbirth interval among mammals (8 years on average)2. Orang-utans create and adeptly use tools in the wild, and while long presumed socially solitary, dense populations of Sumatran orang-utans show complex social structure and geographic variability in tool use indicative of cultural learning3. Both species have been subject to intense population pressure from loss of habitat, deforestation, hunting and disease. A 2004 study estimated that 7,000–7,500 Sumatran individuals and 40,000–50,000 Bornean individuals remained in the wild in fragmented subpopulations4,5. The International Union for Conservation of Nature lists Sumatran orang-utans as critically endangered and Bornean orang-utans as endangered.
We sequenced the genome of a female Sumatran orang-utan using a whole-genome shotgun strategy. The assembly provides 5.5-fold coverage on average across 3.08 gigabases (Gb) of ordered and oriented sequence (Table 1) (Supplementary Information section 1). Accuracy was assessed by several metrics, including comparison to 17 megabases (Mb) of finished bacterial artificial chromosome (BAC) sequences and a novel method of detecting spurious insertions and deletions (Supplementary Information section 2). Further validation resulted from orang-utan–human divergence estimates based on alignment of whole-genome shotgun reads to the human reference (Hs.35; Fig. 1, Supplementary Information section 3). We also sequenced the genomes of 10 additional unrelated wild-caught orang-utans, five Sumatran and five Bornean, using a short read sequencing platform (297 Gb of data in total; Supplementary Information section 4). The orang-utan gene set was constructed using a combination of human gene models and orang-utan complementary DNA data generated for this project (available at http://www.ensembl.org/Pongo_pygmaeus/Info/StatsTable; see also Supplementary Information section 5).
Table 1.
Sumatran orang-utan assembly statistics
| Total contig bases | 3.09 Gb |
|---|---|
| Total contig bases >Phred Q20 | 3.05 Gb (98.5%) |
| Ordered/oriented contigs and scaffolds | 3.08 Gb |
| Number of contigs >1 kb | 410,172 |
| N50 contig length | 15.5 kb |
| N50 contig number | 55,989 |
| Number of scaffolds >2 kb | 77,683 |
| N50 scaffold length | 739 kb |
| N50 scaffold number | 1,031 |
| Average read depth | 5.53× |
Q20 refers to a score of 20 on the Phred scale of base quality scores; here we present the total number of bases in the assembly with a Phred score greater than 20 (3.05 Gb, which is 98.5% of assembled bases). N50 refers to a length-weighted median such that 50% of the genome is contained in contigs or scaffolds of the indicated size or greater.
Figure 1. Divergence among great apes, a small ape, and an Old World monkey with respect to humans.
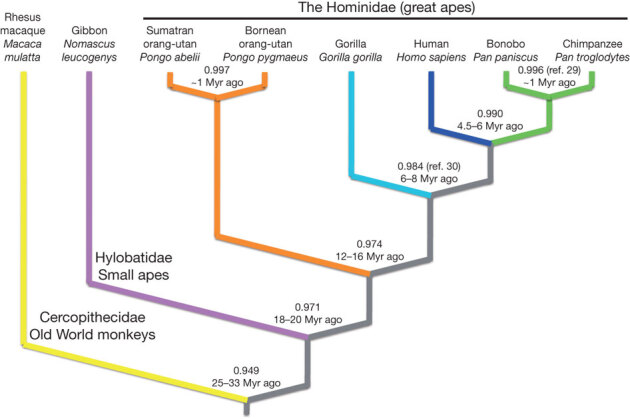
We estimated nucleotide divergence in unique gap-free sequence, indicated at each node, from the alignment of rhesus macaque (yellow), gibbon (purple), orang-utan (orange), gorilla (aqua), chimpanzee (green) and human (blue) whole genome shotgun reads to the human reference (Hs.35; Supplementary Information section 3). Note that the Bornean (P. pygmaeus) and Sumatran (P. abelii) orang-utan species showed nucleotide identity comparable to that of bonobo (Pan paniscus) and chimpanzee (Pan troglodytes). Estimates of divergence time based on sequence identity are indicated at each node, ∼1 Myr implies approximately 1 Myr or less. Values taken from refs 29 and 30 where indicated.
Among hominids, the orang-utan karyotype is the most ancestral6, and sequencing the orang-utan genome allowed a comprehensive assessment of conservation among the wide range of rearrangement types and sequence classes involved in structural variation. We characterized orang-utan synteny breaks in detail cytogenetically in concert with an in silico approach that precisely tracked rearrangements between primate (human, chimpanzee, orang-utan and rhesus macaque) and other mammalian assemblies (mouse, rat and dog) (Supplementary Information section 6). Alignment-level analyses at 100 kilobase (kb) and 5 kb resolution found that the orang-utan genome underwent fewer rearrangements than the chimpanzee or human genomes, with a bias for large-scale events (>100 kb) on the chimpanzee branch (Table 2). Orang-utan large-scale rearrangements were further enriched for segmental duplications (52%) than for small-scale events (27%), suggesting that mechanisms other than non-allelic homologous recombination may have made a greater contribution to small rearrangements. Genome-wide, we estimated less segmental duplication content (3.8% total) in the orang-utan genome compared to the chimpanzee and human genomes (5%) using equivalent methods (Supplementary Information section 11). We also assessed the rate of turnover within gene families as an additional measure of genome restructuring (Supplementary Information section 12). Our analysis indicated that the human and chimpanzee lineages, as well as their shared ancestral lineage after the orang-utan split, had the highest rates of gene turnover among great apes (0.0058 events per gene per Myr)—more than twice the rate of the orang-utan and macaque lineages (0.0027)—even as the nucleotide substitution rate decreased7. Collectively, these data strongly suggest that structural evolution proceeded much more slowly along the orang-utan branch, in sharp contrast to the acceleration of structural variation noted for the chimpanzee and human genomes8,9.
Table 2.
Number of genome rearrangements by species
| Species | Rearrangements >100 kb | Rearrangements >5 kb |
|---|---|---|
| Orang-utan | 38 | 861 |
| Chimpanzee | 85 (+124%) | 1,095 (+27%) |
| Human | 54 (+42%) | 1,238 (44%) |
The number in parentheses indicates the percentage change with respect to the orang-utan genome. Note 40 events >100 kb and 532 events >5 kb were assigned to the human-chimpanzee ancestor by ancestral reconstruction (Supplementary Information section 6).
One structural variant that we characterized in detail was a previously described polymorphic ‘pericentric inversion’ of orang-utan chromosome 12 (ref. 10). Surprisingly, both forms of this chromosome showed no difference in marker order by fluorescence in situ hybridization (FISH) despite two distinct centromere positions—the hallmark of a neocentromere (Fig. 2; Supplementary Information section 8). Neocentromere function was confirmed by chromatin immunoprecipitation with antibodies to centromeric proteins CENP-A and CENP-C and subsequent oligo array hybridization (ChIP-on-chip), which narrowed the neocentromere to a ∼225 kb gene-free window devoid of α satellite-related sequences. Our observations bore similarity to a recently described centromere repositioning event in the horse genome11; however, this is to our knowledge the first observation of such a variant among primates, with the additional complexity of polymorphism in two closely related species. Potentially related, orang-utan chromosome 12 did not show any appreciable centromeric alphoid FISH signal in comparison to other autosomes. The neocentromere most probably arose before the Bornean/Sumatran split as it is found in both species, and represents a unique opportunity to study the initial stages of centromere formation and the impact of such a large chromosomal variant on population variation and recombination.
Figure 2. The neocentromere of orang-utan chromosome 12.

Note the identical order of four sequentially arranged BAC-derived FISH probes indicated in yellow, blue, green and red (given in Supplementary Information section 8) between the normal (a) and neocentromere-bearing (b) configurations of orang-utan chromosome 12, despite discordant centromere positions. The left image of a and the right image of b are DAPI-only images that show the primary constriction of both chromosomal forms, indicated by the arrows. The neocentromere recruits centromeric proteins CENP-A and CENP-C and lies within a ∼225 kb gene-free and α satellite-free region. The neocentromere-bearing variant is polymorphic in both Bornean and Sumatran populations, suggesting the neocentromere arose before the Bornean/Sumatran split, yet has not been fixed in either species.
The orang-utan genome has a comparable cadre of mobile elements to that of other primates, comprising roughly half the genome12,13,14. Orang-utan long interspersed element 1 (LINE1; L1) and SVA (SINE-R, VNTR and Alu) element expansions were expectedly broad, with roughly 5,000 and 1,800 new insertions respectively, consistent with other primates (Supplementary Information section 9). Surprisingly, Alu elements were relatively quiescent, with only ∼250 recent insertions identified by computational and laboratory approaches (Fig. 3). By comparison, 5,000 human-specific and 2,300 chimpanzee-specific Alu elements were identified by similar methods. The rate of processed pseudogene formation, which like Alu insertion requires functional L1 machinery15, was similar for the human (8.0 per Myr), chimpanzee (12.7 per Myr) and orang-utan (11.6 per Myr) lineages (Supplementary Information section 10). We identified a small number of polymorphic Alu elements exclusive to P. abelii (Supplementary Information section 19), indicating that Alu retroposition has been strongly limited, but not eliminated. This dramatic Alu-specific repression represents an unprecedented change in primate retrotransposition rates16,17. Possible explanations include L1 source mutations that lowered Alu affinity and cis mobilization preference18, pressure against Alu retroposition from the APOBEC RNA editing family19, or fixation of less effectively propagated Alu ‘master’ variants.
Figure 3. Alu quiescence in the orang-utan lineage.

We identified only ∼250 lineage-specific Alu retroposition events in the orang-utan genome, a dramatically lower number than that of other sequenced primates, including humans. The total number of lineage-specific L1, SVA and Alu insertions is shown (pie chart) at the terminus of each branch of the phylogeny of sequenced great apes shown in grey at left, along with the rate of insertion events per element type (bar graph). Reduced Alu retroposition potentially limited the effect of a wide variety of repeat-driven mutational mechanisms in the orang-utan lineage that played a major role in restructuring other primate genomes.
It is tempting to propose a correlation between reduced Alu retroposition and the greater structural stability of the orang-utan genome. More than 106 Alu elements exist within primate genomes. Because of their large copy number and high sequence identity, Alu repeats play a crucial role in multiple forms of structural variation through insertion and post-insertion recombination20. By virtue of reduced Alu retroposition, the orang-utan lineage experienced fewer new insertions and a putative decrease in the number of regions susceptible to post-insertion Alu-mediated recombination events genome-wide, limiting the overall mobile element threat to the genome.
The unique phylogenetic position of Pongo species also offered the opportunity to detect signals of positive selection with increased power. We assessed positive selection in 13,872 human genes with high-confidence orthologues in the orang-utan genome, and in one or more of the chimpanzee, rhesus macaque and dog genomes, using branch-site likelihood ratio tests (Supplementary Information section 15)14,21. Two new Gene Ontology categories were statistically enriched for positive selection in primates: ‘visual perception’ and ‘glycolipid metabolic processes’22. The enrichment for visual perception includes strong evidence from two major visual signalling proteins: arrestin (SAG, P = 0.007) and recoverin (RCVRN, P = 0.008), as well as the opsin, OPN1SW1 (P = 0.020), associated with blue colour vision23. The enrichment for glycolipid metabolism is particularly intriguing owing to medium-to-strong evidence for positive selection (nominal P < 0.05) from six genes expressed in nervous tissue that cluster in the cerebroside-sulphatid region of the sphingolipid metabolism pathway (Fig. 4). This pathway is associated with human neurodegenerative diseases such as Gaucher’s, Sandhoff’s, Tay-Sachs, and metachromatic leukodystrophy. Variation in lipid metabolism may have affected neurological evolution among primates, and diversity of diets and life history strategies, as apes—especially orang-utans—have slower rates of reproduction and dramatically lower energy usage than other primates and mammals1.
Figure 4. Enrichment for positive selection in the cerebroside-sulphatid metabolism pathway.

We identified six genes (indicated in yellow) under moderate to strong positive selection in primates (P < 0.05) that fall within the cerebroside-sulphatid region of the sphingolipid metabolism pathway (adapted from human KEGG pathway 00600). This pathway is associated with several human lysosomal storage disorders, such as Gaucher’s disease, Sandhoff’s disease, Tay-Sachs disease and metachromatic leukodystrophy. Abbreviations, annotations and connections are presented in accordance with KEGG standards: solid lines represent direct relationships between enzymes (boxes) and metabolites (circular nodes), dashed lines represent indirect relationships, arrowheads denote directionality (see http://www.genome.jp/kegg-bin/show_pathway?map00600 for further details).
Ancestral orang-utan species ranged broadly across southeast Asia, including the mainland, while modern species are geographically restricted to their respective islands owing to environmental forces and human population expansion. Historically, protein markers, restriction fragment length polymorphisms, and small sets of mitochondrial and nuclear markers have been used to estimate the divergence and diversity of orang-utan species. We used short read sequencing to address this question from a genome-wide perspective. We first estimated average Bornean/Sumatran nucleotide identity genome-wide (99.68%) based on the alignment of 20-fold coverage of short read data from a Bornean individual to the Sumatran reference (Supplementary Information section 16). We then called single nucleotide polymorphisms (SNPs) from the alignment of all short read data from 10 individuals (five Bornean, including the 20-fold coverage mentioned above, and five Sumatran) (Supplementary Information section 4). We analysed each species separately using a Bayesian approach with 92% power to detect SNPs (Supplementary Information section 20). Because of relatively deep sequencing, allele frequency spectra were estimated accurately, but with an overestimation of singletons compared to other allele frequency categories of approximately 7.8% based on re-sequencing a subset of SNPs (n = 108) (Supplementary Information section 20). This level of error had only a marginal effect on downstream population genetic analyses (Supplementary Information section 21). Overall, 99.0% (931/940) of genotypes were accurately called within the re-sequenced subset of SNPs.
In total, we identified 13.2 × 10⁶ putative SNPs across 1.96 Gb of the genome, or 1 SNP every 149 base pair (bp) on average. Within the Bornean and Sumatran groups we detected 6.69 ×10⁶ (3.80 ×10⁶ Bornean-exclusive) and 8.96 ×10⁶ (5.19 ×10⁶ Sumatran-exclusive) SNPs, respectively (Fig. 5). Observing 36% more SNPs among Sumatran individuals strongly supports a larger Ne. In addition, independent analysis of 85 polymorphic retroelement loci among 37 individuals (19 Sumatran, 18 Bornean) also showed more complex Sumatran population structure (Supplementary Information section 19). Using Watterson’s approach24, we estimated nucleotide diversity from the SNP data as θW = 1.21 and θW = 1.62 per kb for the Bornean and Sumatran species, respectively, and θW = 1.89 per kb for the orang-utan species combined, roughly twice the diversity of modern humans25.
Figure 5. Orang-utan population genetics and demographics.

a, Site-frequency spectra for 13.2 × 10⁶ Bornean (red) and Sumatran (blue) SNPs are shown based on the ascertainment of 10 chromosomes per species; note the enrichment of low-frequency SNPs among Sumatran individuals. b, The majority of SNPs were restricted to their respective island populations as the ‘heat’ of the two-dimensional site-frequency spectra, representing high allele counts, lay along the axes. c, Our demographic model estimated that the ancestral orang-utan population (Ne = 17,900) split approximately 400,000 years ago, followed by exponential expansion of Sumatran Ne and a decline of Bornean Ne, culminating in higher diversity among modern Sumatran orang-utans despite a lower census population size. The model also supported low-level gene flow (<1 individual per generation), indicated by arrows.
The modal category of SNPs were singletons, with 2.0 ×10⁶ and 3.7 ×10⁶ SNPs observed as single heterozygous sites in a Bornean or Sumatran individual, consistent with the expectation that most genetic variation for an outcrossing population ought to be rare due to mutation-drift equilibrium. We observed little correlation between Bornean and Sumatran SNPs in the allele frequency spectra (that is, the ‘heat’ of the map is not along the diagonal as expected for populations with similar allele frequencies, but rather along the edges) (Fig. 5b). This was further supported by principal component analysis, in which PC1 corresponded to the Bornean/Sumatran population label and explained 36% of the variance (Supplementary Information section 20).
On the basis of these data, our demographic model consisted of a two-population model with divergence and potential migration, growth and difference in population size (Supplementary Information section 21). Among several models tested, we found very strong statistical support (105 log-likelihood units) for the most complex model, which included a split with growth and subsequent low-level migration. We estimated a relative Ne of 210% for Sumatran orang-utans relative to the ancestral and 49% for Bornean orang-utans, noting a fourfold difference for the derived populations (Fig. 5c). Assuming a mutation rate of 2.0 × 10⁻⁸ and 20 years per generation, we estimated an ancestral Ne of 17,900 and a split time of 400,000 years ago.
Parallel to the SNP-based effort, we employed a coalescent hidden Markov model (coal-HMM) approach to estimate speciation time, recombination rate and ancestral Ne from the alignment of 20-fold coverage of a Bornean individual to the Sumatran reference (Supplementary Information section 17). This method also supported a relatively recent Bornean/Sumatran speciation time (334 ± 145 kyr ago), and estimated a recombination rate of 0.95 ± 0.72 cM Mb−1. We independently estimated the ancestral Ne of the autosomes (26,800 ± 6,700) and the X chromosome (20,400 ± 7,400), which was consistent with the theoretical 3/4 effective population size of X chromosomes compared to autosomes. The Bornean and Sumatran X chromosome thus diverged as expected, in contrast to the human–chimpanzee speciation process26,27.
The orang-utan story is thus a tale of two islands with distinct evolutionary histories. Our high-resolution population studies explored the counter-intuitive nature of orang-utan diversity—greater variation among Sumatran orang-utans than their Bornean counterparts despite a smaller population size (approximately sevenfold lower by recent estimates). Further dissection of the orang-utan speciation process will require a broader survey, incorporating representatives from additional orang-utan subpopulations.
Finally, even though we found deep diversity in both Bornean and Sumatran populations, it is not clear whether this diversity will be maintained with continued habitat loss and population fragmentation. Evidence from other species suggests fragmentation is not the death knell of diversity28, but their slow reproduction rate and arboreal lifestyle may leave orang-utan species especially vulnerable to rapid dramatic environmental change. It is our hope that the genome assembly and population variation data presented here provide a valuable resource to the community to aid the preservation of these precious species.
Methods Summary
Whole-genome sequencing was performed as described previously12,13,14. The genome assembly was constructed with a custom computational pipeline (Supplementary Information section 1). Assembly source DNA was derived from a single Sumatran female (Susie; Studbook no. 1044; ISIS no. 71), courtesy of the Gladys Porter Zoo, Brownsville, Texas. Short fragment sequencing libraries for population studies (Supplementary Information section 4) were constructed in accordance with standard Illumina protocols and sequenced on the Illumina GAIIx platform. The resulting data were processed with Illumina base-calling software and analysed using custom computational pipelines. See Supplementary Information for additional details.
Supplementary information
This file contains Supplementary Information, Sections 1-22 (see Table of Contents), which include Supplementary Figures with legends, Supplementary Tables, Supplementary Methods and additional references. (PDF 11307 kb)
This spreadsheet provides a general description of each cDNA data set generated for this project, as well as an internal experiment ID, flow cell ID, submission date and a Short Read Archive accession number. (XLS 24 kb)
This spreadsheet provides a general description of each short read genomic DNA data set generated for this project, including species (Bornean/Sumatran), individual identification number, sex, flow cell ID, a description of the data type (read length and whether paired end or fragment data), and a Short Read Archive accession number for each lane of data. (XLS 31 kb)
This file contains data with regard to variation in mean dS along the length of human chromosome 1, referenced in Supplemental Information section S7 (XLS 20 kb)
This file contains data with regard to variation in mean dS along the length of orangutan chromosome 1, referenced in Supplemental Information section S7. (XLS 21 kb)
This file contains data with regard to variation in dS in relation to genomic position and distance from structural elements of the genome (centromeres and telomeres) and rearranged regions of the genome, referenced in Supplemental information section S7. (XLS 161 kb)
This file contains data with regard to variation in dS along the orangutan branch and hominid branch on a chromosome-by-chromosome basis, referenced in Supplemental Information section S7. (XLS 93 kb)
This file contains data with regard to the effect of GC content on evolutionary rate variation in telomeric regions, in association with Supplemental Information section S7. (XLS 50 kb)
Acknowledgements
The orang-utan genome project was funded by the National Human Genome Research Institute (NHGRI), including grants U54 HG003079 (R.K.W.) and U54 HG003273 (R.A.G), with further support from National Institutes of Health R01 GM59290 (M.A.B.), PO1 AG022064 (M.A.B.), HG002385 (E.E.E.) and HG002238 (W.M.), National Science Foundation DBI-0644111 (A.S. and B.B.), David and Lucile Packard Foundation (A.S., V.T. and T.V.), Cornell University Provost’s Fellowship (A.L.M.), UK Medical Research Council (C.P.P., G.L., S.M. and A.H.), Marie Curie Fellowship (T.M.-B.), Ministerio de Ciencia e Innovación-Spain (MCI-Spain) and Fundación M. Botín (V.Q., X.S.P., G.R.O. and C.L.-O.), MCI-Spain BFU2006-15413-C02-01 and BFU2009-13409-C02-02 (A.N.), Spanish National Institute for Bioinformatics (INAB) and Fundação para a Ciência e a Tecnologia (Portugal), SFRH/BPD/26384/2006 (R.F.) and SFRH/BD/15856/2005 (O.F.), PRIN and CEGBA (M.R., N.A. and G.D.V.), and the Commission of the European Communities IRG-224885 (T.V.), IRG-231025 (B.B.). We thank the Gladys Porter Zoo, and S. O’Brien and S. Pääbo for use of orang-utan samples. D.P.L. thanks S. D. McGrath, A. Wollam, R. M. Abbott and L. Chemnick for technical assistance. We acknowledge all the important work that could not be cited owing to space limitations. Resources for exploring the orang-utan genome are available at UCSC (http://genome.ucsc.edu), Ensembl (http://www.ensembl.org), NCBI (http://ncbi.nlm.nih.gov) and The Genome Center at Washington University (http://genome.wustl.edu/genomes/view/pongo_abelii/).
PowerPoint slides
Author Contributions
D.P.L. led the project and manuscript preparation. D.P.L., A.S., T.M.-B., C.P.P., M.A.B., A.N., E.E.E., M.W.H., C.L.-O., C.D.B., J.M. and M.H.S. led the analyses. Sanger data production, assembly construction, testing and submission: L.W.H, W.C.W., S.-P.Y., Z.W., A.T.C., P.M., M.M., L.A.F., R.A.F., J.O.N., C.P., K.C.W, L.V.N., D.M.M., A.C., H.H.D., J.H., C.L.K., G.R.F. and J.R. BAC sequencing: T.A.G. 454 cDNA sequencing: V.M. and C.M. Illumina sequencing: L.C., K.D.D. and C.F. SNP validation: H.S. Indel assessment: G.L., S.M., A.H. and C.P.P. Segmental duplication, divergence and structural variation studies: T.M.-B., C.A., L.C., Z.C., J.M.K. and E.E.E. Gene models: S.W., S.S. and A.J.V. Assembly-based SNPs: Y.C. and P.F. Ancestral reconstruction and rearrangement analyses: J.M., B.R., B.S., R.B., J.H., D.H., R.S.H. and W.M. Regional variation in nucleotide divergence analyses: R.F., O.F., F.D., D.F., E.G., M.O. and A.N. Cytogenetics and neocentromere characterization: R.R., O.C., N.A., G.D.V., S.P and M.R. Repeat analyses: M.K.K., J.A.W., B.U., M.A.B., A.F.A.S. and R.H. Gene family evolution analyses: C.C., D.R.S. and M.W.H. Protease gene family studies: V.Q., X.S.P., G.R.O. and C.L.-O. Orthologue and defensin analyses: T.V., B.B., A.R. and W.M. Positive selection analyses: C.K., T.V., H.A.L., V.T., A.L.M. and A.S. Short read alignments, SNP calling and population genetics: A.R., X.M., J.D. and C.D.B. Demographic analyses: R.N.G. Coalescent-HMM analyses: T.M., J.Y.D., A.H. and M.H.S. Orang-utan samples for diversity sequencing: O.A.R. BAC library construction: Y.Y. and P.J.d.J. Principal investigators: G.M.W., E.R.M., R.A.G. and R.K.W.
Accession codes
Primary accessions
DDBJ/GenBank/EMBL
Data deposits
The P. abelii whole-genome shotgun project has been deposited in DDBJ/EMBL/GenBank under the project accession ABGA00000000. The version described in this Letter is ABGA00000000.1. Assembly-based SNPs and SNPs derived from short read sequence data have been deposited in dbSNP. All short read data have been deposited into the Short Read Archive (http://www.ncbi.nlm.nih.gov/sra) under accessions listed in Supplementary Information.
Competing interests
The authors declare no competing financial interests.
Contributor Information
Devin P. Locke, Email: dlocke@wustl.edu
Wesley C. Warren, Email: wwarren@wustl.edu
References
- 1.Pontzer H, Raichlen DA, Shumaker RW, Ocobock C, Wich SA. Metabolic adaptation for low energy throughput in orangutans. Proc. Natl Acad. Sci. USA. 2010;107:14048–14052. doi: 10.1073/pnas.1001031107. [DOI] [PMC free article] [PubMed] [Google Scholar]
- 2.van Noordwijk MA, van Schaik CP. Development of ecological competence in Sumatran orangutans. Am. J. Phys. Anthropol. 2005;127:79–94. doi: 10.1002/ajpa.10426. [DOI] [PubMed] [Google Scholar]
- 3.van Schaik CP, et al. Orangutan cultures and the evolution of material culture. Science. 2003;299:102–105. doi: 10.1126/science.1078004. [DOI] [PubMed] [Google Scholar]
- 4.Singleton, I. et al. Orangutan Population and Habitat Viability Assessment: Final Report (IUCN/SSC Conservation Breeding Specialist Group, Apple Valley, 2004)
- 5.Meijaard E, Wich S. Putting orang-utan population trends into perspective. Curr. Biol. 2007;17:R540. doi: 10.1016/j.cub.2007.05.016. [DOI] [PubMed] [Google Scholar]
- 6.Stanyon R, et al. Primate chromosome evolution: ancestral karyotypes, marker order and neocentromeres. Chromosome Res. 2008;16:17–39. doi: 10.1007/s10577-007-1209-z. [DOI] [PubMed] [Google Scholar]
- 7.Yi S, Ellsworth DL, Li WH. Slow molecular clocks in Old World monkeys, apes, and humans. Mol. Biol. Evol. 2002;19:2191–2198. doi: 10.1093/oxfordjournals.molbev.a004043. [DOI] [PubMed] [Google Scholar]
- 8.Hahn MW, Demuth JP, Han SG. Accelerated rate of gene gain and loss in primates. Genetics. 2007;177:1941–1949. doi: 10.1534/genetics.107.080077. [DOI] [PMC free article] [PubMed] [Google Scholar]
- 9.Marques-Bonet T, et al. A burst of segmental duplications in the genome of the African great ape ancestor. Nature. 2009;457:877–881. doi: 10.1038/nature07744. [DOI] [PMC free article] [PubMed] [Google Scholar]
- 10.Seuanez H, Fletcher J, Evans HJ, Martin DE. A chromosome rearrangement in orangutan studied with Q-, C-, and G-banding techniques. Cytogenet. Cell Genet. 1976;17:26–34. doi: 10.1159/000130684. [DOI] [PubMed] [Google Scholar]
- 11.Wade CM, et al. Genome sequence, comparative analysis, and population genetics of the domestic horse. Science. 2009;326:865–867. doi: 10.1126/science.1178158. [DOI] [PMC free article] [PubMed] [Google Scholar]
- 12.The Chimpanzee Sequencing and Analysis Consortium. Initial sequence of the chimpanzee genome and comparison with the human genome. Nature437, 69–87 (2005) [DOI] [PubMed]
- 13.International Human Genome Sequencing Consortium Initial sequencing and analysis of the human genome. Nature. 2001;409:860–921. doi: 10.1038/35057062. [DOI] [PubMed] [Google Scholar]
- 14.Gibbs RA, et al. Evolutionary and biomedical insights from the rhesus macaque genome. Science. 2007;316:222–234. doi: 10.1126/science.1139247. [DOI] [PubMed] [Google Scholar]
- 15.Esnault C, Maestre J, Heidmann T. Human LINE retrotransposons generate processed pseudogenes. Nature Genet. 2000;24:363–367. doi: 10.1038/74184. [DOI] [PubMed] [Google Scholar]
- 16.Liu G, et al. Analysis of primate genomic variation reveals a repeat-driven expansion of the human genome. Genome Res. 2003;13:358–368. doi: 10.1101/gr.923303. [DOI] [PMC free article] [PubMed] [Google Scholar]
- 17.Lee J, et al. Different evolutionary fates of recently integrated human and chimpanzee LINE-1 retrotransposons. Gene. 2007;390:18–27. doi: 10.1016/j.gene.2006.08.029. [DOI] [PMC free article] [PubMed] [Google Scholar]
- 18.Kulpa DA, Moran JV. Cis-preferential LINE-1 reverse transcriptase activity in ribonucleoprotein particles. Nature Struct. Mol. Biol. 2006;13:655–660. doi: 10.1038/nsmb1107. [DOI] [PubMed] [Google Scholar]
- 19.Bogerd HP, et al. Cellular inhibitors of long interspersed element 1 and Alu retrotransposition. Proc. Natl Acad. Sci. USA. 2006;103:8780–8785. doi: 10.1073/pnas.0603313103. [DOI] [PMC free article] [PubMed] [Google Scholar]
- 20.Cordaux R, Batzer MA. The impact of retrotransposons on human genome evolution. Nature Rev. Genet. 2009;10:691–703. doi: 10.1038/nrg2640. [DOI] [PMC free article] [PubMed] [Google Scholar]
- 21.Kosiol C, et al. Patterns of positive selection in six Mammalian genomes. PLoS Genet. 2008;4:e1000144. doi: 10.1371/journal.pgen.1000144. [DOI] [PMC free article] [PubMed] [Google Scholar]
- 22.Ashburner M, et al. Gene ontology: tool for the unification of biology. Nature Genet. 2000;25:25–29. doi: 10.1038/75556. [DOI] [PMC free article] [PubMed] [Google Scholar]
- 23.Makino CL, et al. Recoverin regulates light-dependent phosphodiesterase activity in retinal rods. J. Gen. Physiol. 2004;123:729–741. doi: 10.1085/jgp.200308994. [DOI] [PMC free article] [PubMed] [Google Scholar]
- 24.Watterson GA. On the number of segregating sites in genetical models without recombination. Theor. Popul. Biol. 1975;7:256–276. doi: 10.1016/0040-5809(75)90020-9. [DOI] [PubMed] [Google Scholar]
- 25.Li WH, Sadler LA. Low nucleotide diversity in man. Genetics. 1991;129:513–523. doi: 10.1093/genetics/129.2.513. [DOI] [PMC free article] [PubMed] [Google Scholar]
- 26.Hobolth A, Christensen OF, Mailund T, Schierup MH. Genomic relationships and speciation times of human, chimpanzee, and gorilla inferred from a coalescent hidden Markov model. PLoS Genet. 2007;3:e7. doi: 10.1371/journal.pgen.0030007. [DOI] [PMC free article] [PubMed] [Google Scholar]
- 27.Patterson N, Richter DJ, Gnerre S, Lander ES, Reich D. Genetic evidence for complex speciation of humans and chimpanzees. Nature. 2006;441:1103–1108. doi: 10.1038/nature04789. [DOI] [PubMed] [Google Scholar]
- 28.Alcaide M, et al. Population fragmentation leads to isolation by distance but not genetic impoverishment in the philopatric Lesser Kestrel: a comparison with the widespread and sympatric Eurasian Kestrel. Heredity. 2009;102:190–198. doi: 10.1038/hdy.2008.107. [DOI] [PubMed] [Google Scholar]
- 29.Yu N, et al. Low nucleotide diversity in chimpanzees and bonobos. Genetics. 2003;164:1511–1518. doi: 10.1093/genetics/164.4.1511. [DOI] [PMC free article] [PubMed] [Google Scholar]
- 30.Chen FC, Li WH. Genomic divergences between humans and other hominoids and the effective population size of the common ancestor of humans and chimpanzees. Am. J. Hum. Genet. 2001;68:444–456. doi: 10.1086/318206. [DOI] [PMC free article] [PubMed] [Google Scholar]
Associated Data
This section collects any data citations, data availability statements, or supplementary materials included in this article.
Supplementary Materials
This file contains Supplementary Information, Sections 1-22 (see Table of Contents), which include Supplementary Figures with legends, Supplementary Tables, Supplementary Methods and additional references. (PDF 11307 kb)
This spreadsheet provides a general description of each cDNA data set generated for this project, as well as an internal experiment ID, flow cell ID, submission date and a Short Read Archive accession number. (XLS 24 kb)
This spreadsheet provides a general description of each short read genomic DNA data set generated for this project, including species (Bornean/Sumatran), individual identification number, sex, flow cell ID, a description of the data type (read length and whether paired end or fragment data), and a Short Read Archive accession number for each lane of data. (XLS 31 kb)
This file contains data with regard to variation in mean dS along the length of human chromosome 1, referenced in Supplemental Information section S7 (XLS 20 kb)
This file contains data with regard to variation in mean dS along the length of orangutan chromosome 1, referenced in Supplemental Information section S7. (XLS 21 kb)
This file contains data with regard to variation in dS in relation to genomic position and distance from structural elements of the genome (centromeres and telomeres) and rearranged regions of the genome, referenced in Supplemental information section S7. (XLS 161 kb)
This file contains data with regard to variation in dS along the orangutan branch and hominid branch on a chromosome-by-chromosome basis, referenced in Supplemental Information section S7. (XLS 93 kb)
This file contains data with regard to the effect of GC content on evolutionary rate variation in telomeric regions, in association with Supplemental Information section S7. (XLS 50 kb)
Data Availability Statement
Primary accessions
DDBJ/GenBank/EMBL
Data deposits
The P. abelii whole-genome shotgun project has been deposited in DDBJ/EMBL/GenBank under the project accession ABGA00000000. The version described in this Letter is ABGA00000000.1. Assembly-based SNPs and SNPs derived from short read sequence data have been deposited in dbSNP. All short read data have been deposited into the Short Read Archive (http://www.ncbi.nlm.nih.gov/sra) under accessions listed in Supplementary Information.