Abstract
Searching for genes regulating fat accumulation has both fundamental and medical interests. Genetic screening for those genes in Caenorhabditis elegans, a widely-used model organism, requires in vivo quantification of lipids. We demonstrated RNA interference screening based on quantitative imaging of lipids with label-free stimulated Raman scattering microscopy, which overcomes major limitations of coherent anti-stokes Raman scattering microscopy. Our screening yielded eight novel genetic regulators of fat storage.
Obesity has reached epidemic proportions globally, and is a major risk factor for chronic diseases, such as type 2 diabetes, cardiovascular diseases and hypertension. In order to better prevent and treat obesity and its associated metabolic disorders, it is necessary to understand the regulatory mechanisms of fat accumulation and distribution at both cellular and organism levels. Genomic screening for fat storage modulators have been carried out in several single- or multi- cellular organisms, including Saccharomyces cerevisiae, Caenorhabditis elegans, Drosophila melanogaster and D. melanogaster S2 cells 1–5. Among them, C. elegans is proven to be a promising multi- cellular organism for high-throughput genomic studies partly due to its small size, well-developed genetic tools and ease of handling.
Lipid analysis of C. elegans has been performed by traditional biochemical approaches, fixation and staining, and fluorescence imaging of live worms through vital dye feeding, and most recently via label-free coherent anti-stokes Raman scattering (CARS) microscopy 6. However, all of these approaches have serious limitations. Biochemical assays, require extraction of lipid from more than 5×10³ animals and subsequent time-consuming chromatography analysis 6, which cannot be easily carried out in genomic scale. The organic solvents used in the fixation protocol often disrupt and interfere with the structure of lipid storage compartments. Vital dye feeding, such as Nile Red and BODIPY, are rather indirect and suffer complications from unpredictable dye incorporation efficiency and the lack of a linear relationship between the observed signal level and the actual lipid quantity. Several studies have revealed significant inaccuracy of vital dye staining methods in live worms 6. CARS microscopy is a label-free imaging technique, but CARS signals exhibit non-resonant background that limits detection sensitivity and creates imaging artifacts 7. In addition, CARS signals have a complicated non-linear relationship with analyte concentration 7.
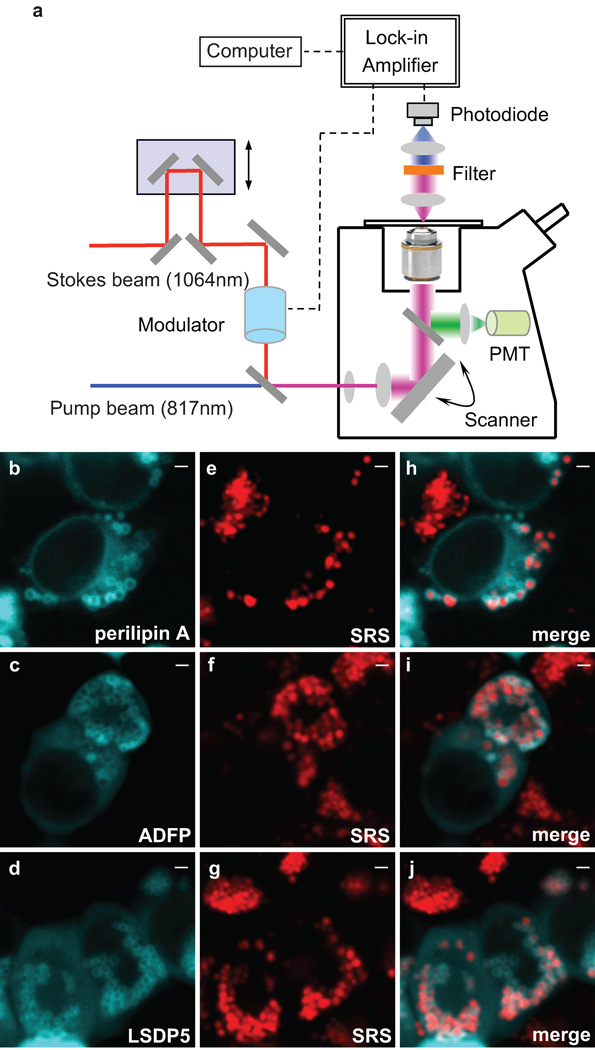
Stimulated Raman Scattering (SRS) microscopy can excite and detect the CH2 stretching vibration of fatty acid chains, which enables label-free three-dimensional lipid visualization with high sensitivity and specificity 7. In brief, two ultra-fast laser pulse trains, Pump and Stokes, were spatially and temporally overlapped and coupled into a laser scanning microscope (Fig. 1a). The Stokes beam had a fixed wavelength at 1064 nm, and was intensity modulated at 10 MHz. To image lipid, the Pump beam was tuned into 817 nm, with the energy difference between the Pump and the Stokes beams resonant with the vibrational energy of the CH2 stretching mode. At the laser focus, a portion of energy was transferred from the Pump pulse (intensity loss) to the Stokes pulse (intensity gain), due to the nonlinear Raman interaction with the CH2 vibrational mode. After passing through the sample, the forward going Pump beam was selectively transmitted through a filter and focused onto a Silicon (Si) photodiode. The output current of the photodiode was fed into a lock-in amplifier to extract the stimulated Raman loss (SRL) signal of the Pump beam precisely at 10 MHz. The SRL output from the amplifier was next fed back into the microscope and provided images of lipid in the sample. The SRL signal intensity was proportional to the concentration of targeted species.
Figure 1. Visualization of cellular fat storage in lipid droplets using SRS microscopy.
(a) Experimental scheme of label-free SRS microscopy for in vivo lipid imaging. (b, c and d) Lipid droplets were visualized by YFP-tagged perilipin A, ADFP and LSDP5 respectively. (e, f and g) SRS signals exhibited fat accumulation in cellular lipid droplets. (h, i and j) Merged images showed co-localization between SRS lipid signals and YFP fluorescence from lipid droplet associated proteins. Scale bar, 1µm in all figures.
We at first examined SRS lipid signals in living HEK 293cells and confirmed their origin from cellular lipid droplets. The PAT family proteins, perilipin A, adipose differentiation-related protein (ADFP) and LSDP5 are well-conserved lipid-droplet-associated proteins and localized to the droplet surface (Fig. 1b–d) 8. We found that cellular SRS signals correspond exclusively to lipid droplets that are highlighted by the YFP-tagged PAT proteins (Fig. 1b–j), or probed by BODIPY fluorescence (Supplementary Fig. 1). As a new lipid imaging technique, SRS microscopy indeed detected cellular fat storage in lipid droplets specifically.
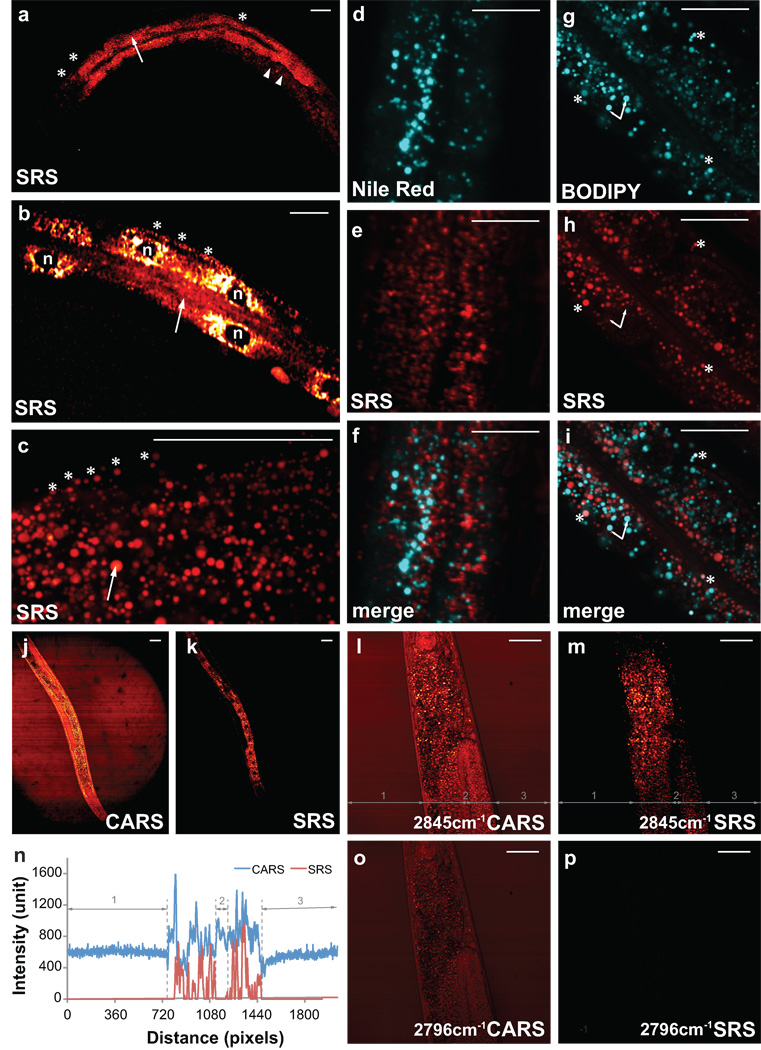
We next applied SRS microscopy to image fat storage in live worms (Fig. 2). At lower magnification, we were able to show fat distribution at the whole organism level. The SRS signal had the highest intensity in the intestine, suggesting it is the primary site for fat storage (Fig. 2a). Weaker signals were also detected in hypodermis, oocyte, and early stage embryos in the uterus (Fig. 2a,b). Inside a cell, the nucleus is known to be the organelle with lowest fat accumulation. Consistently, the SRS signal was absent in the intestinal nucleus (Fig. 2b), confirming a high selectivity of the SRS method for lipid imaging in vivo. The spatial resolution of SRS is similar to that in two-photon excited fluorescence microscopy7. We could detect fat accumulation in subcellular compartments using SRS microscopy at higher magnification (Fig. 2c).
Figure 2. Imaging fat accumulation and distribution in C. elegans by SRS microscopy.
(a, b) SRS signals revealed fat storage in intestine (arrow), hypodermis (asterisk), early embryos in the uterus (arrowhead) and cellular nuclei (n). (c) Subcelluar fat accumulation within a pool of droplets observed by SRS. (d–f) Two-photon excited fluorescence from Nile Red staining (d), SRS signals (e), and the overlaid images (f). (g) BODIPY staining of two distinct groups of subcellular organelles with weaker (asterisk) and stronger (arrow) fluorescence signals. (h) SRS image of the same organelles. (i) Overlap of BODIY and SRS signal. (j) CARS images showed strong signals in the intestinal cell nuclei, due to non-resonant background. (k) SRS image of the same animal with dark nuclei in the intestinal cells. (l, CARS and m, SRS) CARS and SRS images taken on the same worm at a Raman shift of 2845cm−1 resonant with CH2 stretching mode and a Raman shift of 2796 cm−1 off-resonant (o, CARS and p, SRS). (n) Cross section profiles of the highlighted grey lines in l and m. Scale bar, 50µm in all figures.
Nile Red fluorescence in live worms fed with this vital dye emits most intensely from gut granules 6. We found that Nile Red fluorescence in the intestine is largely non-overlapping with SRS signals (Fig. 2d,e,f), suggesting that gut granules are normally not fat storage compartments. BODIPY lipid probes are more reliable vital dyes than Nile Red in most systems such as cell culture (Supplementary Fig. 1). However, when feeding to live worms, BODIPY fluorescence emitted from both gut granules and lipid droplets (Fig. 2g–i). The latter signals were co-localized with SRS lipid signals, however their intensities were much weaker than that of non-lipid fluorescence from gut granules (Fig. 2g–i). Thus lipid quantification based on BODIPY staining in live worms will be misleading, because the brightest fluorescence are not lipid related.
Label-free CARS microscopy overcomes the above complications associated with fluorescent dye staining 9,10. However when compared to SRS imaging on the same animal, the CARS signals displayed much higher background from lipid unrelated structures (Fig. 2j–m and Supplementary Fig. 2a,b), which causes difficulties in image interpretation and lipid quantification. For example, the germline region containing undifferentiated germ cells has little lipid accumulation (region 2), which was therefore absent of SRS signals (Fig. 2m,n), but displayed high background in CARS (Fig. 2l,n). Unlike CARS, the SRS signal is linear to the substance concentration and does not exhibit a non-resonant background (Fig. 2m,n,p), which will allow straightforward quantification of fat content via in vivo imaging.
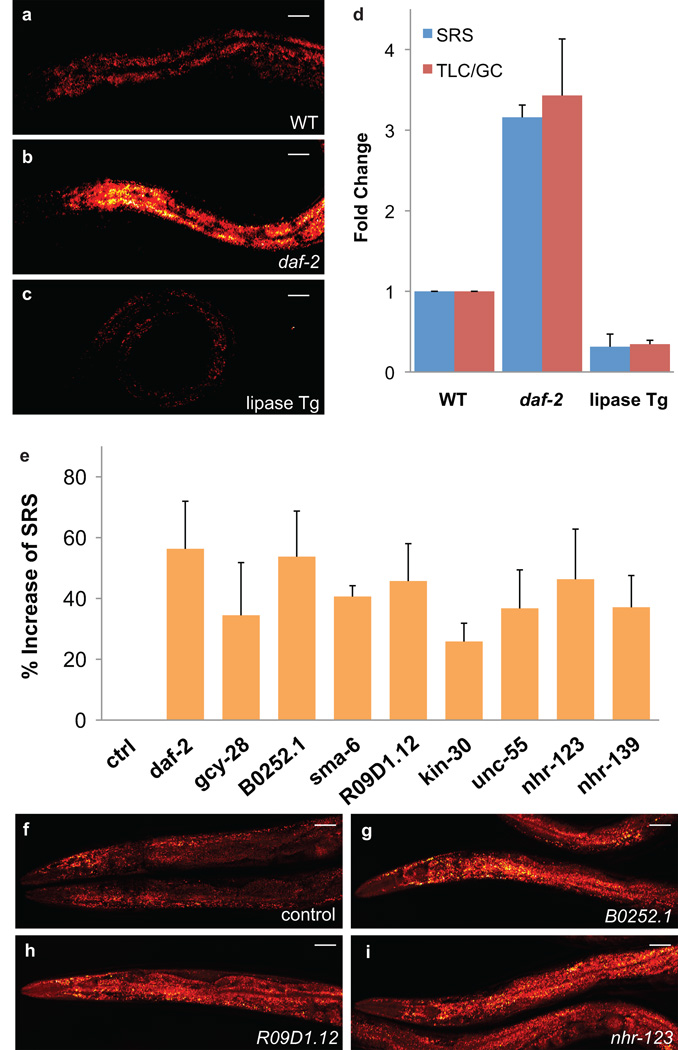
To confirm the quantification ability of SRS imaging for in vivo application, we compared wild type, an insulin receptor mutant, daf-2(e1370) that is known to have increased fat storage 5, and animals bearing a lipase gene overexpression whose fat content is expected to be reduced 11 (Fig. 3a–d). We imaged 2-d-old young adults and calculated the mean SRS signal intensity. Compared to the wild type, the daf-2(e1370) mutants had 3.2-fold greater fat storage (Fig. 3b,d), and the lipase transgenic worms had 31% fat content (Fig. 3c,d). In parallel, lipid extracted from ~5×10³ animals were separated using thin-layer chromatography (TLC), transesterized to fatty acid methyl esters and quantified with gas chromatography (GC). The in vivo SRS and the in vitro TLC/GC quantification provided similar results for each of the three phenotypes (Fig. 3d), suggesting SRS imaging is a reliable and quantitative method for assaying fat phenotypes of C. elegans. In contrast, the quantification based on CARS signals failed to reveal the difference in fat storage between wild type and the mutants (Supplementary Fig. 3). We note that, although sophisticated techniques do exist for quantitative CARS imaging, the background-free chemical contrast of SRS microscopy offers pronounced advantage particularly for large-scale genomic screening.
Figure 3. RNAi screening of new fat storage regulatory genes based on in vivo lipid quantification using label-free SRS microscopy.
Fat storage levels were visualized by SRS in the wild type worm (a), the daf-2 (e1370) mutant (b) and the transgenic animal with intestinal overexpression of the K04A8.5 lipase (c) under same imaging conditions. (d) Quantification of fat content by SRS (n=5) and TLC/GC (n = 5×10³) (e) Nine genes were identified to increase fat content more than 25%, when inactivated by RNAi, p < 0.0001, n = 5. All the experiments were performed twice independently. (f) Normal fat accumulation was observed in the RNAi hypersensitive strain, nre-1(hd20)lin-15b(hd126), fed with empty vector-containing bacteria. (g, h and i) Images of three candidates. Scale bar, 50µm in all figures.
We next performed RNA interference (RNAi) screening using this label-free SRS method, which allowed us to search for fat regulatory genes under physiological conditions. Membrane receptors and nuclear receptors are crucial in transducing signaling of growth factors, cytokine and hormones, and there is precedent for their involvement in the regulation of fat storage, such as insulin receptor, leptin receptor and PPAR gamma12. To identify additional fat storage regulatory genes, we cherry-picked RNAi clones that target 36 cell-surface receptor genes and 236 nuclear hormone receptor genes in C. elegans. To enhance RNAi, especially in neurons, we used the RNAi hypersensitive strain, nre-1(hd20)lin-15b(hd126) 13 to knock down these genes. Two-day-old young adults were screened for their fat content levels in 8-well imaging chambers using SRS microscopy. Out of the total 272 genes screened for, nine genes were discovered whose inactivation increase fat content more than 25% (Fig. 3e–i and Supplementary Fig. 4).
Intriguingly, all identified genes, except the insulin/IGF-1 receptor, daf-2, are novel regulators of fat storage whose roles in fat metabolism are largely unknown. Each identified gene has its human homologue and is broadly expressed in multiple tissues including neurons (Supplementary Table 1). gcy-28 is a worm homologue of human natriuretic peptide receptor. In human, natriuretic peptides are cardiac hormones, which can induce lipid mobilization and oxidation in adipose tissue 14. Consistently, we found gcy-28 inactivation increases worm fat content by 34% (Fig. 3e and Supplementary Fig. 4). We predict that other newly identified genes might also regulate mammalian fat metabolism.
Interfaced with RNA interference, SRS microscopy allows discovery of genes regulating fat metabolism under physiological conditions of animals. The label-free feature greatly simplifies sample preparation and is well suited for cell tracking in model organisms 15, and for high-throughput screening as demonstrated here. Using this method, a genome-wide search of new fat regulatory genes is under way.
Supplementary Material
Acknowledgments
We thanks H. Hutter lab at Simon Fraser University for providing the nre-1(hd20)lin-15b(hd126) strain and C. Sztalryd lab at University of Maryland School of Medicine for providing perilipin A, ADFP and LSDP5 plasmids. We also thanks J. Melo and Y. Hao for helping with the membrane receptor RNAi library, A. Soukas and H. Mak for the nuclear hormone receptor RNAi library, Z. Shi for helping with RNAi clone sequencing, X. Zhang and B. Saar for helping on imaging instrumentation, P. Iakova and A. Folick for helping with mammalian cell transfection, and C. He and J. Kang for GC analysis. Supported by National Institute of Health grants AG034988 (M.C.W.) and EB010244 (X. S. X.), and pre-doctoral fellowship from Boehringer Ingelheim Fonds (C.W.F.)
Footnotes
Author Contributions
M.C.W., W.M. and X.S.X conceived the study; M.C.W. and W.M. designed the experiments; M.C.W., W.M. and C.W.F. performed the experiments; M.C.W. analyzed the data; M.C.W, W.M., G.R. and X.S.X wrote the manuscript.
Reference
- 1.Fei W, et al. J Cell Biol. 2008;180:473–482. doi: 10.1083/jcb.200711136. [DOI] [PMC free article] [PubMed] [Google Scholar]
- 2.Guo Y, et al. Nature. 2008;453:657–661. doi: 10.1038/nature06928. [DOI] [PMC free article] [PubMed] [Google Scholar]
- 3.Pospisilik JA, et al. Cell. 2010;140:148–160. doi: 10.1016/j.cell.2009.12.027. [DOI] [PubMed] [Google Scholar]
- 4.Szymanski KM, et al. Proc Natl Acad Sci U S A. 2007;104:20890–20895. doi: 10.1073/pnas.0704154104. [DOI] [PMC free article] [PubMed] [Google Scholar]
- 5.Ashrafi K, et al. Nature. 2003;421:268–272. doi: 10.1038/nature01279. [DOI] [PubMed] [Google Scholar]
- 6.Watts JL. Trends Endocrinol Metab. 2009;20:58–65. doi: 10.1016/j.tem.2008.11.002. [DOI] [PMC free article] [PubMed] [Google Scholar]
- 7.Freudiger CW, et al. Science. 2008;322:1857–1861. doi: 10.1126/science.1165758. [DOI] [PMC free article] [PubMed] [Google Scholar]
- 8.Wang H, et al. J Biol Chem. 2009;284:32116–32125. doi: 10.1074/jbc.M109.006726. [DOI] [PMC free article] [PubMed] [Google Scholar]
- 9.Hellerer T, et al. Proc Natl Acad Sci U S A. 2007;104:14658–14663. doi: 10.1073/pnas.0703594104. [DOI] [PMC free article] [PubMed] [Google Scholar]
- 10.Yen K, et al. PLoS One. 2010;5 doi: 10.1371/journal.pone.0012810. [DOI] [PMC free article] [PubMed] [Google Scholar]
- 11.Wang MC, O'Rourke EJ, Ruvkun G. Science. 2008;322:957–960. doi: 10.1126/science.1162011. [DOI] [PMC free article] [PubMed] [Google Scholar]
- 12.Gesta S, Tseng YH, Kahn CR. Cell. 2007;131:242–256. doi: 10.1016/j.cell.2007.10.004. [DOI] [PubMed] [Google Scholar]
- 13.Schmitz C, Kinge P, Hutter H. Proc Natl Acad Sci U S A. 2007;104:834–839. doi: 10.1073/pnas.0510527104. [DOI] [PMC free article] [PubMed] [Google Scholar]
- 14.Lafontan M, et al. Trends Endocrinol Metab. 2008;19:130–137. doi: 10.1016/j.tem.2007.11.006. [DOI] [PubMed] [Google Scholar]
- 15.Olivier N, et al. Science. 2010;329:967–971. doi: 10.1126/science.1189428. [DOI] [PubMed] [Google Scholar]
Associated Data
This section collects any data citations, data availability statements, or supplementary materials included in this article.


