

Abstract
Here we study the effect of point mutations in proteins on the redistributions of the conformational substates. We show that regardless of the location of a mutation in the protein structure and of its type, the observed movements of the backbone recur largely at the same positions in the structures. Despite the different interactions that are disrupted and formed by the residue substitution, not only are the conformations very similar, but the regions that move are also the same, regardless of their sequential or spatial distance from the mutation. This observation leads us to conclude that, apart from some extreme cases, the details of the interactions are not critically important in determining the protein conformation or in specifying which parts of the protein would be more prone to take on different local conformations in response to changes in the sequence. This finding further illustrates why proteins manifest a robustness toward many mutational events. This nonuniform distribution of the conformer population is consistently observed in a variety of protein structural types. Topology is critically important in determining folding pathways, kinetics, building block cutting, and anatomy trees. Here we show that topology is also very important in determining which regions of the protein structure will respond to sequence changes, regardless of the sequential or spatial location of the mutation.
Keywords: population shifts, energy landscape, crystal packing, mutant structures
Over the years, a large number of studies have been carried out on point mutations and their effects on protein structure and function. The results have shown that, unless the mutations replace residues crucial for the catalytic function of a protein, most other mutations have relatively small benign effects. Although there are some extreme cases, such as the well studied textbook example of sickle cell anemia, proteins have been shown to be quite resilient to mutations, with relatively small structural and hence functional changes. It has been shown that on such mutational interchanges, what generally happens is that nearby side-chains move, either filling in the void that formed on a large-to-small residue interchange or, conversely, moving away to accommodate a larger side-chain of the newly inserted amino acid. In this way, tight packing is preserved in the protein cores and at their interfaces. The relative ease with which side-chain changes are handled by the proteins has brought about a realization that in considering protein folding, the details of the interactions can frequently be ignored. Further, the details of the interactions between side-chains change appreciably between crystal and NMR structures and between NMR conformers, as shown in calculations of ion pair stabilities in ensembles of conformers (1).
Furthermore, it has been shown that pathways of protein folding are largely unaffected by changes in the sequence (2–4). In at least two cases, the cold-shock protein B (CspB) and SH3 domains, even relatively large differences in the sequences apparently do not affect the transition state structures (5–7). In CspB, changes in stabilities also do not affect the folding pathways (5). On the other hand, the folding rates may or may not be affected by mutations. Although there are cases such as the SH3 domains and the IgG-binding domain of protein L where large changes in the sequences have been observed to have no effect on the folding rates (8, 9) depending on the mutation and its site, such changes may affect the folding rates. For example, changes in rates may be observed in helix-stabilizing or -destabilizing substitutions. Larger changes have been observed in double or triple substitutions (reviewed in refs. 10 and 11 and refs. therein). Mutations can stabilize or destabilize folding intermediates. Hence, in effect, mutations change the energy landscape in a manner similar to that observed by changes in environmental conditions, such as pH, ionic strength, the presence of a denaturant, temperature, or pressure (12). Changes in the energy landscape do not result in the appearance of conformations or pathways that were not present a priori. Rather, landscape changes reflect relative shifts of some conformers with respect to others. On alterations in the sequences, conformations that were present in the wild-type protein system in low populations may increase their population times and vice versa. The pathways themselves are unchanged by sequence alterations. However, the different stabilities might be reflected in the kinetics of protein folding (13).
The effects of changes at a local site on structurally distant regions have been studied by Freire and colleagues in a recent series of papers (14–16). They have developed and used a structure-based statistical thermodynamic approach to predict the propagation of stabilizing effects triggered by binding events or by single-site thermodynamic mutations.
Here we study the effects of naturally occurring or experimentally generated point mutations on the distribution of the conformational substates. We carry out an extensive analysis of a large number of mutants where crystal structures are available (17). We show that, first, the overall changes in the structures are quite small, confirming the general opinion. In particular, however, we carry out a detailed analysis to find the locations of the largest structural deviations. We show that the substitutions trigger a redistribution of the substates in the ensemble of conformations populated under native conditions. Regardless of the site of the mutation and its type, the regions that illustrate the largest deviations are observed to be around the same locations. Hence, some regions are inherently more prone to adapt to sequence changes. The conformations are not equally distributed in the conformational space. Instead, some parts of this space are more highly populated than others. Our analysis encompasses a range of proteins of different structural types. This phenomenon is observed consistently in all cases.
Materials and Methods
The coordinates were extracted from the Protein Data Bank (PDB; ref. 17). Cases where a significant number of mutant structures were available were used. The type and position of the mutation were retrieved from the PDB. The residue-by-residue deviations of corresponding Cα pairs were inspected by superimposing each of the mutant structures on their respective wild types. Colors were assigned to the more and less deviated regions according to the mean of the Cα deviations of all mutational variants against the wild type, and these were plotted. Two cutoffs were selected according to the extent of the deviations. The region below the first cutoff is considered relatively immune to sequence alterations and is shown in red; the region between the two cutoffs is colored green. The region above the second cutoff is considered particularly prone to respond and adapt to mutations wherever they occur and is shown in blue in Fig. 3. The cutoffs are given in the legend to Fig. 3. Some myoglobin mutants show larger fluctuations throughout the structures with respect to wild type. Such behavior is reflected in the Cα-distance difference matrices (DDM) plots (DDMP) (18); [the ddmp program used for this purpose is available at http://www.csb.yale.edu), particularly in the cases of 106 m, 109 m, and 1chl (see Figs. 8–10, which are published as supplemental data on the PNAS web site (www.pnas.org)].
Figure 3.

The color assignments showing the more and less deviated regions. (a) T4 lysozyme (3lzm); (b) myoglobin (105 m); (c) transthyretin (1bmz A); (d) HIV proteinase (1dif); (e) barnase (1a2p A); (f) lactoferrin (1bka). The regions most prone to respond to mutations are shown in blue and the least prone, in red. The regions between blue and red are in green. Few residues at the N and C termini in each case are in gray, so the flexible termini do not affect the coloring scale. The α-helices and β-strands are labeled for clarity. The binding or active sites are indicated by arrows. The cutoffs for blue, green, and red regions differ in the different cases and are as follows (in Å): (a) 3lzm: under 0.30 red, over 0.35 blue; (b) 105m: under 0.75 red, over 2.00 blue; (c) 1bmz: under 0.40 red, over 0.50 blue; (d) 1dif A: under 0.40 red, over 0.60 blue; (e) 1a2p A: under 0.60 red, over 0.80 blue; (f) 1bka: under 0.75 red, over 1.00 blue. Between red and blue, the regions are colored green. Cutoffs are based on visual observation rather than setting of a standard value, because the extent of the deviation and the regions lengths vary from case to case. The residue positions of the blue regions are marked. The pictures were generated by using molecular graphics package INSIGHT II (Molecular Simulations).
Results
We have analyzed proteins with the largest number of mutants in the PDB (17), 62 mutants of T4 lysozyme, 54 of myoglobin, 9 of transthyretin, 5 of HIV proteinase, 10 of barnase, 4 of lactoferrin, 5 of dihydrofolate reductase, 3 of α-1-antitrypsin, and 3 of BP-RNase A. In each case, we have superimposed the structure of the mutant on the respective wild-type structure and computed the distances between corresponding Cα pairs between the two. The cases are listed in Appendix A, which is published as supplemental data. All of the cases have high-resolution protein crystal structures. Appendix A further lists the mutation type, position, the overall rms deviations (RMSDs) and the positions of the first and second largest deviations. As the average RMSDs show in all cases that the structures are highly similar and in some are practically identical, with the largest RMSD reaching 3.9 Å. A summary of Appendix A is given in Table 1, listing the total number of mutations that were available for each of the proteins, the total number of each type of mutation, the residues that deviate the most, and the secondary structure type where they fall. The references for the wild-type and mutant structures are given in the legend to Appendix A, listed according to the protein type. Fig. 1 illustrates that the mutations are distributed over the entire sequence rather than being clustered at a specific site. The mutations are well dispersed in the structure and are not grouped at any specific region or secondary structure. Fig. 2 illustrates two examples, T-4 lysozyme and myoglobin.
Table 1.
RMSD analysis of mutants against their wild types
| Protein (ID) | Variants studied | No. of mutants (same/diff.*) | Most deviated residues† | Affected region‡ |
|---|---|---|---|---|
| T4 lysozyme (3lzm) | 62 | 191 (113/78) | Asn-40, Gly-77 | α-Helix termini, α-helix termini |
| Myoglobin (105m) | 54 | 104 (86/18) | Gly-121, His-48 | Coil, coil |
| Transthyretin (1bmz A) | 9 | 9 (6/3) | Ser-100, Gly-101 | Coil, coil |
| HIV aspartic proteinase (1dif A) | 5 | 7 (4/3) | Gly-51, Ser-37 | Coil, coil |
| Barnase | 10 | 13 (10/3) | Lys-66, Gly-40 | Coil, coil |
| Lactoferrin (1bka) | 4 | 4 (3/1) | Arg-313, Pro-284 | Coil, coil |
| Dihydrofolate reductase (4dfr A) | 5 | 6 (4/2) | Ser-135, Gly-67 | β-Strand, coil |
| α-1-antitrypsin (2psi) | 3 | 10 (5/5) | Ala-350 | Coil |
| BP-RNase A (1rph) | 3 | 5 (1/4) | Ser-21 | Coil |
| Adenylate kinase (1ake A) | 2 | 3 (1/2) | Glu-113, Thr-158 | Coil, β-strand termini |
| Calmodulin (4cln) | 2 | 2 (deletions) | Gly-113 | Coil |
Summary of the mutational analysis. The PDB codes (in parentheses) of only the wild-type proteins are listed. Mutant PDB codes are listed in Appendix A, (Supplemental Data).
Because a structure may contain several amino acid substitutions, the number of variants in the second column differs from the number of mutants in the third column.
Mutations of similar or different types of residues (hydrophobic/hydrophilic).
Residue positions of the highest and second-highest deviations.
Regions in the structure where the highest and second-highest distance deviations fall, corresponding to column 3.
Figure 1.

Plots showing the distributions of the positions of the mutations. The sequence of the wild type is plotted, and the mutants are marked. (a) T4 lysozyme; (b) myoglobin; (c) transthyretin; (d) HIV-proteinase; (e) barnase. In T4 lysozyme, 60 of 62 mutants have the C54t and C97a mutations, in addition to the other mutations plotted here. The frequencies at these two positions are not shown. In myoglobin, 49 of 54 cases contained mutation D122n, which are also not shown. Thick bars represent the mutation positions, whereas thin bars represent the scale.
Figure 2.

The positions of the mutations in the structures of the T-4 lysozyme (a) and myoglobin (b). The positions of the mutations are shown in green.
Fig. 3 depicts the averages of the deviations for proteins that have a larger number of mutant structures available. Red depicts smaller distance averages and hence implies a lesser tendency of the region to adapt to sequence changes; blue refers to regions with larger average distances, implying regions prone to take on the effect of mutations wherever they occur. Green refers to regions with average values between these two. The figure legend details the numerical cutoffs used in the color assignment. Because the average RMSDs and the number of mutants vary, these have been tuned by visual inspection, as noted in the legend. The cases with the largest number of mutants and hence the most reliable numbers are the T4 lysozyme and myoglobin.
T4 Lysozyme.
The T4 lysozyme is a 164-residue, mainly α-helical, protein (Fig. 3a). There are two hinges (19) at both ends of an α-helix that connects the C- and N-terminal domains. These hinges allow movement around the active site (20). In the figure, the α-helices are labeled A–F. The figure depicts the average distances between the Cα pairs over all mutants. Sixty-two mutants have been studied, with a total of 191 mutations within these. In 52 of the 62, the highest or second-highest deviations are at one of the three sites: Asn-40, Gly-77, and Gly-113 (Appendix A; Fig. 4a). Differences in position by one or two residues have been ignored. These positions fall in coils. Gly-77 is at the C terminus of the interdomain helix (helix C in Fig. 3a); Asn-40 lies in the coil connecting a β-strand to helix B; Gly-113 is in the coil between α-helices G and F; and Asn-40 is the highest or second-highest deviated residue in 33 mutant structures, Gly-77 in 22 cases and Gly-113 in 23 cases. As shown in Figs. 1 and 2, the mutation(s) are dispersed in the structure. For example, the mutation at position 133 (in the case of 223l) and at position 6 (in the case of 256l) have the highest or second-highest distance at Gly-113. In most cases, the observed affected regions were at all three positions at the same time. The RMSDs between the mutants and the wild type are quite small (in the range of 0.1–1.2 Å; see Appendix A). The highest and second-highest deviations are in the range of 0.4–6.0 Å, in most cases significantly higher than the overall RMSDs. In 113 of the 191 cases, the mutations are of similar types, either polar to polar or hydrophobic to hydrophobic. In 78 cases, they are of different types, either hydrophobic to polar or polar to hydrophobic. The interdomain helix that illustrates the largest deviation is blue in Fig. 3a.
Figure 4.

Plots showing the correlation between the positions of the mutations and the first and second largest deviations in the mutants of the T-4 lysozyme (a) and myoglobin (b). All of the mutants tabulated in Appendix A are plotted. Most of the point mutations marked on the y axis are accompanied by mutations C54a and C97a in the case of the T-4 lysozyme and D122n in myoglobin, as shown in Appendix A. Residue positions showing the largest or the second-largest deviations in most of the mutants, 60 of 62 in the T-4 lysozyme and 52 of 54 in myoglobin, are marked on the x axis. These positions are 40, 77, and 113 in the T-4 lysozyme and 48 and 121 in myoglobin (see Appendix A, for details).
Myoglobin.
Myoglobin is a 153-residue α-helix-rich protein. Fifty-four mutational variants have been analyzed for their structural deviations against the wild-type myoglobin, 105m. The positions of the mutations are plotted in Figs. 1 and 2, and the results are detailed in Appendix A, summarized in Table 1, and depicted in Fig. 3b. Fig. 4b shows the correlation between the positions of the mutations and the positions of the highest and second-highest deviations. In 52 of the 54 cases, the highest deviation is at Gly-121. In 37 of 54 cases, the second-highest deviation is at His-48. Gly-121 is in the coil between the two long α-helices, G and H. His-48 is in the coil that connects two small α-helices, C and D. Although the average RMSDs of the variants are very small, in the range of 0.72–1.06 Å (except for the mutant 1mno), the highest deviations are in the range of 2.75–7.17 Å (except for 1hrm). The deviations at Gly-121 are considerably (approximately three times) higher than that of the second-highest deviation. Thus, the long coil joining the two long helices G and H is more prone to respond to sequence alterations than the coil between helices C and D, probably because of function.
Transthyretin, HIV Proteinase, Barnase, Lactoferrin, Dehydrofolate Reductase, α-1 Antitrypsin, BP-RNase A, Adenylate Kinase, and Calmodulin.
These cases have fewer mutants and hence from the statistical standpoint are less meaningful. For the mutants that are available, the same behavior is observed consistently. Table 1 and Fig. 3 present a summary of results. The full analysis is presented in the supplemental Results (www.pnas.org).
Hence inspection of these results illustrates that, regardless of the location of the mutation or its type, the structural parts that appear to respond and adapt to these mutations are the same. Although clearly a modulation of the extent of the response may be expected, it is not feasible to analyze these features in the structures. A relevant question is whether our results depend on the procedure selected for the superposition. Above, all corresponding Cα pairs have been used for the fit. To address this concern, we have repeated the analysis by using the geometric hashing (GH) algorithm (21). This algorithm first finds the most closely conserved Cα pairs, computes the transformation by using these, and subsequently superimposes the two structures by applying this transformation to the entire structure. The results we have obtained are very similar. Not only do the positions of highest and second-highest deviations agree, but the extent of deviations is similar between the two procedures. For example, in the case of 3lzm-220l (lysozyme wild type and its mutant), in the all-Cα-atom superposition (Appendix A), the largest and second-largest deviations are at Asn-55 (0.53 Å) and Ala-98 (0.39 Å); the GH gives practically the same observation. For 105m-101m (myoglobin), the largest and second-largest are Gly-121 (3.97 Å) and His-64 (1.43 Å); the GH gives Gly-121 (4.23 Å), Asp-60 (1.47 Å), and His-64 (1.45). Fig. 7 (which is published as supplemental data on the PNAS web site, www.pnas.org) illustrates these and two additional examples of the superpositions, 3lzm-238l and 105m-1ch5, also showing the correspondence between the two procedures. A second test of the results has been performed by using the ddmp program (18). This program produces distance difference matrices–contoured plots between two proteins, subtracting all Cα pair-wise distances in the two structures. The advantage of this program is that all inter-Cα distances are produced, also providing the relative magnitudes of the differences. We have generated all such plots, with results similar to those described above. Because of lack of space, only two figures are presented here, the first for T4 lysozyme and the second for myoglobin (Fig. 5 a and b). Figs. 8–10 contain additional cases (for lysozyme, myoglobin, and transthyretin).
Figure 5.
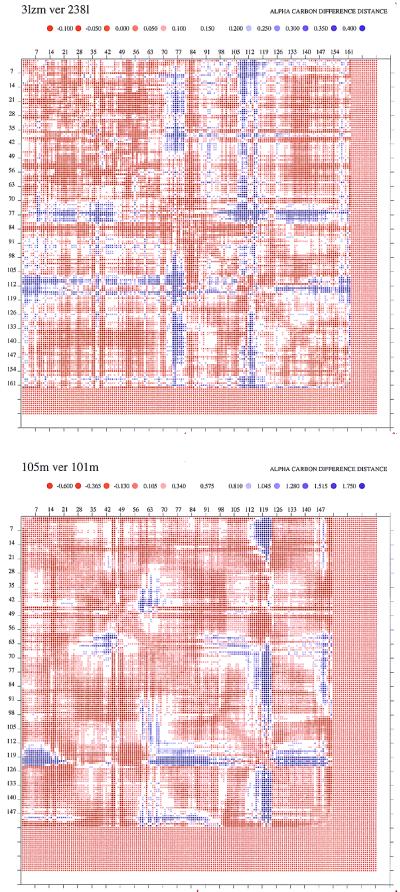
Distance difference matrices plots for two mutants, one of lysozyme (a) 3lzm-238l, and the second (b) for myoglobin 105m-101m. The program ddmp (18) was used to generate the plots (http://www.csb.yale.edu). Additional plots are presented in the supplemental data (see Fig. 8 for lysozymes and Fig. 9 for myoglobin). The default parameters and color scale have been used. The colored dots represent distance differences between the two proteins, according to the scale shown. The advantage of this program is that it presents contour plots of all inter-Cα distances. The distances of the mutants are subtracted from those of the wild type.
Because the largest number of mutant structures available are for largely α-helical proteins, our analysis is confined mostly to such cases. Only for the dihydrofolate reductase have we observed the largest deviation to be at Ser-135, in a β-strand (see Appendix A and discussion, www.pnas.org). The behavior of largely β-structure proteins is of interest, because they generally involve longer-range interactions.
A particularly interesting point to examine is a potential correlation between the regions that deviate the most and the active sites. Table 2 lists catalytic residues taken from the literature. Comparing the regions around these with the regions that show the largest structural deviations in the mutational analysis illustrates that the regions that are most prone to respond to sequence changes are not necessarily in the active sites. Further, we have examined the deviations to see whether the binding sites conform with the part-flexible part-rigid proposition (15). We find that in some cases, but not uniformly in all, there is such a correspondence.
Table 2.
Active-site residues
| Protein | Active sites | Corresponding position and color in Fig. 3 | Active-site references |
|---|---|---|---|
| T4 lysozyme | Glu-11 | Coil between helix A and β-sheet (grey) | 34 |
| Asp-20 | Coil in β-hairpin (red) | ||
| Thr-26 | Coil in the β-hairpin (red) | ||
| Myoglobin | Val-68 | α-helix E (red) | 35 |
| His-93 | α-helix G (red) | ||
| Ile-107 | α-helix H (red) | ||
| HIV proteinase | Asp-25 | Coil between G and C terminus (blue) | 36 |
| Lactoferrin | Asp-60 | Coil (green) | 37 |
| Tyr-92 | Hinge β-strand (blue) | ||
| Tyr-192 | Terminus of the helix (green) | ||
| His-253 | Hinge (green) | ||
| Barnase | Glu-73 | In β-strand E (red) | 38 |
| His-102 | Coil at the C terminus (blue) |
The catalytic/binding residues at the binding sites. In barnase, HIV proteinase, and T4 lysozyme, these are the catalytic residues. In lactoferrin and myoglobin, these residues are involved in binding iron or heme. The corresponding color-coded assignments in Fig. 3 are noted.
Crystal-Packing Effects.
Because this study uses structures of the wild type and their mutational variants, the structures are very similar, crystallized in the same space group, and hence the crystal contacts are also at practically the same positions. Hence, a valid concern is whether the deviations that we observe are a simple outcome of the recurring crystal contacts. If that were the case, one could argue that the largest deviations are expressed in these particular locations because they are the ones that are not tightly packed in the crystal. To allay this concern, we have carried out two types of analyses: the first examines the B factors in the wild types and in all mutant structures. As the B factors correlate with crystal packing, the question arises whether the B factors and the deviations are largest at the same sites. Appendix B (which is published as supplemental data on the PNAS web site, www.pnas.org) lists the results of the residue positions and magnitudes of the largest B factors, compared with those at the positions of the largest deviations for each of the structures. As Appendix A shows, no consistent systematic correspondence is observed.
The second analysis examines crystal packing directly. Fig. 6 a and b illustrates the results for two cases, the T-4 lysozyme and myoglobin. Only about 30% of the surface of the T-4 lysozyme is involved in crystal contacts. Comparison of Fig. 6a with the blue regions in Fig. 3 illustrates that the blue central helix does not have crystal contacts, whereas the blue region of the coil between the small helix and the β-strand has few contacts. The fewest contacts are around the C terminus, where we observe the largest B factors (Lys-162 is the highest). The region of Asn-55, which is observed to have the highest B factor in some mutants, also appears to have only few contacts. For myoglobin (with about 75% of its surface involved in crystal contacts), the C terminus also has few contacts. We have also examined the space groups (Fig. 6 legend). Hence the recurrence of the largest deviations at the same locations, regardless of the type and the site of the mutations, is not a simple outcome of crystal-packing effects.
Figure 6.

Crystal packing of (a) the T-4 lysozyme and (b) myoglobin. The figures were generated by using the program written by C.-J. Tsai (33).
Motions Conserved for Functional Reasons: The Aspartyl Proteinase Family Example.
Motions may be functionally critical and hence conserved in the family. The aspartic proteinases provide an excellent example. Retroviral aspartic proteinases are homodimeric enzymes, unlike the eukaryotic monomeric aspartic proteinases (22). Retroviral proteinases from apo-simian immunodeficiency virus, Rous sarcoma virus, feline immunodeficiency virus, and HIV share a common structural fold (22), despite their sequence variability. The retroviral aspartyl proteinase monomers associate to form a binding pocket containing two catalytic aspartic acid residues at the floor of the pocket. Two flexible β-strand “flaps” form the ceiling of the binding pocket. A substantial conformational change has been observed in HIV proteinase on binding with an inhibitor. Difference distance matrix analysis of the bound closed conformation and unbound open conformation has suggested that five rigid domains, a terminal domain, two core domains containing the catalytic residues, and two flap domains move with respect to each other (23). In the open conformation, the flaps shift by about 7 Å relative to the closed conformation (24–26). Rapid flap motions have also been detected by NMR (27) and by fluorescence changes (28). In particular, the functional hinge for the flap movements (29) further substantiates the association between the flap movements and enzyme function. The flexible part, which appears to govern the flap movements, and the flaps themselves are conserved over the entire family of aspartic proteinases despite sequence alterations. Moreover, the overall structural similarity of the retroviral aspartic proteinase with the eukaryotic monomeric aspartic proteinase indicates an evolutionary functional relatedness. The rigid body motions identified in the eukaryotic pepsin are similar to those found in retroviral proteinases, validating the functional significance of the inherent rigid and flexible regions in aspartic proteinases.
Discussion and Conclusions
Here we study shifts in the conformational substates after mutational events. Our studies were carried out by using a method that makes use of the wealth of structural data in the PDB. Through simple comparisons of Cα pairs, rather than of overall RMSDs, where these are carried out on a large number of mutant structures, we show that the conformational substates are not homogeneously distributed through conformational space. Instead, structural perturbations caused by point mutation events at different locations throughout the molecules tend to be reflected preferentially at specific sites. This observation implies that of the huge number of conformational states in principle accessible to the protein molecule, only an extremely small number are significantly populated.
This observation is consistent with results obtained by Freire and colleagues, who have studied the effect of a perturbation to any given single residue on a second residue, which could be far away in the structure (16). Using a structure-based thermodynamic algorithm, they further investigated the redistribution of the conformational substates on the binding of an inhibitor (14, 15). They found that some conformations involving changes far away from the binding site were selectively enriched.
Mutational events change conditions and as such cause shifts in the energy landscape. They alter the distributions of the conformational substates in a way similar to that of an external agent, such as temperature, pH, ionic strength and pressure, or to that observed by a change in the binding conditions (12, 30). Interestingly, whereas there is some correlation between large and small deviations and active sites (15), this correlation is not always observed. Hence, binding sites are not always a composite of part-flexible part-rigid regions. It would be interesting to examine in more detail a potential relationship between sites showing such trends and enzyme catalytic, or binding mechanisms.
Recent studies have shown that proteins with similar topologies manifest similar folding pathways, regardless of their differences in amino acid sequences (2–4, 31). The transition-state structures of homologous proteins are also conserved. Mutations do not cause a broadening of the range of transition-state conformations. Conversely, it has been shown that, at least for some cases, the ensemble of the transition-state conformers may be even more polarized than the range shown by their corresponding wild-type proteins (2, 3). Hence, although mutations are likely to affect the kinetics of protein folding, because of the higher or lower probabilities of kinetic traps, the folding pathways, transition state, and final conformations are largely unchanged, immune to high-resolution interaction details. With respect to the effect of mutations on the rates of protein folding, the study by Rothwarf and Scheraga (13) on hen egg-white lysozyme provides a very elegant example, illustrating that both Tyr-108 and Tyr-62 (in both cases replacing Trp) fold significantly faster than wild type (7- and 13-fold, respectively). Here the location of the mutation, whether on the surface of the protein or in its core, affects significantly the folding rates. Hence, mutations may affect the conformational stability and folding rates in a manner analogous to changes in pH (2), reflecting the dynamics of the protein energy landscape (12, 30). However, although here only small fluctuations in the distribution of the conformational substates are observed, some mutations can result in devastating effects. Two such potential examples are the introduction of prolines in α-helices and elimination of cysteines that participate in disulfide bridges.
To conclude, the fact that similar folds with similar topologies but variable sequences manifest hinges at similar sites (32) and the observation that different mutations consistently affect the same regions in the structures, combine to illustrate the insensitivity to high-resolution structural (and sequence) details, as expressed in the details of interatomic interactions. Hence, sequence alterations alter neither the location of the sites that are more prone to respond and adapt to such changes, nor the folding pathways (2–4), nor final conformations. Their effect is via redistribution of the populations of the conformers, expressed in modulations of the extent of the local structural deviations (1) and sometimes in altered folding rates (13).
Supplementary Material
Acknowledgments
The origin of this work is a vivid recollection of a talk given by Fred Richards years ago. In that talk, Richards advocated the use of pair-wise Cα distances over average RMSDs. If we recall correctly, his point was that in using average RMSDs, considerable information is lost, hence one should resort to such averages only if there is no alternate way. We were truly delighted that this approach yielded the results described in this work. We thank Drs. Sandeep Kumar, Buyong Ma, Jacob V. Maizel and, in particular, Chung-Jung Tsai for numerous helpful and insightful discussions. Advanced Biomedical Computing Center personnel are thanked for computational resources and related assistance. The personnel at Frederick Cancer Research and Development Center are thanked for their assistance. The research of R.N. in Israel has been supported in part by Grant 95–00208 from the Binational Science Foundation, Israel; by a grant from the Ministry of Science, by the Center of Excellence, administered by the Israel Academy of Sciences; by the Magnet Grant; and by Tel Aviv University Basic Research and Adams Brain Center grants. This project has been funded in whole or in part with federal funds from the National Cancer Institute, National Institutes of Health, under contract no. NO1-CO-56000.
Abbreviations
- PDB
Protein Data Bank
- RMSD
rms deviation
Footnotes
This paper was submitted directly (Track II) to the PNAS office.
References
- 1.Kumar S, Nussinov R. Proteins Struct Funct Genet. 2000;41:485–497. [PubMed] [Google Scholar]
- 2.Riddle D S, Grantcharova V P, Santiago J V, Alm E, Ruczinski I, Baker D. Nat Struct Biol. 1999;6:1016–1024. doi: 10.1038/14901. [DOI] [PubMed] [Google Scholar]
- 3.Martinez J C, Serrano L. Nat Struct Biol. 1999;6:1010–1016. doi: 10.1038/14896. [DOI] [PubMed] [Google Scholar]
- 4.Tsai C J, Maizel J V, Jr, Nussinov R. Proc Natl Acad Sci USA. 2000;97:12038–12043. doi: 10.1073/pnas.97.22.12038. [DOI] [PMC free article] [PubMed] [Google Scholar]
- 5.Perl D, Welker C, Schindler T, Schroder K, Marahiel M A, Jaenicke R, Schmid F X. Nat Struct Biol. 1998;5:229–235. doi: 10.1038/nsb0398-229. [DOI] [PubMed] [Google Scholar]
- 6.Grantcharova V P, Riddle D S, Santiago J V, Baker D. Nat Struct Biol. 1998;5:714–720. doi: 10.1038/1412. [DOI] [PubMed] [Google Scholar]
- 7.Martinez J C, Pisabarro M T, Serrano L. Nat Struct Biol. 1998;5:721–729. doi: 10.1038/1418. [DOI] [PubMed] [Google Scholar]
- 8.Kim D E, Gu H, Baker D. Proc Natl Acad Sci USA. 1998;95:4982–4986. doi: 10.1073/pnas.95.9.4982. [DOI] [PMC free article] [PubMed] [Google Scholar]
- 9.Riddle D S, Santiago J V, Bray-Hall S T, Doshi N, Grantcharova V P, Yi O, Baker D. Nat Struct Biol. 1997;4:805–809. doi: 10.1038/nsb1097-805. [DOI] [PubMed] [Google Scholar]
- 10.Jackson S E. Folding Des. 1998;3:R81–R91. doi: 10.1016/S1359-0278(98)00033-9. [DOI] [PubMed] [Google Scholar]
- 11.Ionescu R M, Matthews C M. Nat Struct Biol. 1999;6:304–307. doi: 10.1038/7534. [DOI] [PubMed] [Google Scholar]
- 12.Tsai C J, Ma B, Nussinov R. Proc Natl Acad Sci USA. 1999;96:9970–9972. doi: 10.1073/pnas.96.18.9970. [DOI] [PMC free article] [PubMed] [Google Scholar]
- 13.Rothwarf D M, Scheraga H A. Biochemistry. 1996;35:13797–13807. doi: 10.1021/bi9608119. [DOI] [PubMed] [Google Scholar]
- 14.Todd M J, Freire F. Proteins Struct Funct Genet. 1999;36:147–156. doi: 10.1002/(sici)1097-0134(19990801)36:2<147::aid-prot2>3.0.co;2-3. [DOI] [PubMed] [Google Scholar]
- 15.Freire E. Proc Natl Acad Sci USA. 1999;96:10118–10122. doi: 10.1073/pnas.96.18.10118. [DOI] [PMC free article] [PubMed] [Google Scholar]
- 16.Hilser V J, Dowdy D, Oas T G, Freire E. Proc Natl Acad Sci USA. 1998;95:9903–9908. doi: 10.1073/pnas.95.17.9903. [DOI] [PMC free article] [PubMed] [Google Scholar]
- 17.Bernstein F C, Koetzle T F, Williams G J B, Meyer E F, Jr, Brice M D, Rodgers J R, Kennard O, Shimanouchi T, Tasumi M. J Mol Biol. 1977;112:535–542. doi: 10.1016/s0022-2836(77)80200-3. [DOI] [PubMed] [Google Scholar]
- 18.Richards F M, Kundrot C E. Proteins Struct Funct Genet. 1988;3:71–84. doi: 10.1002/prot.340030202. [DOI] [PubMed] [Google Scholar]
- 19.Gerstein M, Krebs W. Nucleic Acids Res. 1998;26:4280–4290. doi: 10.1093/nar/26.18.4280. [DOI] [PMC free article] [PubMed] [Google Scholar]
- 20.Dixon M M, Nicholson H, Shewchuk L, Baase W A, Matthews B W. J Mol Biol. 1992;227:917–933. doi: 10.1016/0022-2836(92)90231-8. [DOI] [PubMed] [Google Scholar]
- 21.Tsai C J, Lin S L, Wolfson H J, Nussinov R. J Mol Biol. 1996;260:604–620. doi: 10.1006/jmbi.1996.0424. [DOI] [PubMed] [Google Scholar]
- 22.Wlodawer A, Erickson J W. Annu Rev Biochem. 1993;62:543–585. doi: 10.1146/annurev.bi.62.070193.002551. [DOI] [PubMed] [Google Scholar]
- 23.Rose R B, Craik C S, Stroud R M. Biochemistry. 1998;37:2607–2621. doi: 10.1021/bi9716074. [DOI] [PubMed] [Google Scholar]
- 24.Wlodawer A, Miller M, Jaskolski M, Sathyanarayana B K, Baldwin E, Weber I T, Selk L M, Clawson L, Schneider J, Kent S B. Science. 1989;245:616–621. doi: 10.1126/science.2548279. [DOI] [PubMed] [Google Scholar]
- 25.Lapatto R, Blundell T, Hemmings A, Overington J, Wilderspin A, Wood S, Merson J R, Whittle P J, Danley D E, Geoghegan K F, et al. Nature (London) 1989;342:299–302. doi: 10.1038/342299a0. [DOI] [PubMed] [Google Scholar]
- 26.Spinelli S, Liu Q Z, Alzari P M, Hirel P H, Poljak R J. Biochimie. 1991;73:1391–1396. doi: 10.1016/0300-9084(91)90169-2. [DOI] [PubMed] [Google Scholar]
- 27.Nicholson L K, Yamazaki T, Torchia D A, Grzesiek S, Bax A, Stahl S J, Kaufman J D, Wingfield P T, Lam P Y, Jadhav P K, et al. Nat Struct Biol. 1995;2:274–280. doi: 10.1038/nsb0495-274. [DOI] [PubMed] [Google Scholar]
- 28.Rodriguez E J, Debouck C, Deckman I C, Abu-Soud H, Raushel F M, Meek T D. Biochemistry. 1993;32:3557–3563. doi: 10.1021/bi00065a006. [DOI] [PubMed] [Google Scholar]
- 29.Fitzgerald P M, McKeever B M, Van-Middlesworth J F, Springer J P, Heimbach J C, Leu C T, Herber W K, Dixon R A, Darke P L. J Mol Biol. 1990;265:14209–14219. [PubMed] [Google Scholar]
- 30.Kumar S, Ma B, Tsai C J, Sinha N, Nussinov R. Protein Sci. 2000;9:10–19. doi: 10.1110/ps.9.1.10. [DOI] [PMC free article] [PubMed] [Google Scholar]
- 31.Chiti F, Taddei N, White P M, Bucciantini M, Magherini F, Stefani M, Dobson C M. Nat Struct Biol. 1999;6:1005–1009. doi: 10.1038/14890. [DOI] [PubMed] [Google Scholar]
- 32.Keskin O, Jernigan R L, Bahar I. Biophys J. 2000;78:2093–2106. doi: 10.1016/S0006-3495(00)76756-7. [DOI] [PMC free article] [PubMed] [Google Scholar]
- 33.Tsai C J, Xu D, Nussinov R. Protein Sci. 1997;6:1793–1805. doi: 10.1002/pro.5560060901. [DOI] [PMC free article] [PubMed] [Google Scholar]
- 34.Weaver L H, Grutter M G, Remington S J, Gray T M, Isaacs N W, Matthews B W. J Mol Evol. 1984;21:97–111. doi: 10.1007/BF02100084. [DOI] [PubMed] [Google Scholar]
- 35.Uchida T, Ishimori K, Morishima I. J Biol Chem. 1997;272:30108–30114. doi: 10.1074/jbc.272.48.30108. [DOI] [PubMed] [Google Scholar]
- 36.Navia M A, Fitzgerald P M, McKeever B M, Leu C T, Heimbach J C, Herber W K, Sigal I S, Darke P L, Springer J P. Nature (London) 1989;337:615–620. doi: 10.1038/337615a0. [DOI] [PubMed] [Google Scholar]
- 37.Moore S A, Anderson B F, Groom C R, Haridas M, Baker E N. J Mol Biol. 1997;274:222–236. doi: 10.1006/jmbi.1997.1386. [DOI] [PubMed] [Google Scholar]
- 38.Mossakowska D E, Nyberg K, Fersht A R. Biochemistry. 1989;28:3843–3850. doi: 10.1021/bi00435a033. [DOI] [PubMed] [Google Scholar]
Associated Data
This section collects any data citations, data availability statements, or supplementary materials included in this article.