Abstract
Specular microscopy can provide a non-invasive morphological analysis of the corneal endothelial cell layer from subjects enrolled in clinical trials. The analysis provides a measure of the endothelial cell physiological reserve from aging, ocular surgical procedures, pharmaceutical exposure, and general health of the corneal endothelium. The purpose of this review is to discuss normal and stressed endothelial cell morphology, the techniques for determining the morphology parameters, and clinical trial applications.
Keywords: specular microscopy, cornea, endothelium, analysis, clinical trial
Introduction
With the development of new refractive procedures, such as phakic intraocular lenses intraocular telescopes, new topical and intraocular drugs and solutions, there is a need for standardization and validation of corneal endothelial specular microscopy. Specular microscopy is a non-invasive technique to access the structure and function of the corneal endothelium. There are multiple specular microscope companies, each capturing the cell images at different magnifications and calibrations. A multi-center clinical trial may utilize several specular microscope models but it is important individual clinical sites use the same specular microscope throughout the study to lessen potential image magnification errors. The technical skill of the individuals capturing the images and analyzing the images must be evaluated using established criteria. The purpose of this review is to compare various methods of endothelial cell analysis and the variability associated with each method.
The Specular Reflex Light
Specular microscopy is used to view and record non-invasively the image of the corneal endothelial cell layer 1, 2. The clinical specular microscopes are all based on the laboratory microscope designed by Maurice 1 to provide a high magnification view of specular reflected light from the corneal endothelium. The specular reflex occurs at a regular, smooth surfaced interface of two refractive indices with the light from the subject having an angle of incidence equal to the angle of reflection to the observer. The endothelial cells can be imaged because the refractive index of the endothelial cells is greater than the 1.336 value for aqueous humor, thus reflecting 0.022% of the projected light 3. Early reports from 1920 describe the use of specular reflex light with the slit lamp to view the corneal endothelium 4.
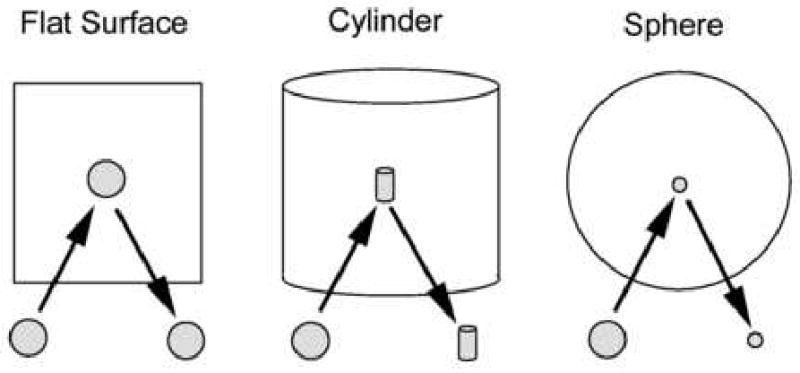
The surface area of the specular reflex is dependent upon the curvature of the reflecting surface (Figure 1). Thus, light reflected from a flat surface will reproduce the area of the light source, light reflected from a cylinder will be condensed 90° to the axis of the cylinder and light reflected from the surface of a sphere will be condensed in all axis. Therefore, the radius of curvature of the reflecting surface dictates the area of the specular reflex.
Figure 1.
The size and shape of the reflected image of the light source is modified by the reflecting surface. A flat surface reflects the image undistorted. The curved surface will bend the image into a minimized image.
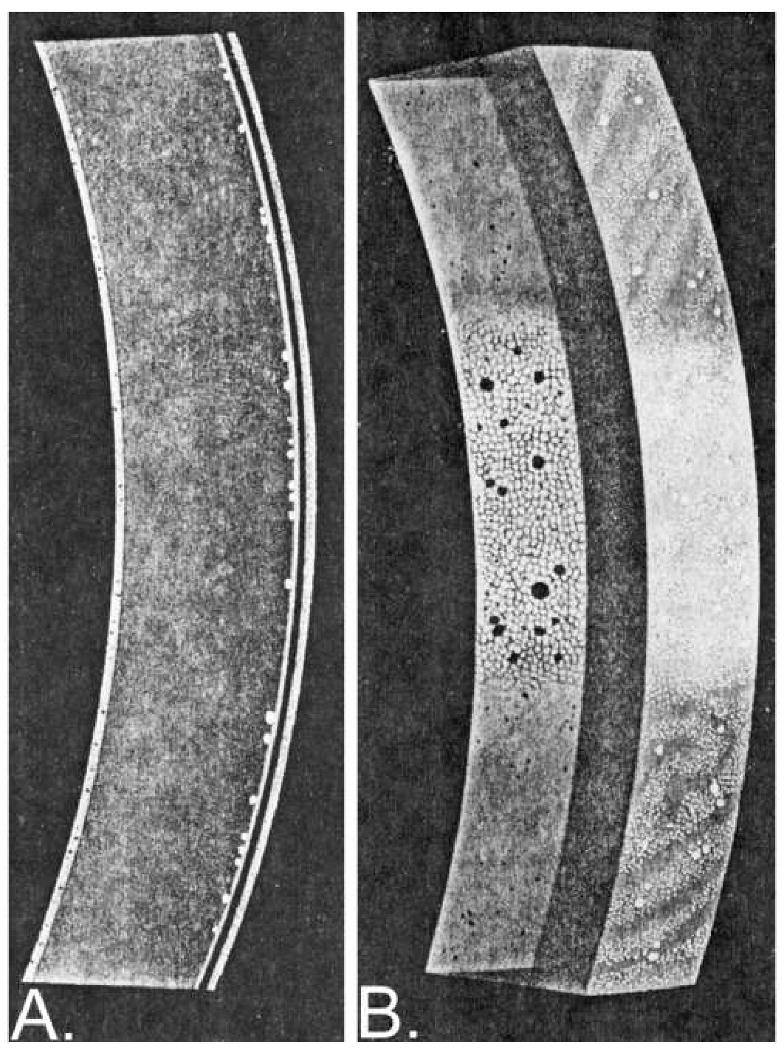
A further restriction in the area of the light reflex is caused by the proximity of the two concentric surfaces, i.e. the epithelium and the endothelium. The epithelial surface is highly reflective because of the large refractive index difference between air and the tear/epithelium. As the beam of light passes through the cornea it is reflected off the tear/epithelium interface and endothelial interface. The viewable specular area is a compromise between the beam width and the corneal thickness (Figure 2). Because of this restriction the viewable area of the endothelium is a rectangle and the radius of corneal curvature dominates the height of the rectangle.
Figure 2.
The endothelial cell area is a compromise between the width of the light beam and the thickness of the cornea 54. As the narrow slit light beam show in Figure A is broadened the light reflex can be seen from the rectangular epithelial and endothelial surfaces. As the slit width is increased further the epithelial surface reflex will encroach upon the endothelial reflex as shown in Figure B.
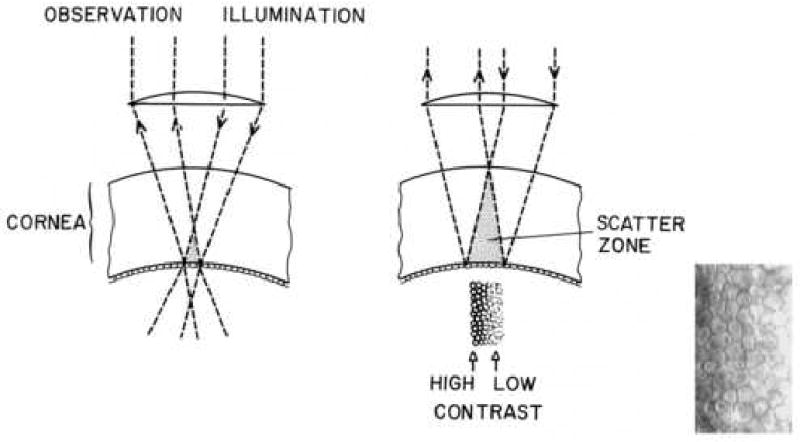
As the slit beam of light passes through the corneal stroma the light will be scattered from the collagen lamellae and keratocytes and will reduce the contrast of the endothelial cell image. The light scatter is compounded by increasing the width of the beam of light (Figure 3). Therefore, the left side of the endothelial image has greater contrast because the observer views the surface through minimal stromal light scatter.
Figure 3.
The endothelial cell layer image is increasingly degraded by light being scattered in the stroma. The endothelial cell micrograph insert demonstrated the contrast and light intensity gradient across the cell pattern.
The original laboratory specular microscope introduced by Maurice 1 has been redesigned by several commercial companies (appendix 1). All the presently available instruments utilize computer interfacing for image capture and endothelial cell morphology analysis. The instruments can be divided into either corneal epithelial cell layer contact or non-contact instruments. The contact instrument has an objective microscope lens that applanates the corneal surface requiring a topical anesthetic. While applanating the cornea the corneal curvature is flattened and the specular reflex area is enlarged (Figure 1). The non-contact instruments utilize automatic image focusing technology. The specular reflex area is smaller than the contact specular microscopes because of the curved corneal reflecting surface. In both cases the viewable endothelial cell layer areas are limited by the bright epithelial reflection surface and the corneal thickness (Figure 2). Therefore, the width of the viewable rectangle of endothelial cells with the contact and non-contact specular microscopes is equivalent. The height of the viewable rectangle of endothelial cells with the contact specular microscope, and the captured endothelial cell layer image with a cell density of 2500 cell per mm2 will only have 700 to 800 visible cells. A comparable endothelial cell layer imaged with the non-contact specular microscope will have 150 to 170 cells.
Normal Endothelial Cell Layer Morphology
When the human corneal endothelium is damaged the healing is a process of cellular enlargement and spreading to create a contiguous layer of cells on the inner surface of the cornea. The degree of endothelial cell loss from disease, trauma, chemical toxicity, etc can be documented with specular microscopy as an increase in individual cell surface area and a decrease in the endothelial cell density for the cornea. The corneal endothelial cell wound repair is also reflected as an increase in the variation of individual cell areas, i.e. polymegethism or coefficient of variation (CV). Six-sided cells are an indication of an even distribution of membrane surface tension and of normal cells. The polygon that has the greatest surface area relative to its perimeter is the hexagon. Thus, the most efficient cell shape to cover a given area is the hexagon; i.e. a perfect cornea should have 100% hexagons 5. The normal cornea can be expected to have 60% of the endothelial cell as hexagons. Stress to the endothelial cells will result in a decrease from the normal 60% distribution of 6 sided cells to a lesser percentage. The endothelial cell morphology analysis includes: cell area ±S.D. (μm2), cell density (cells/mm2), polymegethism (coefficient of variation, CV), and pleomorphism (% of 6 sided cells). The cell density is determined from the average cell area with the following relationship in equation 1:
| Equation 1 |
with cell density (cell per mm2), average cell area (μm2), and the value 106 is used to convert units of measure.
The patient's corneal endothelium consists of cells of varying surface areas. The polymegethism value is a coefficient describing the variation in cell area. As the standard deviation of the average cell area increases the accuracy of the estimated true cell density decreases. Therefore, increases in polymegethism causes a decrease in the accuracy of the average cell area. Polymegethism is defined by the coefficient of variation (CV) value determined with equation 2.
| Equation 2 |
with CV as coefficient of variation and SD as standard deviation of the mean cell area.
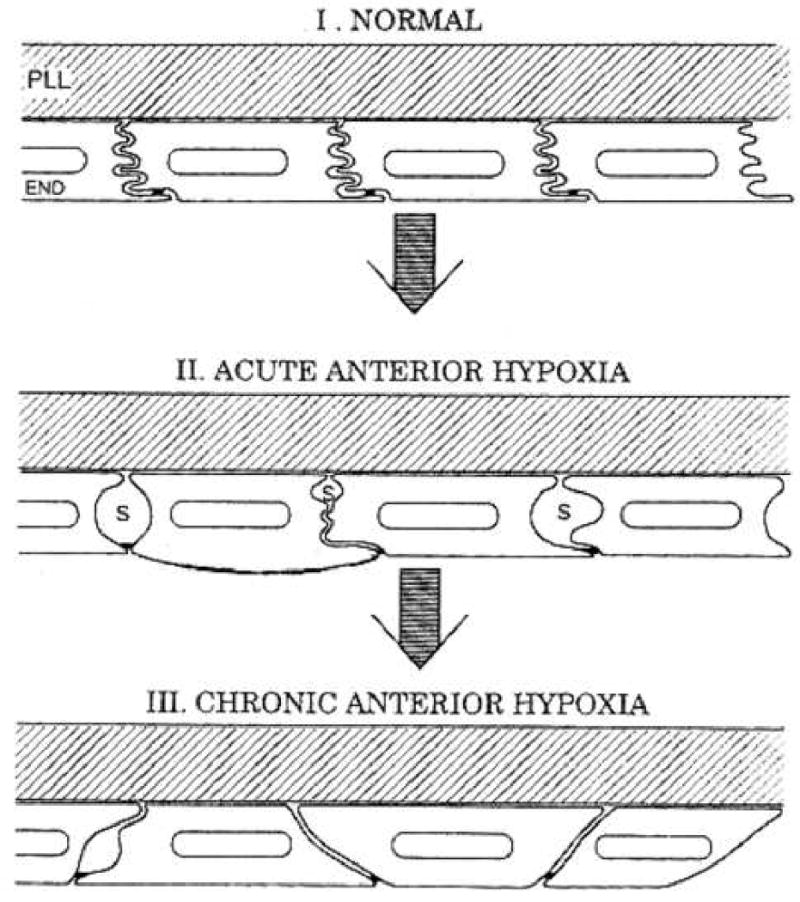
Long-term contact lens wearers and diabetic patients develop corneal endothelial cell polymegethism while still retaining normal cell density for their age 6 7 8 9 10 11, 12. Bergmanson 10 has shown that contact lens wear can stress the endothelium to alter the lateral endothelial cell borders resulting in the cell expressing a large anterior surface area with a small posterior surface area or visa versa (Figure 4). Thus, polymegethism may not alter the cell volume while altering the appearance of the cell surface interfacing with the aqueous humor in the anterior chamber. It should be noted that corneal endothelial cells are only hexagonal on the surface 10 13.
Figure 4.
The progressive development of corneal endothelial polymegethism has been hypothesized by Bergmanson 10
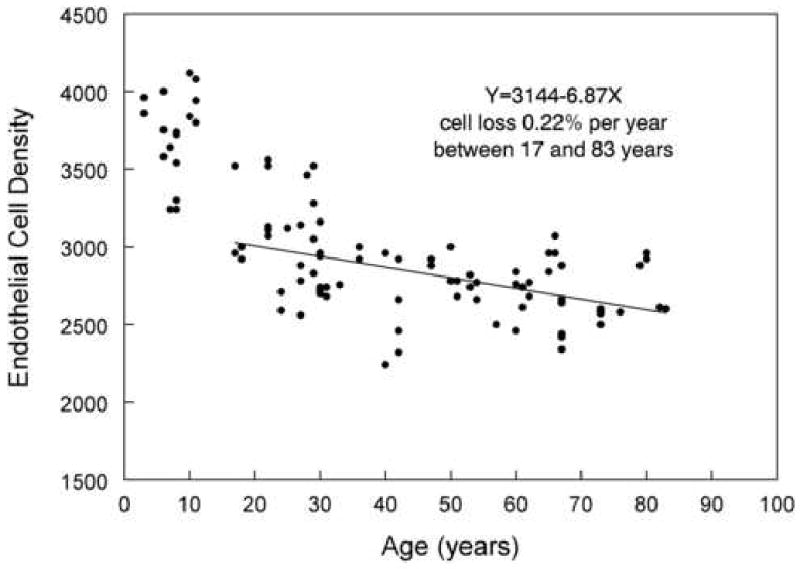
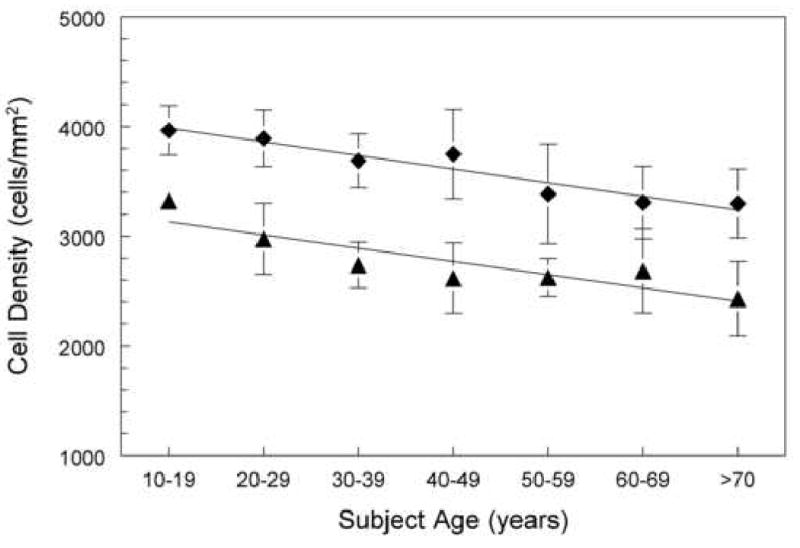
The human corneal endothelial surface area is approximately 130 mm2 14. The cell density of 3 to 6 year old children was measured to be 4000 to 3500 cells per mm2, i.e. there are 390,000 to 520,000 cells per cornea 15. This value decreases as the juvenile gets older and the corneal surface area increases. There are many graphic plots of this relationship reported in the literature 15-17. The non-invasive nature of the non-contact specular microscope enables data to be collected from young children (Figure 5). The data from young children shows a non-linear decrease in cell density with increasing age. Published studies show 3 year old children can have 4000 cells per mm2 15, middle adults (30 years of age) can have a range between 2700 to 2900 cells per mm2 15-17, and adults >75 years of age can have a range of endothelial cell densities between 2400 to 2600 cells per mm2 15-17. These values represent the Caucasian race. The Asian race have greater cell densities per given age group 18 (Figure 6). The range for these mean values can be significant. Estimating from published graphs, McCarey 19 showed a range of 600 cells per mm2 at a given age and Yee et al 20 showed a range of 1000 cells per mm2 at a given age. The range can be caused by technique inaccuracy or natural variation in cell area. This will be discussed further in the text within the variations in determining endothelial cell layer cell density estimates. These issues also apply to the polymegethism (CV) values. Yee et al 20 reported a CV range of approximately 0.22 to 0.31 for young adults with an average of 0.27. Throughout the literature endothelial morphology has been derived from less than 10 subjects per age. A larger sample population will increase the range while decreasing the standard deviation on the mean.
Figure 5.
A non-contact photographic macro-camera was used to document age verses endothelial cell density 15 in the Caucasian race. A linear regression line through 17 to 83 years of age resulted in a 0.22% cell loss per year.
Figure 6.
The cell density for Asian subject is greater at all age ranges than the Caucasion race. The data points (diamonds) are from a Japanese patient group (linear line, Y=4109-124X) and the data (triangles) are from an Caucasian American patient group (linear line, Y=3254-121X)18.
The Asian race have greater cell densities per given age group 18 (Figure 6).
Change in Endothelial Cell Density with Age
The topic of corneal endothelial cell loss in normal subjects with increasing age is of great concern when designing a clinical trial to assess the affects of a drug or surgical procedure on the corneal tissue. The consistent consensus is that a gradual decrease in cell density occurs with increasing age 21 22 23 24. As illustrated in Figure 5 and by Armitage et al 25, the cell loss is bimodal with 0 to 20 years demonstrating a more rapid cell loss per year than subject > 20 years old. The data graphed in Figure 5 15 had a 0.22% cell loss per year between 17 and 83 years (n=78). The decrease has been reported by Yee et al 1985 20 as 0.3% cell loss per year between 10 and 89 years of age (n=60). Moller-Pedersen 26 determined the cell loss for patients >14 years of age to be 0.3% per year (n=178). Bourne et al 27 re-photographed two sets of patients after a 10 year period. The authors grouped the patients who were <18 years old (5 to 15 years, n=10) and >18 years old (n=42). The younger patient cohort had a 1.1% ±0.8% per year loss in endothelial cell density; the older patient cohort had 0.6%±0.5% per year loss.
Edelhauser and collaborators 28 29 30 have observed an interesting relationship between the location of the endothelial cells and cell density decrease with age. The cell density decreases in the human cornea from the periphery to the center by 9% 28, 30. The cell density location effect is extended with increasing age as a further decrease in cell density 29.
Regional Post-Trauma Endothelial Cell Layer Morphology Changes
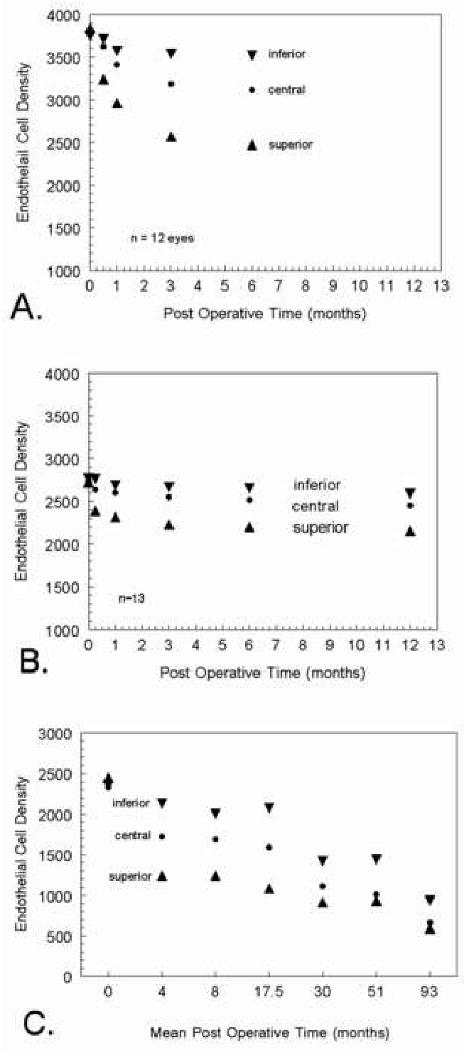
Documentation of potential endothelial cell stress is determined from central endothelial cell densities. If a surgical procedure is localized to a specific region of the cornea, such as the peripheral, superior, etc, then it maybe necessary to capture images from several regions on the endothelium. This was the case with the evaluating the effects of Intacs™ on the corneal endothelium. The FDA required central, 10 o'clock, and 6 o'clock peripheral readings 31. The chronological progression of peripheral endothelial cell layer trauma on the central endothelium must be taken into consideration when designing a data collection timetable. Inaba, 1985, 32 examined 12 eyes after intracapsular cataract extraction (ICCE). A standard 170° cataract incision in the superior limbal region was used to remove the lens without implanting an IOL. The superior, central and inferior endothelial cell densities were approximately equal prior to surgery. At two weeks post-surgery the superior endothelial cell density was greatly reduced (Figure 7A). At the end of 6 months post surgery the inferior cell density reduced from 3800 to 3500, the central cell density reduced from 3800 to 3100 and the superior cell density reduce from 3800 to 2500. The same sequence of events occurred in a series of patients following extracapsular cataract extraction (ECCE) 33 (Figure 7B). The endothelial cell layer density disparity in regions remained with little change during the 1 month to 12 month follow up examinations with specular microscopy. Hoffer 34 examined a group of patients with various post surgery durations ranging from 2 weeks to 102 months (8.5 years). The data was grouped in escalating time periods and plotted relative to endothelial cell density (Figure 7C). Once again the same sequence of events occurred in this series of patients. There was a gradual unification in the endothelial cell density values for the three regions between the 12 month and 102 month follow ups. Bourne et al 35 showed that ten years after cataract extraction eyes continued to lose endothelial cells from the central cornea at the rate of 2.5% per year. We must conclude that regional trauma to the corneal endothelium is very slow to show cell recovery. The central endothelium does indicate the presence of a peripheral region trauma but is presumably affected by the peripheral trauma for at least 5 to 8 years.
Figure 7.
Mean endothelial cell density values for ICCE patients (Inable eta 1985 32) are plotted in Graph A to demonstrate regional endothelial cell changes after superior incision ICCE. In Graph B, ECCE patient data from Schultz et al 33 shows regional endothelial cell changes after ECCE with IOL implantation with 1% sodium hyaluronate (Healon). Regrouped data from Hoffer 34 on regional endothelial cell changes after ECCE and phacoemulsification cataract extraction is plotted in Graph C.
Effect of Contact Lens Wear on Endothelial Morphology
Often patients requesting a refractive surgical procedure may not have a history of previous surgeries but have worn contact lenses. Contact lenses can causes transient and chronic endothelial cell morphology changes 7, 36, 37. Hirst et al 7 compared 22 patients wearing PMMA contact lenses with a mean wearing time of 13 years to an age matched control group. There was no difference in the mean endothelial cell density but the contact lens wearers had statistically greater polymegethism (coefficient of variation) than the controls (p<0.004). McLaughlin 38 found reducing the stress from the contact lens wear may have some early effect on the endothelial cell density but did not improve the coefficient of variation within a 3 year study. These studies indicate that polymegethism and pleomorphism associated with contact lens wear may not be rapidly reversible. Other authors have confirmed the observation of no difference in cell density between patients wearing PMMA contact lenses and aged matched control groups 7, 39-43.
Techniques and Errors in Determining Endothelial Cell Density
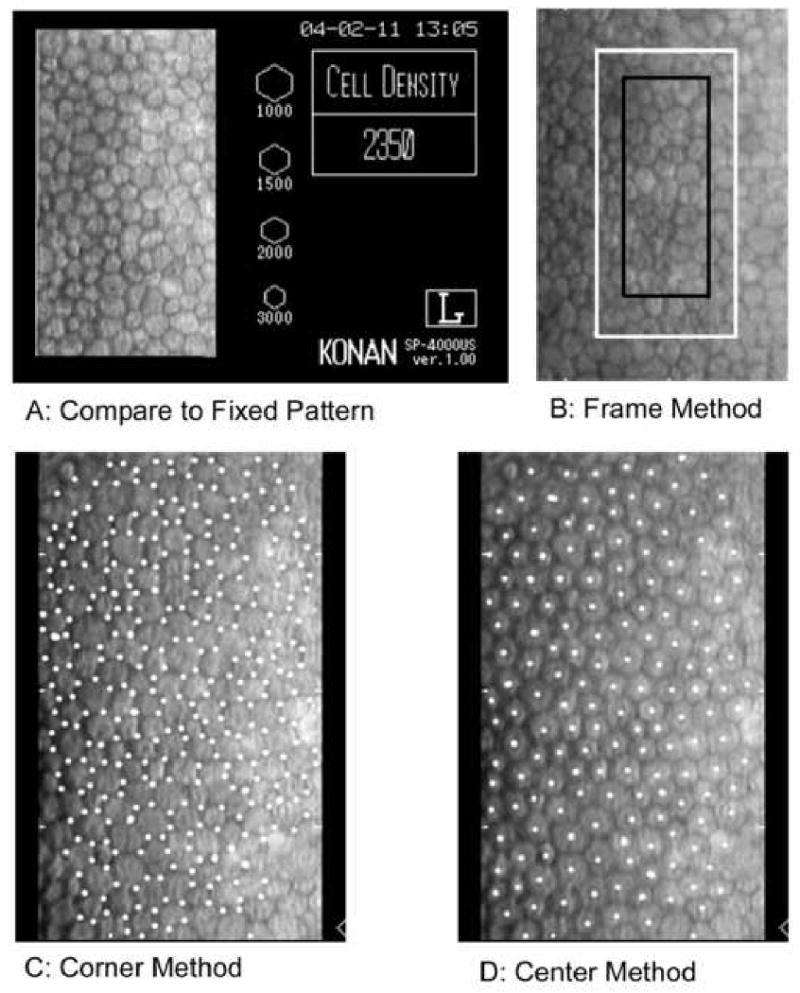
The endothelial cell density analysis can be performed by (1) comparison method, (2) frame method (fixed or variable), (3) corner method, and (4) center to center method (Figure 8). Regardless of the technique, accuracy is dependent upon the quality of the endothelial cell image to identify individual cells. The Corneal Donor Study Group 44 determined the cell density analysis differences between technicians using excellent quality images was 0%±6%, whereas fair images had a difference of 6%±11%. In a similarly designed study 45 the median differences between two technicians was 2% for excellent images and 4% for fair images.
Figure 8.
There are four techniques to analyze the endothelial cell images; (A) compare relative cell size to standards, (B) count cells within a predetermined fixed frame with the frame size significantly affecting accuracy, (C) an algorithm using inputted cell corners, and (D) an algorithm using inputted cell centers.
The comparison method provides subjective cell density value by a visual comparison of the patient's endothelial cell pattern to a known set of hexagon patterns for various cell densities (Figure 8A). This is typically performed while viewing the patient's endothelium or from the hexagon patterns included on the cell image window.
The frame method provides a numerical assessment of the cell density by counting the number of cells within a frame (Figure 8B). To adjust for cells extending outside of the frame; the partial cell extending over two adjacent frame borders are counted as full cells. The cells extending outside the frame on the corresponding two adjacent frame sides are not counted in the analysis. Next, the number of cells counted in the frame is converted to cells per square mm. The individual cell areas and the mean endothelial cell areas are not determined. The frame method accuracy is depended upon the subjective decision to define a cell, the size of the frame, and image magnification.
In Figure 8B two frames are embedded upon an endothelial cell image. The white frame (area of 0.036 mm2) is twice the surface area of the black frame (area of 0.018 mm2). If there are 90 cells counted per 0.036 mm2 with the white frame then the cell density is determined by the following by the ratio in equation 3:
| Equation 3 |
Accordingly, if there are 45 cells counted per 0.018 mm2 with the black frame then cell density is determined by the ratio in equation 4:
| Equation 4 |
In this example, the smaller frame has a two-fold multiplier of possible errors in identifying cells and increasing the variability of endothelial cell density measurements. A recent publication 45 used a variable frame technique in which several non-adjoining clusters of cells were analyzed within a single endothelial cell captured frame. This enables non-contiguous cells to be included in the analysis, which enables less quality images to be analyzed.
The corner method is performed with a photograph print. The intersecting cell sides are located and inputted into a digital pad to define the area of the cell polygon (Figure 8C). Computer programs are used to calculate the endothelial cell morphology parameters of cell area and number of sides per cell. The corner method accuracy is determined by a subjective decision of defining the cell borders and applying the appropriate image magnification. If the endothelial cell pattern requires a paper photographic process, then this will enter another opportunity for magnification errors during photographic printing, as well as the digitizer pad magnification entry. The errors are subjective decisions of determining the cell border intersections and on the calibrating and resolution of the digitizing tablet. The latter problem can be minimized by using prints with a magnification of greater than 400 46. The entire procedure has an estimated error of approximately 5%.
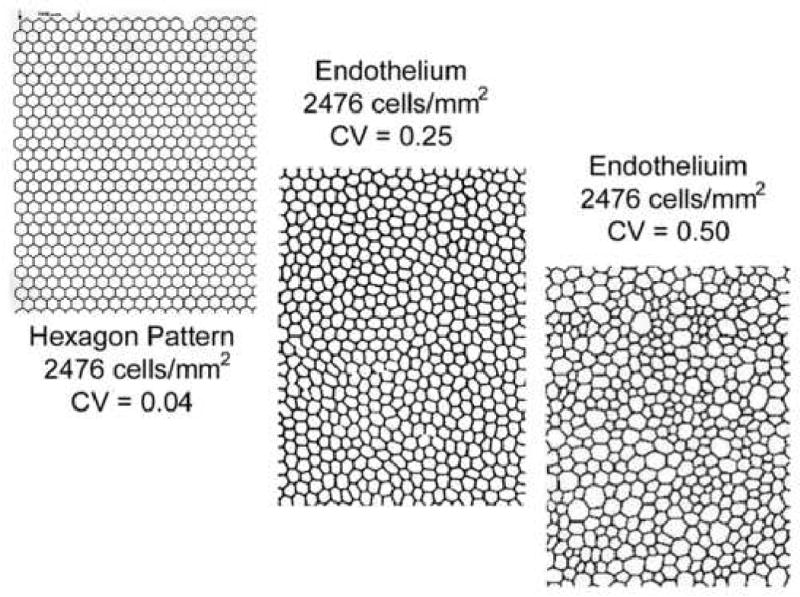
Hexagon Pattern
The center to center method is presently the most common technique with the specular microscope (Figure 8D). The Konan Specular Microscope (Konan Medical USA., Torrance, CA) is provided with KSS-300 analysis software. Other specular microscope companies provide their own proprietary software. It is a quicker data entry method and easier to approximate the center of the cells than determining the intersecting cell borders. The computer mouse is used to dot the center of the captured specular microscope digital cell image. A cluster of adjacent cells grouped in a circle or rectangle are entered with dots. A nearest neighbor algorithm is used to calculate the area of the cell polygon47. The algorithm is based upon a pseudo-inscribed circle within a central cell. The average radius to the center of adjacent cells is determined to calculate the area of the cell. The endothelial cell morphology parameters of cell area and number of sides per cell are calculated. The error can range form 0.5% to 5.0%. Comparison of the corner method and the center method have been reported in the literature to be equivalent 47 48 49. In our experience this will depend greatly upon the diligence of the technician performing the analysis.
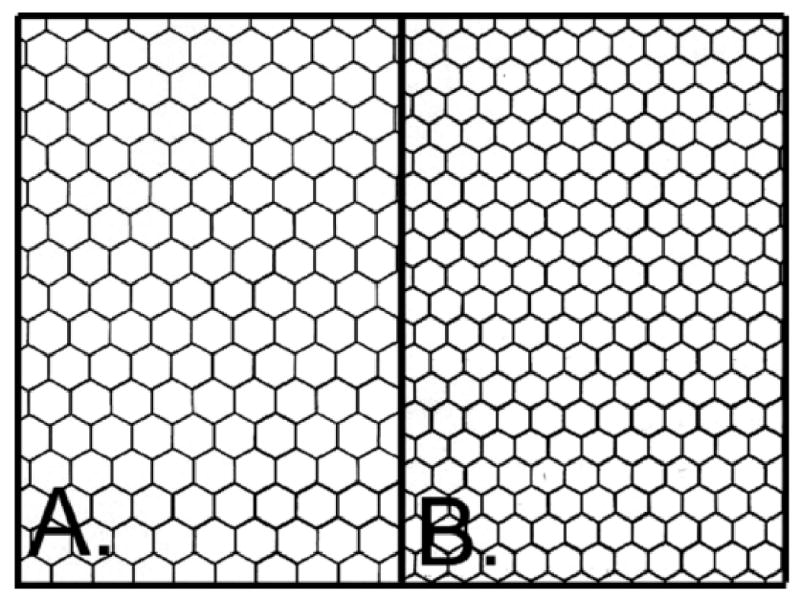
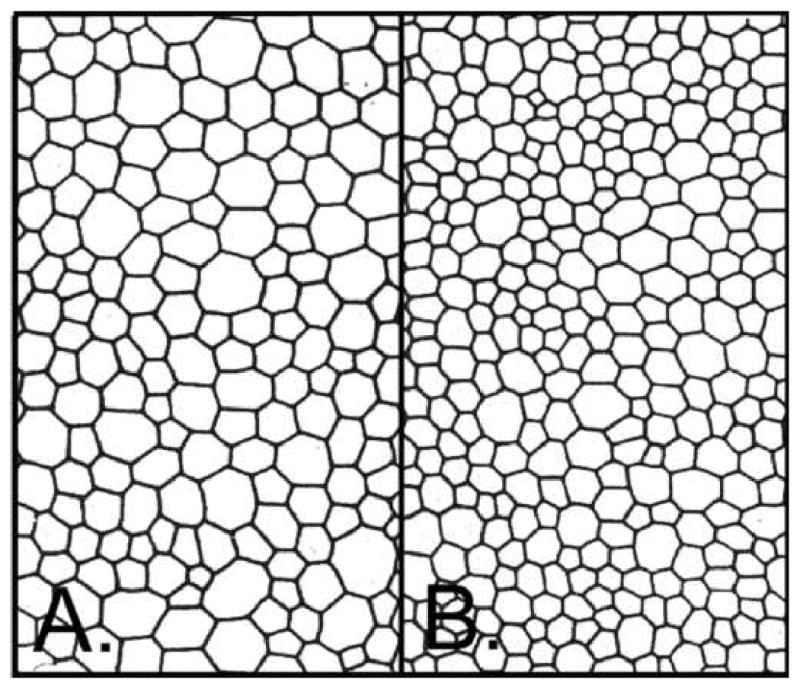
The center to center method accuracy is determined by a subjective decision to define a cell, omitting a cell(s), double entering cells, centering the dot in the cell, and image magnification. The accuracy of the endothelial cell morphology analysis algorithm can be assessed by importing a perfect hexagon pattern into the KSS300 software. Two patterns densities were chosen for study; i.e. a 1700 hexagon density and a 2500 hexagon density (Figure 9). By carefully placing a dot at the hexagon center the resulting hexagon densities were 1699±2 cells per mm2 (n=10) with 91 cells counted per field and 2500±4 cells per mm2 (n=9) with 144 cells counted per field. Placing the dot off center in the cell will have minimal effect on determining the cell areas. A simple test was performed to assess the effect of off centering the dots. Dots were place off center by 50%, i.e. half way between the center and border of the hexagon, in a progressively increasing number of hexagons for up to 15 hexagons. The per cent errors from the best center values were <0.1% ± 0.1% for 1700 hexagons per mm2 and <0.1% ± 0.1% for 2500 hexagons per mm2. There was no progressive increase in the error per hexagon as the number of off center hexagons increased. Off centered dots will increase mean cell area standard deviation but has little effect on mean cell area value which is used to calculate cell density (Equation1). The effect of omitting cells during analysis was evaluated by progressively omitting up to 10 hexagons randomly spaced in the field. The per cent errors from omitting hexagons were 1.0% ± 0.1% per hexagon omitted for 1700 hexagons per mm2 and 0.6% ± 0.1% per hexagon omitted for 2500 hexagons per mm2. The error in determining cell density from omitting cells in the analysis field was linear. If 5 hexagons were omitted per field, then the total error would be 5.0% for the 1700 density and 3.0% for the 2500 density.
Figure 9.
A perfect hexagon pattern can be imported into the Konan KSS300 software for analysis. Figure A is a 1600 density (hexagon per mm2). Figure B is a 2500 density (hexagon per mm2).
Patient Endothelial Cell Pattern
A tracing of the endothelial cell pattern from a patient (Figure 10) was analyzed with carefully centered dots. The pattern in Figure 10A was analyzed 10 times with 78 cells counted per analysis yielding a mean of 1470±3 cells per mm2, CV = 41±1, cell area = 680±278 μm2, pleomorphism = 45±2 % six sided cells. The pattern in Figure 10B was analyzed 10 times with 147 cells counted per analysis yielding a mean of 2627±5 cells per mm2, CV = 48±1, cell area = 381±183 μm2, pleomorphism = 51±1% six sided cells. The analysis was re-performed after off centering 1 to 10 dots by 50%. The series was repeated 10 times by off centering large cells and 10 times by off centering small cells. The error in determining cell density by off centering large cells was <0.1% ± 0.1% per cell for the 1470 cell density pattern and 0.2% ± 0.1% per cell for the 2627 cell density pattern. The error in determining cell density by off centering small cells was -0.1% ± 0.1% per cell for the 1470 cell density pattern and -0.03% ± 0.1% per cell for the 2627 cell density pattern. Off centering the dots on a cell caused insignificant error. Off centered dots will increase mean cell area standard deviation but has little effect on mean cell area value which is used to calculate cell density (Equation 1). The large irregular cells caused less variability than small cells. The difference is most likely reflecting the number of cells counted rather than cell shape.
Figure 10.
A perfect drawing of a patient's endothelial cell pattern can be imported into the Konan KSS300 software for analysis. Figure A is a pattern of 1470 cells per mm2. Figure B is a pattern of 2625 cells per mm2.
The effect of omitted a cell during analysis was evaluated by progressively omitting up to 10 large cells and 10 small cells randomly spaced in the field. The percent errors from omitting large cells were 1.0% ± 0.2% per cell omitted for 1470 cells per mm2 and 0.7% ± 0.1% per cell omitted for 2627 cells per mm2. The percent error from omitting small cells was 1.1% ± 0.1% per cell omitted for 1470 cells per mm2 and 0.5% ± 0.1% per cell omitted for 2627 cells per mm2. There was no progressive increase in the error per cell as the number of omitted cells increased. If 5 cells were omitted per field, then the total error would be 5.1% for large cells and 5.4% for small cells omitted on a 1470 cells per mm2 cornea and 3.4% for large cells and 2.6% for small cells omitted on a 2627 cells per mm2 cornea.
Identifying a cell in a specular micrograph can be difficult. The cell border is defined by shadows in the image. The shadows can be incomplete around the cell or extend across the center of the cell. In each case the subjective decision requires experience by the reader to be performed with consistency. Poor recognition of the cell borders can result in errors of omitting cells or double entering cells during the analysis. For each cell omitted from a 100 cell analysis field there will be approximately a 1% reduction in the calculated cell density for an endothelial cell pattern of 2500 cells per mm2. The error estimate is affected by the number of cells counted and cell density. For cell densities of <2500 cells per mm2 the error effect becomes greater. For each cell with an extra dot, i.e. double entered, there was approximately a 1% (0.6% to 0.8%) increase in the calculated cell density for an endothelial cell pattern of 2500 cells per mm2. Once again, this is affected by the number of cells counted and cell density.
Technically, the image magnification is an automatic feature controlled by the manufacturer, but if images are imported from other specular microscopes or the instrument's calibration drifts then an error can occur. The Konan default calibration is 124 pixels per 100 μm, i.e. 1.24 pixels per 1 μm on the endothelial cell image. An error in calibration will result in 1.6% cell density per calibration pixel. A 2 to 3 pixel error is very easy to enter while attempting to mark the distance between the 100 μm calibration ticks. This can result in a 3.2% to 4.8% error. The error can become significant when determining the cell density and depends on the skill of the technician and the quality of the image, it is possible to have several of the above described error sources per image. Therefore, a 10% error in estimating the endothelial cell density is possible.
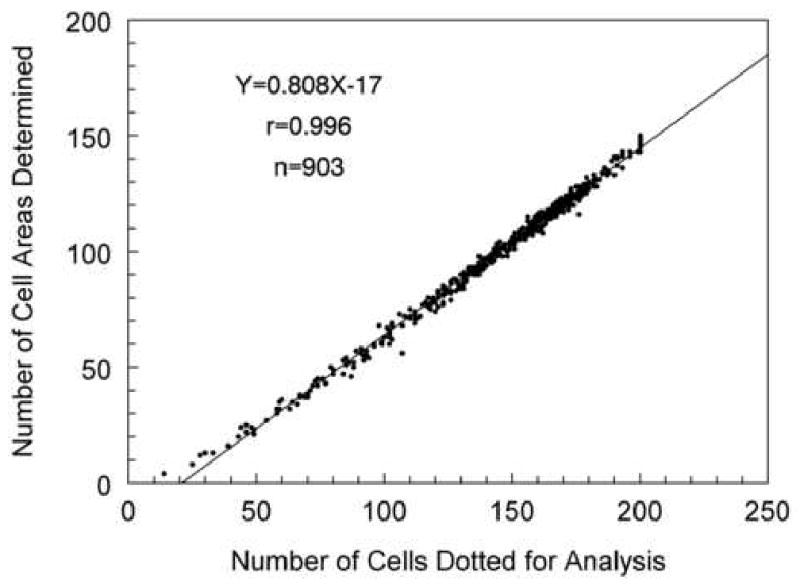
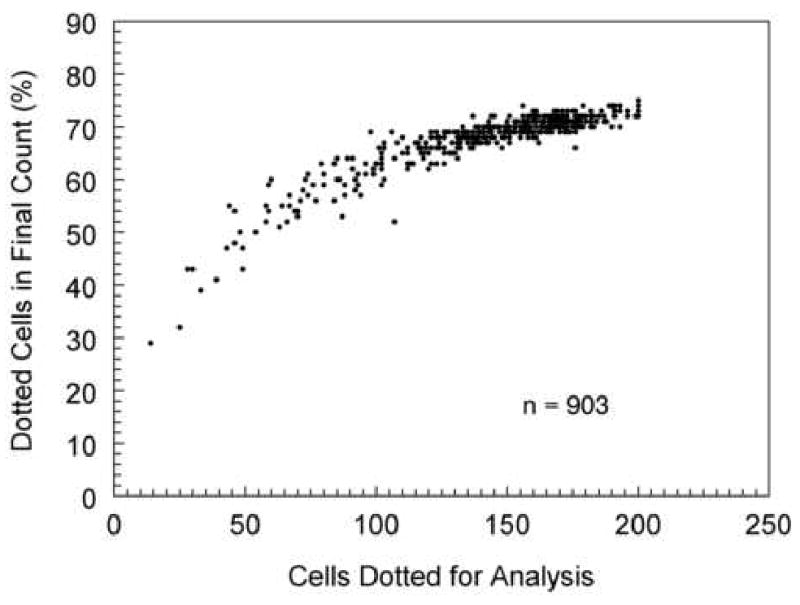
The center to center method, which is utilized by the Konan Robo Specular Microscope, requires a cell to be identified contiguous to each side of the analyzed cell. Thus, if you placed a dot on a cell and six contiguous cells surrounding the center cell, then the analysis result would be the area of one 6-sided cell. In this example seven cells were used to define the area of one cell. As more cells are analyzed the relationship plotted in Figure 11 is defined. A plot of the same data to determine the per cent of cell areas calculated from visible cells dotted for analysis is shown in Figure 12. After dotting 100 cells, the cell area is determined for approximately 70% of the dotted cells. Therefore, in order to calculate 100 cell areas the center of 150 cells must be defined.
Figure 11.
The center to center analysis method requires more cells identified and dotted than in the final cell area analysis. In order to define the area of a 6-sided cell, the six adjacent cells must also be located. Thus, to define the area of the 6-sided cell requires placing dots in 7 cells. To define the area of 100 cells, dots must be placed in the center of 150 cells. The relationship is linear (Y=0.808X-17) and can not exceed 200 cells dotted because of a maximum data entry in the analysis software.
Figure 12.
The same center to center data set presented in Figure 11 is re-plotted as the per cent of cells doted relative to the number of cell areas defined. If 50 cells are dotted then cell area will be defined for 45% of the dotted cells. This relationship plateaus at approximately 70%.
Endothelial Cell Morphology Analysis: number of cells analyzed verses polymegethism
The number of cells counted to obtain a maximum accuracy per image has been suggested by Laing et al 21 to be at least 30 cells per image, Doughty 50 suggests at least 75 cells per image and Inaba et al 32 prefers using 100 cell per image. Binder et al 22 expanded the guideline by suggesting as many cells in the image frame as possible, with three images per patient from the center and paracentral regions. The average of the 3 images is used to define the cell density. As discussed at the end of the section entitled “The Specular Reflex Light”, the non-contact (or small field) specular microscope can capture 120 to 170 cells on a cornea with a cell density of 2500 cells per mm2. For a cornea with a cell density of 2500 cells per mm2, a single capture of 120 cells per field is only 0.04% a population of 325,000 cells per cornea. The issue of the sample representing the full population of endothelial cells on the cornea is critical.
Hirst et al 51, 52 investigated the sampling accuracy from “Population Estimated” values for the corneal endothelial cell morphology of 9 patients analyzed by digitizing photographic prints of the central 3000 cells of the corneas. Hirst et al 51 evaluated the accuracy of using a 120 cell field sample in representing the “Population Estimated” morphology. They determined that there is a 21.8% chance of detecting a 10% change in the endothelial cell density of a homogeneous normal polymegethism cornea (Table 1). The likelihood of detecting the 10% change in an extreme polymegethism cornea decreases to 10.8%. If 9 sample fields of the homogeneous normal polymegethism corneas are analyzed, then there is a 99.4% chance of detecting a 10% change in the endothelial cell density. Comparably, in an extreme polymegethism cornea, the likelihood of detecting the 10% change becomes 72.5%.
Table 1.
The chance of a sample mean to be within ±10% of the “Population Estimated” Mean was determined for various degrees of polymegethism corneas (data from Hirst et al 49).
| Chance of Recognizing a 10% Difference in a Sample Mean* from the “Population Estimated” ** mean using: | ||||
|---|---|---|---|---|
| Endothelial Cell Pattern (n = # patients) | 1 sample | 3 samples | 5 samples | 9 samples |
| Homogeneous (n=3) | 21.8% | 72.5% | 80.7% | 99.4% |
| Moderate Polymegethism (n=3) | 17.6% | 52.4% | 76.3% | 99.1% |
| Extreme Polymegethism (n=3) | 10.8% | 33.2% | 45.6% | 72.5% |
Sample Mean was derived from the mean of 40 samples of sets of 1, 3, 5, or 9 samples of 120 cells.
The “Population Estimated” mean is derived from approximately 3000 cells from a wide field specular micrograph.
In Table 2 the accuracy of the sample mean cell area is expressed as a range from the “Population Estimated” mean cell area. For example, if the “Population Estimated” mean cell area is 400 mm2, i.e. 2500 cells per mm2, then 40 repeated efforts using a single sample of 120 cells per sample field would have a range of ±14.4% of the “Population Estimated” mean for a homogeneous endothelium. Thus, a sample could have a value within a range of 2138 to 2862 cells per mm2, which is a ±362 cells per mm2 spread. Table 2 demonstrates a reduction in the range by increasing the number of sample photographic fields used to calculate the patient's sample mean cell density. Using 3 sample fields of a homogeneous endothelium will reduce the sampling error to ±7% from the “Population Estimated” mean. Because each human cornea has a unique – polymegethism, it is difficult to predetermine the number of cells required to achieve a specific level of accuracy. If one assumes moderate polymegethism and 3 sample photographs of 120 cells counted per photograph, then the sample mean cell area will be ±8.9% from the “Population Estimated” mean cell area.
Table 2.
As the sample range decreases; the accuracy of estimating the “Population Estimated” Mean increases (data from Hirst et al 49).
| Sample Mean* Endothelial Cell Area Range from “Population Estimated” Mean** Cell Area using: | ||||
|---|---|---|---|---|
| Endothelial Cell Pattern (n = # patients) | 1 sample | 3 samples | 5 samples | 9 samples |
| Homogeneous (n=3) | ±14.4% | ±7.0% | ±5.4% | ±3.9% |
| Moderate Polymegethism (n=3) | ±21.6% | ±8.9% | ±6.3% | ±3.8% |
| Extreme Polymegethism (n=3) | ±27.6% | ±13.5% | ±9.9% | ±5.7% |
The Sample Mean was derived from the mean of 40 repeated efforts using sets of 1, 3, 5, or 9 samples of 120 cells.
The “Population Estimated” Mean is derived from approximately 3000 cells from a wide field specular micrograph.
Hirst and collages expanded the data analysis in Tables 1 and 2 to including all the endothelial cells within the central 4 mm diameter zone of the cornea 52. For homogeneous endothelial cell corneas (n=2), they counted 25,416 to 28,048 cells per cornea. For moderate polymegethism corneas (n=4), they counted 18,912 to 23,036 cells per cornea. For marked polymegethism corneas (n=5), they counted 5266 to 14,490 cells per cornea. By counting all the cells within the central 4 mm of the cornea, the “Population” mean for the endothelial morphology of the patient's central corneal endothelium was defined. Photographing the entire central 4 mm of the cornea was accomplished with 26 ± 6 (20 to 41) overlapping wide-field (contact) specular micrographs. Each wide-field specular micrograph was considered to be equivalent to 25 small-field (non-contact) specular micrograph fields. In Table 3, increasing the number of samples (approximately 120 cells per sample) increases the chance of the sample mean being within 10% of the “Statistical Population” mean. This observation is less likely as polymegethism increases. For example, in Table 3 a patient with a CV of 0.29 has a 73% chance of the sample mean being equal to the “Population” mean when using one photographic sample. Using 9 photographic samples increases the accuracy to 76%. Therefore, this more rigorous analysis (as compared to the earlier Hirst publication 51) comes to the same conclusion but with less confidence. Even counting the entire wide-field specular micrograph did not permit a reliable estimate of the true central “Population” mean of the corneal endothelium. If 25 random small-field (non-contact) specular micrographs (25 fields × 1200 cells/field = 3000 cells) were counted, then 92% to 23% of the sample means were within ±10% of the “Statistical Population” mean in this 11 patient study. Corneas with a less extreme polymegethism values range from 0.29 to 0.37 had predictability ranging from 92% to 63%. A unique observation from the analysis was that random sampling within the central 4 mm diameter zone of the cornea gave a better estimate of the “Population” mean. This is an indication of endothelial cell “clustering” effect. The data demonstrates how an increase in samples (images) decreases the variability. This variability relationship will be valid regardless of the specular microscope used or the analysis algorithm used.
Table 3.
The larger the chance of recognizing a sample mean to be within ±10% of the “Population” Mean then the less spread exist in the sample means (data from Hirst et al 50).
| Chance of recognizing a 10% Difference with a Sample Mean* from the “Population” Mean** using: | |||
|---|---|---|---|
| Endothelial Cell Pattern CV | 1 sample | 9 samples | 25 samples |
| 0.29 | 73% | 76% | 92% |
| 0.31 | 86% | 71% | 83% |
| 0.32 | 87% | 69% | 76% |
| 0.33 | 47% | 100% | 95% |
| 0.33 | 43% | 56% | 63% |
| 0.34 | 71% | 86% | 92% |
| 0.37 | 59% | 74% | 78% |
| 0.37 | 29% | 48% | 73% |
| 0.42 | 21% | 35% | 23% |
| 0.66 | 36% | 27% | 27% |
| 0.83 | 54% | 54% | 48% |
Sample Mean was derived from 40 sets of randomly selected sets of 1, 9, or 25 samples of 120 cells.
“Population” Mean was determined from all the cells within the central 4-mm diameter zone of the cornea
Repeatability
Jones et al. 53 determined the repeatability of the Konan ROBO non-contact specular microscope by capturing 36 images of each eye from one subject during a 4 month period. An assumption is made that the endothelial cell morphology does not significantly change during the 4 month period. The mean (± S.D.) cell density for OD was 2545 ± 45 cells per mm2. Since 99.7% of a normally distributed population is within 3 standard deviations, then the range of samples is 2680 to 2410 cells per mm2 (± 5.3%). The mean cell density for OS was 2600 ± 41 cells per mm2 with 99.7% of the samples within 2723 to 2477 cells per mm2 (± 4.7%). The high level of repeatability reflects the low polymegethism of the patient at 0.27 to 0.28 and the skill of the technician.
Repeatable analysis is also dependent upon repeatable identification of a cell, i.e. the cell borders. This is directly related to the image quality, i.e. good, fair, poor, or impossible, which is determined by the number of cells visible in the field. Each technician may have a different subjective ability to identify an individual cell. Benetz et al. 45 found that image quality evaluation of 688 images by two technicians was identical only 64% of the time. Specular Microscopy Reading Center repeatability is best achieved by a single technician. Image quality labeling will be discussed further in the section entitled “Guide for a Specular Microscope Reading Center Regarding Quality of Image verses Number of Cells Countable”.
Effect of Number of Cells Used to Determine Cell Density and Coefficient of Variation
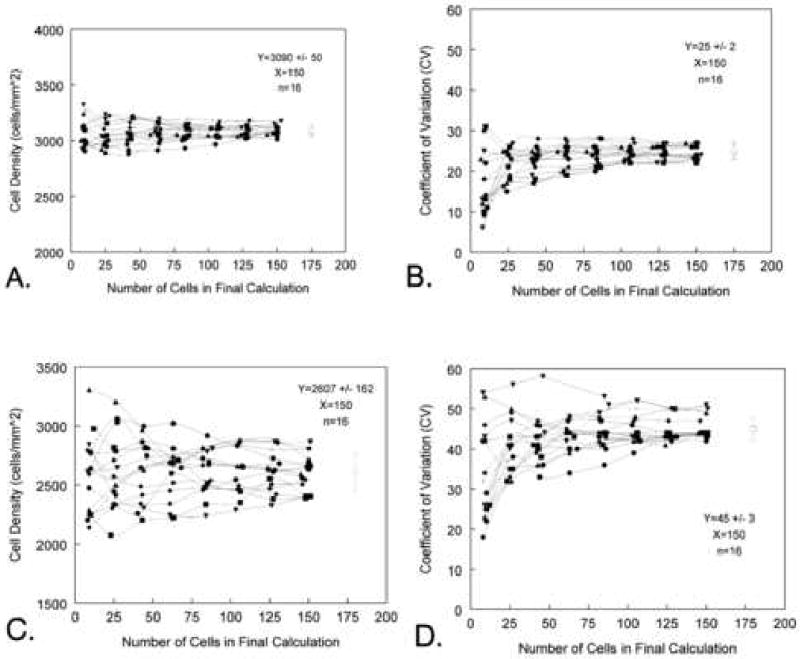
The problem of sampling can be presented in the following example. A large field of approximately 3000 endothelial cells with a 0.25 coefficient of variation value was imported into the Konan KSS-300 software (Konan Medical USA., Torrance, CA). The large field was subdivided into 16 fields of approximately 200 cells. Each of the small fields was analyzed for the endothelial cell morphology by counting an increasing number of cells in sets of 10, 25, 50, 75, 100, 125, and 150 cells. This effort was repeated for each of the 16 small fields, thus yielding 16 sets of data graphed in Fgure 13A. The mean endothelial cell density for the 16 sets of 150 cells counted in Figure 13 is 3090 ± 50 cells per mm2. The estimated cell density when counting 10 cells per sample has a range of 2907 to 3322 cells per mm2. The spread in values decreased with an increase in the number of cells counted until 125 cells were counted per sample. The characteristic spread of the cell density plot is repeated for the coefficient of variation values (CV = 25 ± 2) in Figure 13B. The general relationship between the accuracy in estimating the cell density and the number of cells counted in the analysis is repeated for a corneal endothelium with a 0.45 coefficient of variation (Figures 13C and D). The major difference is the cornea non-homogeneous with CV=45 have a much greater spread in the data even with 150 cells counted. The mean endothelial cell density for the 16 sets of 150 cells counted in Figure 13C is 2607 ± 162 cells per mm2.
Figure 13.
The effect of endothelial cell coefficient of variation relative to the number of cells counted per field is demonstrated in Figures A to D. Figures A and B are from a corneal with CV=25. Based on Graph A, a minimum of 75 cells per field should be counted to best represent cell density. In Figure B illustrates the large variation in estimating the coefficient of variation when counting <25 cells per field. Figures C and D were generated from a corneal with a coefficient of variation of 45. As the coefficient of variation increases the estimate for the endothelial cell density has a large increase in variation.
Number of Cells to Count per Sample
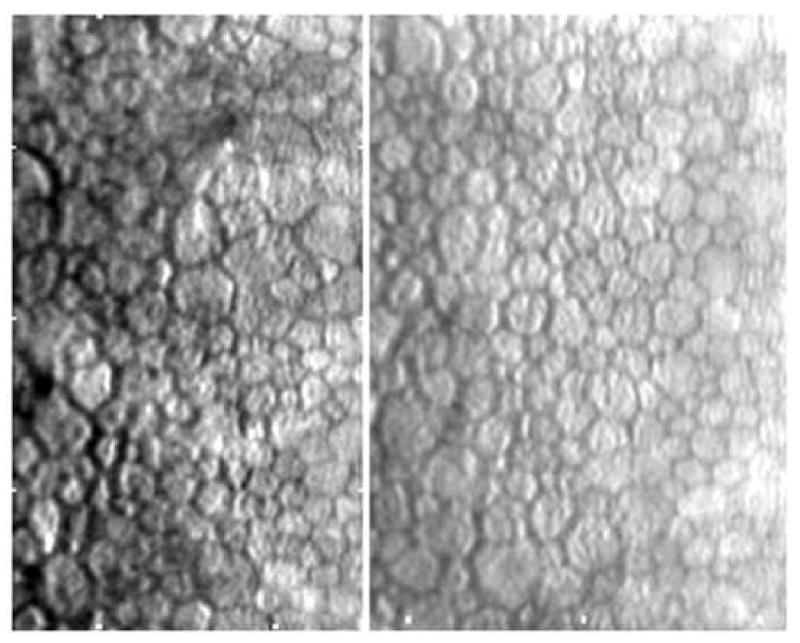
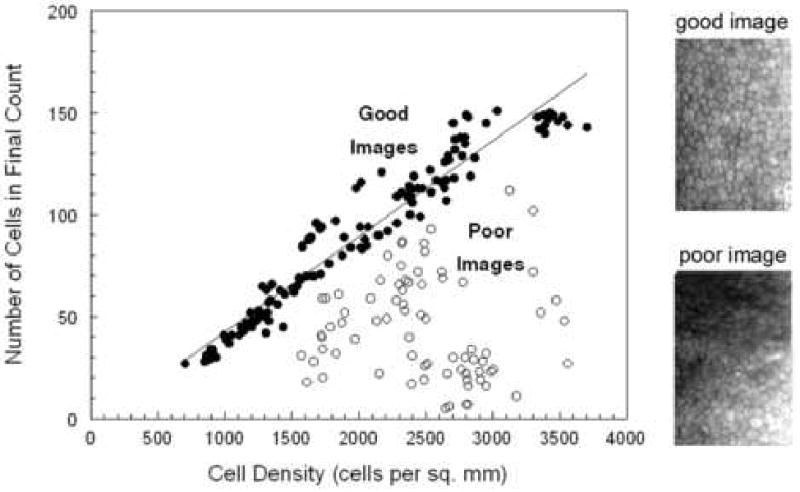
A reasonable guideline for documenting a patient's endothelial cell morphology is to require as quoted from Binder et al 22 ….”suggesting as many areas with as many cells as possible should be counted. Furthermore, there should be 3 counts per patient from central and paracentral regions. “One may suggest that for a normal cell density subject 150 cells per cornea should be analyzed from 3 central locations and 3 paracentral locations. The number of cells available per image sample is depended upon the type of specular microscope, morphology analysis algorithms, and the endothelial cell density of the patient. As described previously, the contact (or wide-field) specular microscope can document 700 to 3000 cells per image. Only an exceptionally skilled technician can capture 3000 cells per image, but it is possible. The non-contact (small-field) specular microscope can capture 120 to 170 cells per image. The actual number of cells per image is dependent upon the endothelial cell density. Good quality endothelial specular micrographs were documented with a Konan ROBO SP8000 specular microscope from 123 patients in a clinical trial for Medennium, Inc., Irvine, CA. All the endothelial cells captured on the specular micrograph were analyzed with the Konan KSS300 software, Figure 14. As the cell density decreases the mean cell area increases and less cells are on the captured micrograph. From Figure 14, a cornea with a cell density of 2500 cells per mm2 had 118 cells in the field. Thus, 118 is the maximum number of cells that can be counted from one sample field. A cornea with a cell density of 1500 cell per mm2 had a maximum number of 66 cells. This limitation is affected if the image quality does not permit analysis of the entire sample surface area. The open circles in Figure 14 demonstrate the limitation of poor quality images. The endothelial image of a subject with Fuchs dystrophy must be considered a poor image because of the few cells entered into the analysis (Figure 15).
Figure 14.
Non-contact specular micrographs of patient eyes (n=197) with various endothelial cell image qualities. The linear regression line fit to the good quality images (n=122) is Y=0.468X-4.2. The two endothelial cell images demonstrate good and poor image quality.
Figure 15.
The endothelial cell image is from a Fucks dystrophy cornea. Even though the endothelial cell image is of excellent quality, cell density can only be determined from a few contiguous cells.
Endothelial Cell Clustering
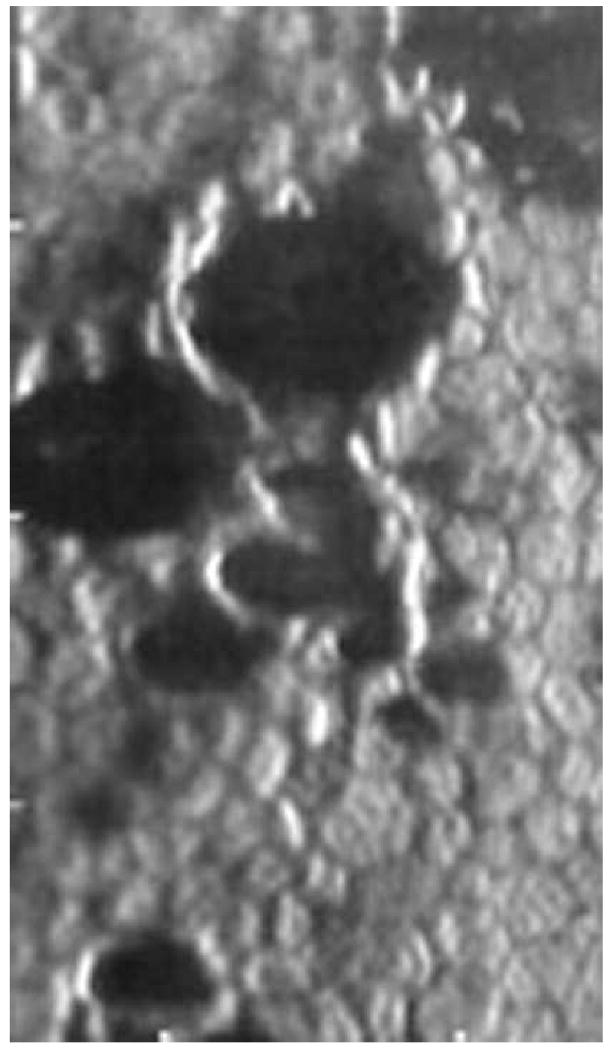
Hirst et al 52 published data indicating the effect of cell “clustering” (see discussion relative to Table 3). Large surface area cells can be grouped or clustered randomly on a background of smaller cells, Figure 16. The effect is that varying percentages of the cells within small-field specular micrographs can be a mixture of large and small cells resulting in dramatic changes in the cell density and coefficient of variation values from the same cornea. The effects of cell clustering can be shown in the following example. A cooperative patient was requested to focus on the central target of the Konan 8800 specular microscope while 10 images of the endothelium were recorded. Careful inspection of the images verified that a characteristic cluster of cells could be found on each of the 10-endothelial sample fields. The cell density was 2472 ± 26 cells/mm2. The same subject was requested to select 10 locations slightly off center within a 1mm diameter zone. The cell density was 2347 ± 71 cells / mm2. A t-test comparison of the two sets of data had a probability of p<0.0001. A statistical conclusion to be drawn is that the two data sets were taken from different subjects. The disparity can be explained by the presence of cell clustering captured in the second set of images.
Figure 16.
The specular micrographs illustrate corneal endothelial cell clustering.
Cell Density Analysis Reliability in Clinical Trial Data
The ideal specular microscopy investigation would be performed by a single technician at a single clinical site with a single specular microscope model. One technician should capture all the endothelial cell images. One technician should analyze all the specular micrographs, which would give uniformity in the subjective decision of identifying cells. This analysis for the estimated cell density can have a ±2% to ±5% variability. This is not the case with a multi-center clinical trial. Instrument model variability and or settings can vary between clinical sites. A busy clinic will use a technician who can only provide a small portion of their time and energy into fine-tuning their specular microscopy skills. There are often several technicians assigned to perform the specular microscopy. After the clinical trial sponsor selects the clinical site, orientates and provides training and or evaluation of the technician, there is a delay in initializing the data collection plus a prolonged patient entry into the study. All of these issues with a multi-center clinical trial compound the variability in the quality of specular micrographs collected. Multi-center clinical trials have an estimated cell density variability of ±10%. It should be emphasized that accurate baseline specular micrographs are very important because the change in subsequent cell morphometric analysis is based on the baseline specular micrographs.
Practice Standard Images
In order to practice and evaluate the skill of the technician performing the endothelial cell analysis a set a practice images can be imported into the Konan KSS-300 version 2.20 software (Konan Medical, Inc., Torrance, CA) or other acceptable endothelial cell morphology analysis software. The endothelial cell layer print or computer file should have a 100 μm calibration bar or tick marks imbedded on the image. The Konan KSS-300 will permit loading a jpeg image file and a bitmap image file. The imported image should be re-calibrated within the KSS300 software. The default Konan captured endothelial cell image calibration is 124 pixels per 100 μm. A scanner bed scaling factor should be selected so the final scanned image will have a re-entered calibration of approximately 124 pixels. This will retain uniformity of magnification between image sources. The entered calibration will be saved as part of the loaded image file. Future loaded images will automatically default to the manufactures setting unless the calibration sequence is activated.
A set of three practice images a technician can use to practice and evaluate there skill are shown in Figure 17. The images are a hexagon pattern and tracings of two patient endothelial cells. By changing the scanner bed scaling factor various cell densities can be imported.
Figure 17.
Practice images for the Konan KSS-300 software.
Guide for a Specular Microscope Reading Center Regarding Quality of Image verses Number of Cells Countable
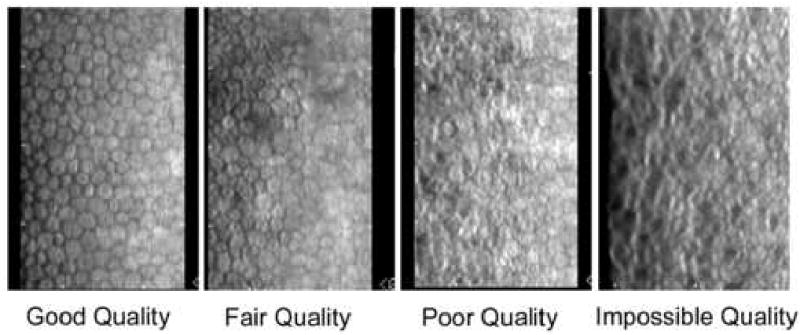
A Specular Microscopy Reading Center should classify the quality of the images by the percent area of contiguous countable cells relative to the maximum Konan field of cells (240 μm × 350 μm), Table 4, with example cell images in Figure 18. Such a classification will be important in the final assessment of the reliability of the mean endothelial density in a cohort of subjects.
Table 4. Endothelial Cell Image Quality verses Viewable Field of Contiguous Cells.
| Image Quality | Countable Konan Field (%) |
|---|---|
| Good | 100 to 75 |
| Fair | 74 to 50 |
| Poor | 49 to 25 |
| Impossible | 24 to 0 |
Figure 18.
A selection of endothelial micrograph illustrates different qualities of cell imaging; good, fair, poor, and impossible to analyze.
The number of cells visible and countable in a photographic field is indirectly related to the cell density. In a theoretical example with a maximum Konan field of cells at 240 μm × 350 μm and a cell density of 2400 cells per mm2 there will be a maximum of 202 cells per field. The post-algorithm analysis will have a maximum cell count of approximately 140. Using the above classification scale, the maximum number of cells counted for two cell densities is listed in Table 5 and 6.
Table 5. Endothelial Cell Image Quality verses Cell Counted for a 2400 cells per mm2.
| Image Quality | Cells Counted |
|---|---|
| Good | 140 to 105 |
| Fair | 100 to 70 |
| Poor | 65 to 35 |
| Impossible | 30 to 0 |
Table 6.
Endothelial Cell Image Quality verses Cell Counted for a 1700 cells per mm2
| Image Quality | Cells Counted |
|---|---|
| Good | 95 to 71 |
| Fair | 70 to 48 |
| Poor | 47 to 24 |
| Impossible | 23 to 0 |
Guidelines for Specular Microscopy in FDA Clinical Trials
Coordinating a multi-clinical site to perform specular microscopy with a large patient base is many times more difficult than an in-house study. To minimize the variables the study director should attempt to have all the clinical sites using the same specular microscope, and provide training to the technician as to how to take a good specular micrograph and identify a good quality image (Table 4). The suggestion is to use a small field, non-contact specular microscope model with automatic focusing and digital image capture. As discussed previously, a large-field sample of endothelial cells is best but the trade off of patient comfort with a non-ocular contact is warranted. One technician should be assigned to the task per clinical site. The clinical trial sponsor should review the technical skill with the clinical site technician. It is very important to provide to the clinical site technicians a set of endothelial cell image examples representing the acceptable quality of the images for the clinical trial data (Figure 18). The Sponsor should re-evaluate the skill of specular image photography periodically during the study. If there is a change in technical personnel at the clinical site then the sponsor should reassess the assigned technician's skill. The images can be forwarded to the endothelial cell morphology reading center on computer disks or via e-mail. Analysis of the endothelial cell morphology relies on a subjective decision to identify cell boundaries. One technician should be used at the reading center to analyze cells thus providing a greater level of uniformity in the analysis than having the technicians at the clinical site determining the endothelial cell density. Calibration targets can be obtained from the manufacturer of the specular microscope to confirm the image magnification. Calibrating each specular microscope in a multi-center clinical trial can be a daunting task. The subjects in the clinical trial will have unique baseline values and the object of the analysis is to determine the change in cell density during the study. Precise calibration of the individual specular microscope is not as important as a constant calibration throughout the study. Endothelial cell images captured with the Konan specular microscope at a resolution of 640 × 480 pixels can be imported into the Konan KSS-300 morphology analysis software with the instrument's default calibration. All other endothelial cell images imported into the morphology analysis software must have a calibrated distance embedded on the image. For example, the Konan Robo specular images have a 100 μm tick marks, whereas the Topcon SP200P does not include a calibration marker but can superimpose an analysis box of known dimensions. Most multi-center clinical trials will have multiple specular microscope models. It is critical for the reading center to establish standard operating procedures for each clinical site depending on the specular microscope in their clinic. The reading center should analyze as many cells as the image field provides, and transfer the analysis data to a Microsoft Excel spreadsheet for statistical analysis by a third party. The data should include image quality, cell density, cell area, cell area standard deviation, polymegethism, pleomorphism, and number of cell analyzed.
Acknowledgments
Supported in Part by National Institute Grants R01-EY00933 and P30-EY06360, and an unrestricted grant from Research to Prevent Blindness
Appendix 1
| Contact Specular Microscope | |
| 1. Keeler Instruments, Inc., Broomall, PA | model SP-580 |
| 2. HAI Labs, Lexington, MA | model CL-1000xyz |
| 3. TOMY Corp., Phoenix, AZ | model EM-1000 |
| Non-contact Specular Microscopes | |
| 1. Bio Optics, Inc., Portland, OR | LMS-12000 |
| 2. Topcon Medical Systems, Inc., Paramus, NJ | SP-series |
| 3. Konan Medical USA, Torrance, CA | ROBO SP-series |
References
- 1.Maurice DM. Cellular membrane activity in the corneal endothelium of the intact eye. Experientia. 1968;24:1094–5. doi: 10.1007/BF02147776. [DOI] [PubMed] [Google Scholar]
- 2.Laing RA, Sandstrom MM, Leibowitz HM. In vivo photomicrography of the corneal endothelium. Archives of Ophthalmology. 1975;93:143–5. doi: 10.1001/archopht.1975.01010020149013. [DOI] [PubMed] [Google Scholar]
- 3.Laing RA, Sandstrom MM, Leibowitz HM. Clinical specular microscopy. I. Optical principles. Archives of Ophthalmology. 1979;97:1714–9. doi: 10.1001/archopht.1979.01020020282021. [DOI] [PubMed] [Google Scholar]
- 4.Volt A. I do not know. Graefes Archives Kin Ophthalmology. 1920;101:123. [Google Scholar]
- 5.Tanimura K. A Quantitative Analysis of Corneal Endothelial Cells. Japanese Journal of Ophthalmology. 1981;32:1835–9. [Google Scholar]
- 6.MacRae SM, Matsuta M, Shellans S, Rich LF. The effects of hard and soft contact lenses on the corneal endothelium. Am J Ophthalmol. 1986;102:50–7. doi: 10.1016/0002-9394(86)90209-6. [DOI] [PubMed] [Google Scholar]
- 7.Hirst LW, Auer C, Dohn J, Tseng CG, Khodadoust AA. Specular Microscopy of Hard Contact Lens Wearers. Ophthalmology. 1984;91:1147–53. doi: 10.1016/s0161-6420(84)34167-7. [DOI] [PubMed] [Google Scholar]
- 8.Herrmann R, Ohrloff C, Schalnus R. Fluorophotometry--a sensitive technic for the quantitative measurement of corneal endothelial function. Fortschritte der Ophthalmologie. 1985;82:584–6. [PubMed] [Google Scholar]
- 9.Schoessler JP. Contact lens wear and the corneal endothelium. J Am Optometric Assoc. 1987;58:804–10. [PubMed] [Google Scholar]
- 10.Bergmanson JPG. Histopathological Analysis of Corneal Endothelial Polymegethism. Cornea. 1992;11:133–42. doi: 10.1097/00003226-199203000-00007. [DOI] [PubMed] [Google Scholar]
- 11.Makitie J, Koskenvuo M, Vannas A, et al. Corneal endothelium after photocoagulation in diabetic patients. Acta Ophthalmologica. 1985;63:355–60. doi: 10.1111/j.1755-3768.1985.tb06820.x. [DOI] [PubMed] [Google Scholar]
- 12.Schultz RO, Matsuda M, Yee RW, et al. Corneal endothelial changes in type I and type II diabetes mellitus. American Journal of Ophthalmology. 1984;98:401–10. doi: 10.1016/0002-9394(84)90120-x. [DOI] [PubMed] [Google Scholar]
- 13.Ringvold A, Davanger M, Olsen EG. Organization of the Corneal Endothelium. Acta Ophthalmologica. 1984;62:911–8. doi: 10.1111/j.1755-3768.1984.tb08442.x. [DOI] [PubMed] [Google Scholar]
- 14.Maurice DM. The Cornea and Sclera. 3rd. 1b. New York: Academic Press; 1969. pp. 1–158. [Google Scholar]
- 15.McCarey BE. Noncontact specular microscopy: a macrophotography technique and some endothelial cell findings. Ophthalmology. 1979;86:1848–60. doi: 10.1016/s0161-6420(79)35337-4. [DOI] [PubMed] [Google Scholar]
- 16.Hoffer KJ. Corneal decomposition after corneal endothelium cell count. American Journal of Ophthalmology. 1979;87:252–3. doi: 10.1016/0002-9394(79)90156-9. [DOI] [PubMed] [Google Scholar]
- 17.Yee RW, Matsuda M, Schultz RO, Edelhauser HF. Changes in the normal corneal endothelial cellular pattern as a function of age. Current Eye Research. 1985;4:671–8. doi: 10.3109/02713688509017661. [DOI] [PubMed] [Google Scholar]
- 18.Matsuda M, Yee RW, Edelhauser HF. Comparison of the corneal endothelium in an American and a Japanese population. Archives of Ophthalmology. 1985;103:68–70. doi: 10.1001/archopht.1985.01050010072023. [DOI] [PubMed] [Google Scholar]
- 19.McCarey BE, al Reaves T. Noninvasive measurement of corneal epithelial permeability. Current Eye Research. 1995;14:505–10. doi: 10.3109/02713689509003762. [DOI] [PubMed] [Google Scholar]
- 20.Yee R, Matsuda M, Schultz RO, Edelhauser HF. Changes in the Normal Corneal Endothelial Cellular pattern as a Funtion of Age. Current Eye Research. 1985;4:671–8. doi: 10.3109/02713688509017661. [DOI] [PubMed] [Google Scholar]
- 21.Laing RA, Sanstrom MM, Berrospi AR, Leibowitz HM. Changes in the corneal endothelium as a function of age. Experimental Eye Research. 1976;22:587–94. doi: 10.1016/0014-4835(76)90003-8. [DOI] [PubMed] [Google Scholar]
- 22.Binder PS, Akers P, Zavala EY. Endothelial cell density determined by specular microscopy and scanning electron microscopy. Ophthalmology. 1979;86:1831–47. doi: 10.1016/s0161-6420(79)35343-x. [DOI] [PubMed] [Google Scholar]
- 23.Cheng H, Jacobs PM, McPherson K, Noble MJ. Precision of Cell Density Estimates and Endothelial Cell Loss with Age. Archives of Ophthalmology. 1985;103:1478–81. doi: 10.1001/archopht.1985.01050100054017. [DOI] [PubMed] [Google Scholar]
- 24.Abib FC, Barreto J. Behavior of corneal endothelial density over a lifetime. J Cataract Refract Surg. 2001;27:1574–8. doi: 10.1016/s0886-3350(01)00925-7. [DOI] [PubMed] [Google Scholar]
- 25.Amrmitage WJ, Dick AD, Bourne WM. Predicting endothelial cell loss and long-term corneal graph survival. Invest Ophthalmol Vis Sci. 2003;44:3326–31. doi: 10.1167/iovs.02-1255. [DOI] [PubMed] [Google Scholar]
- 26.Moller-Pedersen T. A comparative study of human corneal keratocytes and endothelial cell density duriing aging. Cornea. 1997;16:333–8. [PubMed] [Google Scholar]
- 27.Bourne WM, Nelson LR, Hodge DO. Central corneal endothelial cell changes over a ten-year period. Investigative Ophthalmology & Visual Science. 1997;38:779–82. [PubMed] [Google Scholar]
- 28.Amann J, Holley GP, Lee SB, Edelhauser HF. Increased Endothelial Cell Density in the Paracentral and Peripheral Regions of the Human Cornea. Am J Ophthalmology. 2003;135:584–90. doi: 10.1016/s0002-9394(02)02237-7. [DOI] [PubMed] [Google Scholar]
- 29.Edelhauser HF. The Balance between Corneal Transparency and Edema. Invest Ophthalmol Vis Sci. 2006;47:1755–67. doi: 10.1167/iovs.05-1139. [DOI] [PubMed] [Google Scholar]
- 30.Edelhauser HF. The resiliency of the corneal endothelium to refractive and intraocular surgery. Cornea. 2000;19:263–73. doi: 10.1097/00003226-200005000-00002. [DOI] [PubMed] [Google Scholar]
- 31.Azar RG, Holdbrook MJ, Lemp M, Edelhauser HF. Two Year Corneal Endothelial Cell Assessment Following INTACS Implantation. J Refractive Surgery. 2001;17:542–8. doi: 10.3928/1081-597X-20010901-07. [DOI] [PubMed] [Google Scholar]
- 32.Inaba M, Matsuda M, Shiozaki Y, Kosaki H. Regional Specular Microscopy of Endothelial Cell Loss after Intracapsular cataract Extraction: a prreliminary report. Acta Ophthalmologica. 1985;63:232–5. doi: 10.1111/j.1755-3768.1985.tb01539.x. [DOI] [PubMed] [Google Scholar]
- 33.Schultz RO, Glasser DB, Matsuda M, Yee RW, Edelhauser HF. Response of the corneal endothelium to cataract surgery. Archives of Ophthalmology. 1986;104:1164–9. doi: 10.1001/archopht.1986.01050200070053. [DOI] [PubMed] [Google Scholar]
- 34.Hoffer KJ. Vertical endothelial cell disparity. American Journal of Ophthalmology. 1979;87:344–9. doi: 10.1016/0002-9394(79)90075-8. [DOI] [PubMed] [Google Scholar]
- 35.Bourne WM, Nelson LR, Hodge DO. Contined Endothelial Cell Loss Ten Years after Implantation. Ophthalmology. 1994;101:1014–23. doi: 10.1016/s0161-6420(94)31224-3. [DOI] [PubMed] [Google Scholar]
- 36.Schoessler JP. Contact lens wear and the corneal endothelium. J Am Optom Assoc. 1987;58:804–10. [PubMed] [Google Scholar]
- 37.MacRae SM, Matsuda M, Shellans S. Corneal endothelial changes associated with contact lens wear. CLAO Journal. 1989;15:82–7. [PubMed] [Google Scholar]
- 38.McLaughlin R, S J. Corneal endothelial response to refitting polymethyl methacrylate wearers with rigid gas-permeable lenses. Optometry & Vision Science. 1990;67:346–51. doi: 10.1097/00006324-199005000-00008. [DOI] [PubMed] [Google Scholar]
- 39.MacRae SM, Matsuda M, Shelans S, Rich LF. The effects of hard contact lenses on the corneal endothelium. Am J Ophthalmology. 1986;102:50–7. doi: 10.1016/0002-9394(86)90209-6. [DOI] [PubMed] [Google Scholar]
- 40.MacRae SM, Matsuda M, Yee RW. The effects of Long Term Hard Contact Lens Wear on the Corneal Endothelium. CLAO Journal. 1985;11:322. [PubMed] [Google Scholar]
- 41.Schoessler JP, Woloschak MJ. Corneal endothelium in veteran PMMA contact lens wearers. International Ophthalmology Clinics. 1981;8:19–25. [Google Scholar]
- 42.Stocker EG, Schoessler JP. Corneal endothelium polymegethism induced by PMMA contact lens wear. Investigative Ophthalmology & Visual Science. 1985;26:857–63. [PubMed] [Google Scholar]
- 43.Matsuda M, Inaba M, Suda T, MacRae SM. Corneal endothelial changes associated with aphakic extended contact lens wear. Archives of Ophthalmology. 1988;106:70–2. doi: 10.1001/archopht.1988.01060130076032. [DOI] [PubMed] [Google Scholar]
- 44.Group CDS. An Evaluation of Image Quality and Accuracy of Eye Bank Measurement of Donor Cornea Endothelial Cell Density in the Specular Microscopy Ancillary Study. Ophthalmology. 2005;112:431–40. doi: 10.1016/j.ophtha.2004.10.045. [DOI] [PubMed] [Google Scholar]
- 45.Benetz BA, Gal RL, Rubin LG, Ruedy KJ, Rice C, Beck RW, Kalajian AD, Lass JH. Specular Microscopy Ancillary Study Methods for Donor Endothelial Cell Density Determination of Cornea Donor Study Images. Current Eye Research. 2006;31:319–27. doi: 10.1080/02713680500536738. [DOI] [PMC free article] [PubMed] [Google Scholar]
- 46.Karata T. Establishing a Standard Method of Studing the Corneal Endothelium Using A Digitizer. Folia Ophthalmol Jap. 1981;32:2241–7. [Google Scholar]
- 47.Bursell SE, Hultgren BH, Laing RA. Evaluation of the corneal endothelial mosaic using an analysis of nearest neighbor distances. Experimental Eye Research. 1981;32:31–8. doi: 10.1016/s0014-4835(81)80036-x. [DOI] [PubMed] [Google Scholar]
- 48.Ohno K, Nelson LR, McLaren JW, Hodge DO, Bourne WM. Comparison of Recording Systems and Analysis Methods in Specular Microscopy. Cornea. 1999;18:416–23. doi: 10.1097/00003226-199907000-00005. [DOI] [PubMed] [Google Scholar]
- 49.Benetz BAM, Diaconu E, Bowlin SJ, Oak SS, Laing RA, Lass JH. Comparison of Corneal Endothelial Image Analysis by Konan SP8000 Noncontact and Bio-Optics Bambi Systems. Cornea. 1999;18:67–72. [PubMed] [Google Scholar]
- 50.Doughty MJ, Muller A, Zaman ML. Assessment of the reliability of human corneal endothelial cell-density estimates using a noncontact specular microscope. Cornea. 2000;19:148–58. doi: 10.1097/00003226-200003000-00006. [DOI] [PubMed] [Google Scholar]
- 51.Hirst LW, Auer C, Abbey H, Cohn J, Kues H. Quantitative analysis of wide-field endothelial specular photomicrographs. American Journal of Ophthalmology. 1984;97:488–95. doi: 10.1016/s0002-9394(14)76133-1. [DOI] [PubMed] [Google Scholar]
- 52.Hirst LW, Yamauchi K, Enger C, Vogelpohl W, Whittington V. Quantitative analysis of wide-field specular microscopy. Investigative Ophthalmology & Visual Science. 1989;30:1972–9. [PubMed] [Google Scholar]
- 53.Jones SS, Azar RG, Cristol SM, Geroski DH, Warring GO, III, Stulting RD, Thompson KP, Edelhauser HF. Effects of Laser In Situ Keratomileusis (LASIK) on the Corneal Endothelium. Am J Ophthalmology. 1998;125:465–71. doi: 10.1016/s0002-9394(99)80186-x. [DOI] [PubMed] [Google Scholar]
- 54.Berliner ML. Biomicroscopy of the Eye; slit lamp microscopy of the living eye. I. New York: Paul B. HoeberInc.; 1943. p. 310. [Google Scholar]


