

Abstract
The crystal structure of the enzyme phosphoglucomutase from Salmonella typhimurium (StPGM) is reported at 1.7 Å resolution. This is the first high-resolution structural characterization of a bacterial protein from this large enzyme family, which has a central role in metabolism and is also important to bacterial virulence and infectivity. A comparison of the active site of StPGM with that of other phosphoglucomutases reveals conserved residues that are likely involved in catalysis and ligand binding for the entire enzyme family. An alternate crystal form of StPGM and normal mode analysis give insights into conformational changes of the C-terminal domain that occur upon ligand binding. A novel observation from the StPGM structure is an apparent dimer in the asymmetric unit of the crystal, mediated largely through contacts in an N-terminal helix. Analytical ultracentrifugation and small-angle X-ray scattering confirm that StPGM forms a dimer in solution. Multiple sequence alignments and phylogenetic studies show that a distinct subset of bacterial PGMs share the signature dimerization helix, while other bacterial and eukaryotic PGMs are likely monomers. These structural, biochemical, and bioinformatic studies of StPGM provide insights into the large α-d-phosphohexomutase enzyme superfamily to which it belongs, and are also relevant to the design of inhibitors specific to the bacterial PGMs.
Keywords: phosphohexomutase, X-ray crystallography, dimerization helix, normal mode analysis, C-H…π interaction, small-angle X-ray scattering, Salmonella typhimurium
INTRODUCTION
Phosphoglucomutase (E.C. 5.4.2.2) is a widely distributed and evolutionarily conserved enzyme, found in organisms ranging from E. coli to humans. It catalyzes the interconversion of glucose 1-phosphate (G1P) and glucose 6-phosphate (G6P), making it the key enzyme linking the glycolysis and gluconeogenesis pathways. When acting in the synthesis of G1P, the resulting product is changed into UDP-glucose, an important precursor for many biosynthetic pathways. In bacteria, phosphoglucomutase (PGM) is known to play roles in biosynthesis of multiple exoproducts, including lipopolysaccharide1,2 and lipotechoic acid.3,4 A number of studies using bacterial strains with deletions of PGM have shown that this enzyme affects microbial fitness, cell wall properties, and antibiotic resistance of various human pathogens, including Staphylococcus aureus, Salmonella typhimurium, and Yersinia pestis.1,5-7 For at least two pathogens, Brucella abortus and Streptococcus iniae, pgm- strains are of interest as live vaccine candidates due to diminished virulence.8,9
As a member of the large α-d-phosphohexomutase enzyme superfamily, PGM is known to catalyze the reversible formation of 1- and 6-phosphosugars via a bisphosphorylated intermediate.10 Detailed kinetic studies of a eukaryotic PGM from Oryctolagus cuniculas (rabbit) were carried out over many years by William Ray et al. (see Refs. 11-13 and references therein). These studies showed that catalysis proceeds through consecutive phosphoryl transfers, first from a phosphoserine residue of the protein to the substrate, and next from the intermediate back to the protein (see Fig. 1). The reaction is highly reversible, and a single Mg2+ ion is required for catalytic activity. At least in the case of rabbit PGM, which is best characterized kinetically, the enzyme shows a 6000-fold preference for glucose-based phosphosugars relative to their mannose counterparts.14 This defines the PGM subgroup of the enzyme superfamily, other members of which have varying sugar specificity.10
Figure 1.
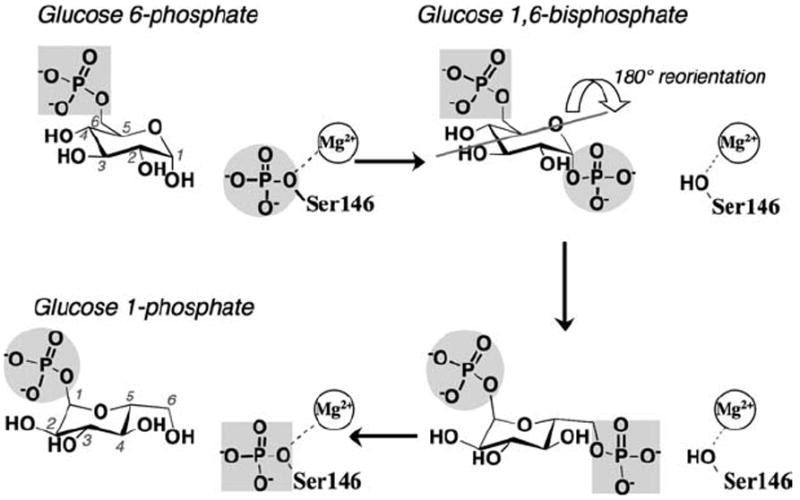
A schematic of the catalytic reaction of StPGM, showing the conversion of G6P to G1P. The bisphosphorylated intermediate undergoes a 180° reorientation in between the two phosphoryl transfer steps of the reaction (gray line indicates axis of rotation). The reaction is highly reversible, thus both G1P and G6P can be considered either as substrates or products.
The crystal structures of several PGM enzymes have been previously determined. Several crystal forms of rabbit PGM have been deposited in the Protein Data Bank (PDB) (1JDY, 1VKL, 1C4G, 1C47, 1LXT, 3PMG), with the best diffracting data set (3PMG) at a nominal resolution of 2.4 Å.15-17 Two structures of a related eukaryotic protein from Paramecium tetraurelius known as parafusin (1KFI, 1KFQ) were also determined to 2.4 Å.18 The coordinates for two bacterial PGMs from S. typhimurium (2FUV) and Thermus thermophilus (2Z0F) at resolutions of 2.0 and 2.5 Å have been deposited in the PDB, but never described in a publication. Several other PGM proteins have been biochemically characterized to various extents, including enzymes from Acetobacter xylinum,19-21 Clostridium thermocellum,22 Aedes aegypti,23 yeast,24 wheat,25 and maize.26 Overall, however, detailed structure-function studies of PGM enzymes are limited, especially for the bacterial proteins.
We present here the 1.7 Å crystal structure of S. typhimurium PGM (StPGM). This is the first report of structural and biochemical characterization of a bacterial PGM, and the highest resolution crystal structure of any PGM enzyme. Our studies of StPGM are discussed in the context of the large α-d-phosphohexomutase superfamily, providing new insights into key active site residues, conformational change, and the oligomeric state of these enzymes.
MATERIALS AND METHODS
Protein expression and purification
The expression vector for PGM from Salmonella enterica serovar Typhimurium, strain LT2 was obtained from the Structural genomics Lab, Midwest Center for Structural Genomics.27 In this construct, the PGM gene is cloned into pMCSG7 TEV/LIC vector and expresses a protein with molecular weight of 60.827 kD, including an N-terminal histidine tag with sequence of MHHH HHHSSGVDLGTENLYFQSNA. This construct was used to transform E. coli BL21(DE3)cells, which were grown on LB/ampicillin plates overnight at 37°C. A single colony was added to one liter of LB supplemented with ampicillin (final concentration 100 μg/mL) at 37°C, and the culture grown to an optical density of 0.6–0.8 at 600 nm. Protein expression was induced by adding IPTG to a final concentration of 0.4 mM. Cells were grown overnight at 19°C, harvested by centrifugation, and the cell pellet stored at −80°C until further use.
For purification, cells were resuspended in 20 mM sodium phosphate buffer, pH 7.4, 0.5M NaCl, and 14.3 mM β-mercaptoethanol (Buffer A) plus 0.5 mM each of PMSF and TLCK and 2 mM each of CaCl2 and MgCl2, and lysed with a French press. Insoluble debris was removed by centrifugation and the protein was purified using His-Select Ni-Affinity gel (Sigma) by loading the sample in Buffer A and eluting with Buffer A plus 25 mM imidazole. The purified protein was dialyzed sequentially against: (1) 50 mM MOPS, pH 7.4; (2) 50 mM MOPS, pH 7.4 with 1 mM EDTA (to chelate metal ions); and (3) 50 mM MOPS, pH 7.3, 1 mM MgCl2 and 1 mM DTT. The protein was concentrated to ~20 mg/mL, flash-frozen in liquid nitrogen, and stored at −80°C. Protein concentration was determined using Bio-Rad Protein Assay reagent (Bio-Rad). Prior to crystallization, the protein was thawed, 0.22 μm filtered, and concentrated or diluted as desired. To encourage phosphorylation of the active site serine, 1 mM glucose-1,6-bisphosphate was routinely added to the protein prior to setting up crystal trays.
Crystallization
Initial crystallization screens were set up with Crystal Screen kits 1 and 2 (Hampton Research) and Wizard screen kits 1 and 2 (Emerald BioSystems Inc.) at a protein concentration of 22 mg/mL using the hanging drop vapor diffusion method. Drops contained 2 μL protein solution and 2 μL crystallization buffer, and were sealed over a 1 mL reservoir. The conditions described in the PDB entry of 2FUV were also used (0.1M Bis-Tris, pH 6.5, 0.2M MgCl2, and 25% PEG 3350) at protein concentrations of 10, 15, 20, 27, and 35 mg/mL. The protein crystallized successfully at 277 K and 27 mg/mL protein from the buffer conditions described for 2FUV. Crystals grew from heavy precipitate; de novo growth time was ~3 weeks. No new crystal forms were observed from other conditions in the crystallization screens. To increase crystal size, macroseeding techniques were routinely used: medium-sized de novo crystals were transferred into a fresh crystallization drops. For seeding, both the PEG 3350 and protein concentrations in the drop were decreased to 15% (w/v) and 22 mg/mL, respectively. MgCl2 concentration was varied between 0.1M and 0.3M. Crystals obtained by seeding grew to larger size within 2 to 3 weeks.
Both soaking and cocrystallization were used in attempts to obtain enzyme–ligand complexes. For soaking experiments, crystals were typically first transferred to a small drop containing the reservoir solution, and the MgCl2 concentration was slowly decreased from 200 to 25 mM. (The ionic strength of the solution was reduced to prevent possible interference with ligand binding). The PEG 3350 concentration was then slowly increased from 15 to 35% to serve as a cryoprotectant. Immediately prior to diffraction screening, the crystals were dipped in a solution containing 0.1M Bis-Tris, pH 6.5, 25 mM MgCl2, 40% PEG3350, and 10–100 mM ligand (G1P, G6P, the substrate analog xylose 1-phosphate, or glucose 1,6-bisphosphate). Although soaking produced no obvious morphological change in the crystals, data collection revealed that some soaked crystals adopted an alternative space group (see following section). For cocrystallization experiments, a concentrated solution of ligand was added directly to the crystallization drops as follows: drop composition was 2 μL protein (25 mg/mL stock) + 2 μL reservoir solution +1 μL ligand (10–100 mM of G1P, G6P, xylose 1-phosphate, or glucose 1,6-bisphosphate) and 1 μL n-octyl-β-d glucopyranoside (0.5% stock). The detergent n-octyl-β-d-glucopyranoside was included because it was found to improve crystal morphology and diffraction. (Crystals of StPGM often grew quite large but typically exhibited a layered appearance and high mosaicity or multiple lattices). Crystallization buffer was similar to that described earlier, with the best crystals growing from 0.1M Bis-Tris, pH 6.5, 0.3 M MgCl2 and 20% PEG 3350. For cryoprotection of these crystals, a modified protocol was used where crystals were transferred to a solution containing all components in the original drop plus increasing amounts of PEG 200, to a final concentration of 20%. All crystals were mounted in nylon loops, flash-frozen in liquid nitrogen and stored until needed for data collection.
Data collection and processing
Data sets for StPGM were collected on crystals in space groups P212121 (form A) and P21 (form B). Form A crystals have unit cell parameters essentially identical to those associated with the 2FUV structure, whereas form B occurred only rarely in crystals that had been soaked with ligand. The two crystal forms were identical in appearance and could only be distinguished by collecting diffraction data and determining space group parameters. The crystal lattices are related, with packing of molecules in the ac plane of form A very similar to that in the bc plane of form B. Optimization of crystallization conditions and inclusion of n-octyl-β-d glucopyranoside eventually produced large, well-ordered crystals of form A. The best high-resolution data set (1.7 Å resolution) for this crystal form was collected from a single crystal on beamline 4.2.2 at the Advanced Light Source of Berkeley National Laboratory using a NOIR-1 CCD detector. Although this particular crystal had been grown in the presence of G1P, no evidence of ligand was found in difference Fourier maps or after refinement (see below). Dozens of crystals were screened to find a well-diffracting crystal of form B, the occurrence of which we hoped was associated with ligand binding. The best data set on this crystal form (1.95 Å resolution) was collected at the Advanced Photon Source on beamline NE-CAT 24-ID-C from a crystal that had been soaked with G1P. Diffraction data were processed using Denzo28 or d*TREK29 and are summarized in Table I.
Table I.
Data Collection and Refinement Statistics
| Form A (open) | Form B (half closed) | |
|---|---|---|
| Space group | P212121 | P21 |
| Wavelength (Å) | 1.00 | 0.979 |
| Cell volume | 1,092,799.6 | 551,923.3 |
| % solvent | 46.96 | 47.49 |
| No. chains per asu | 2 | 2 |
| Cell constants | a = 81.5, b = 105.8, c = 126.8 | a = 58.2, b = 85.2, c = 111.6 β= 94.46 |
| Resolution (Å) | 42.27–1.70 (1.76–1.70) | 50.00–2.35 (2.43–2.35) |
| Rmerge (%) | 5.6 (48.7) | 7.2 (49.0) |
| I/σ(I) | 10.8 (2.3) | 12.3 (2.8) |
| Completeness (%) | 99.9 (99.3) | 99.0 (98.5) |
| Multiplicity | 4.7 (3.7) | 3.6 (3.6) |
| No. observed reflections | 567,778 | 280,543 |
| No. unique reflections | 120,749 | 78,342 |
| Mosaicity (°) | 0.6 | 1.5 |
| Rwork/Rfree | 0.18/0.22 (0.32/0.37) | 0.17/0.20 (0.21/0.23) |
| No. protein residues (chain A/B) | 544/543 | 545/545 |
| No. protein atoms | 8046 | 8111 |
| No. water molecules | 1020 | 668 |
| Ramachandran statistics | ||
| Most favored (%) | 97.6 | 97.3 |
| Additionally allowed (%) | 2.4 | 2.7 |
| Average B-factor (Å2) | ||
| Wilson | 28.8 | 26.3 |
| Protein | 26.8 | 31.3 |
| Water | 38.4 | 40.2 |
| Ligands | ||
| Mg2+ | 19.9 | 25.8 |
| Phosphate | — | 108.0 |
| Bis-Tris | 30.9 | — |
Numbers in the parenthesis refer to the statistics for the outer resolution shell. No sigma cutoff was applied to the reflection data.
Structure solution and refinement
For crystal form B, the structure was solved by molecular replacement using MOLREP30 using the 2FUV structure as a search model. For refinement of crystal form A, the starting model was PDB entry 2FUV without water molecules or ligands. Refinement was performed with REFMAC 5.0.31 The structures were refined to convergence through iterative cycles of refinement and manual rebuilding with Coot.32 Progress of the refinement was monitored by following Rfree; 5% of each data set was set aside for cross validation prior to refinement. Water molecules were placed automatically by COOT in peaks >3.0σ in Fo − Fc maps and within reasonable hydrogen bonding distance of oxygen or nitrogen atoms. The B-factor model used during refinement consisted of an isotropic B-factor for each non-hydrogen atom as well as several TLS groups per chain (four for crystal form A and two for crystal form B). Additional details of the refinement are on Table I.
Each PGM monomer contains one bound Mg2+ ion in its metal binding site. The refined structure of StPGM from the form A crystals is very similar to that of 2FUV, in both overall fold and active site architecture, with a Cα rmsd of 0.67 Å2 over 1090 residue pairs. In the form A structure, Cys285 in each monomer had significant electron density extending beyond the Sγ atom and these residues were modeled as mercapto-cysteine. A molecule of Bis-Tris bound to each monomer is also included in the final model. Neither the cysteine modification nor the Bis-Tris molecules are found in the 2FUV structure. No evidence of ligand could be found in electron density maps of the form A data set described here, or for many other data sets of this crystal form. For the form B data set, the electron density maps indicated a modest conformational change of the protein (see Results) and showed a positive difference peak near the expected phosphate-binding site. This peak could not be satisfactorily fit with water molecules, but did refine well when modeled as a phosphate ion, although the B-factors remained high (Table I) at full occupancy. Two phosphate ions are included in the final model of this structure, one bound in the active site of each monomer. Electron density for the remainder of the ligand (i.e., the sugar ring) was not apparent in the active site. Structural figures were prepared with PYMOL.33 Atomic coordinates and structure factor amplitudes have been deposited in the PDB with accession codes 3NA5 and 3OLP.
Dynamic light Scattering
Dynamic light scattering measurements were done at 25°C on a Protein Solutions DynaPro 99 instrument at a wavelength of 8363 Å. The protein sample (concentration 1 mg/mL) was 0.22 μm filtered prior to data collection. At least 20 measurements were taken on a sample at 5 s intervals. The standard deviation of the hydrodynamic radius measurements was less than 25%, indicating a monodisperse sample.
Analytical ultracentrifugation
Sedimentation equilibrium experiments were conducted in a Beckman Coulter Optima XL-I instrument, equipped with an An50Ti rotor, over a period of 53 h at 20°C. Prior to analysis, the protein samples were dialyzed extensively against the reference buffer—50 mM MOPS, pH 7.3, 1 mM MgCl2 and 0.1 mM of the reductant Tris(hydroxypropyl)phosphine (THP). The sedimentation was conducted on 120 μL samples in six-sector charcoal-Epon centerpieces, which permit simultaneous examination of three loading concentrations in a single cell. Initially, samples were sedimented at 6000, 9000, and 12,000 rpm. Subsequently, the experiment was repeated at rotor speeds of 14,000, 18,000, and 25,000 rpm. Loading concentrations were 5.2, 10.3, and 20.7 μM in the first experiment and 4.1, 8.3, and 16.5 μM in the second. Radial solute distributions, monitored at 280 nm, were collected at 1-h intervals, at each rotor speed, until successive data sets were indistinguishable. Typically, 10 absorbance readings were averaged at each radial position.
The radial absorbance profiles for each sample–solvent pair were compiled into a single composite dataset, which was then subjected to weighted nonlinear least-squares analysis in Origin version 7.5 (OriginLab). The fitting was performed with a Fortran-based program, written in-house, that used a Marquardt-Levenberg minimization algorithm. The data were fitted to a single-species model and to a model describing a reversible monomer–dimer equilibrium. In the latter, the total absorbance at each radial position was assumed to include contributions from the monomer (am) and dimer (ad) species, as well as a solvent-reference offset to account for optical mismatch between the sample and the solvent sectors (bl):
| (1) |
The monomer absorbance is given by:
| (2) |
where r is the radial position; am,o is the monomer absorbance at an arbitrary radial position, ro; M is the monomer molecular weight; ω is the angular velocity, equal to the rotor speed multiplied by 2π/60; ν̄ is the partial specific volume of the protein, assumed to be 0.73 cm3/g; ρ is the solvent density; R is the gas constant in cgs units; and T is the absolute temperature. The dimer contribution is given by:
| (3) |
where Ka is the association constant for the dimerization reaction, in reciprocal absorbance units. In this model, M and ν̄ are fixed global parameters; ω, ρ, ro, am,o, and bl were local parameters, distinct for each sample–solvent absorbance profile. ω, ρ, and ro were fixed; am,o and bl were varied to achieve the optimal fit. To model the data with the assumption of an ideal single species, Ka was fixed at 10−20 M−1, and M was allowed to float.
The measured association constants (KaA) were converted to reciprocal molar units (KaM) using the relationship:
| (4) |
where 1.2 is the path length of the charcoal-Epon centerpiece and ε is the relevant molar extinction coefficient.
Small-Angle X-ray Scattering
Small-angle X-ray scattering (SAXS) experiments were performed at beamline 12.3.1 of the Advanced Light Source. Prior to analysis, samples of StPGM (16 mg/mL) were dialyzed against 50 mM MOPS, 1 mM MgCl2, and 1 mM THP, pH 7.3. Scattering intensities (I) were measured at four different protein concentrations, as a function of the scattering vector q = (4π sin θ)/λ, where 2θ is the scattering angle and λ is the wavelength of the incident beam. Exposure times of 0.5, 1.0, and 5.0 s were used. The scattering curves collected from the protein sample were corrected for background scattering using intensity data collected from the dialysis buffer. The radius of gyration (Rg) was estimated by Guinier analysis using the program PRIMUS.34 The composite scattering curve used for shape reconstructions was generated with PRIMUS by scaling and merging the background-corrected high q region (0.057 < q < 0.32 Å−1) data from the highest concentration sample (0.5 s exposure) with the low q region (0.012 < q < 0.095 Å −1) data from the lowest concentration sample (0.5 s exposure). Scattering curves were subjected to indirect Fourier transform using the GNOM program35 to yield the pair distribution function [P(r)], from which Rg and the maximum particle dimension (Dmax) were estimated. Shape reconstructions were performed using GASBOR36 with a Dmax value of 106 Å. Ten independent structure calculations were performed, and the models were averaged and filtered using DAMAVER.37 Theoretical scattering curves were calculated from atomic coordinates using CRYSOL. 38 MOLEMAN39 was used to calculate Rg from atomic coordinates.
Kinetic characterization
Enzyme activity was quantitated by measuring the production of G6P, using a coupled enzymatic assay with glucose 6-phosphate dehydrogenase as described previously. 40 Reactions were conducted at 25°C with 5 μg/mL of enzyme in 50 mM MOPS (pH 7.4) with 1 mM DTT, 1.5 mM MgSO4, 1 μM glucose 1,6-bisphosphate, and 0.9 mM NAD+. The substrate (G1P) concentration was varied from 10 to 250 μM. The reaction was monitored by measuring the rate of production of NADH, based on its absorbance at 340 nm. Data were fitted to the Michaelis-Menten equation to determine the reaction rate (kcat, s−1) and the Michaelis-Menten constant (Km, μM).
Multiple sequence alignments and phylogenetic analysis
Sequences for PGM enzymes used in alignments and phylogenetic studies were obtained from the Protein Information Resource or PIR (http://pir.georgetown.edu/)41 and compiled from families PIRSF006792 (420 sequences) and PIRSF001493 (418 sequences). (The PIRSF006792 family currently has uncurated status in the PIR and its annotation is somewhat confusing, but we include it in this analysis since it contains a number of known PGM sequences). Sequences that were not ~550 residues in length (i.e., fragments) were removed from the compilation. Sequences with >97% identity to others were removed automatically in Jalview and multiple related homologs from the genera Synechoccus and Prochlorus were removed manually. The resulting compilation contained 416 sequences. Multiple sequence alignments were performed with MUSCLE,42 and displayed with Jalview.43 A phylogenetic tree was created in Jalview where average distances were computed using percent identity.
Normal mode analysis
The low-frequency normal modes of StPGM were computed using the Elastic Network Model (elNémo) server: http://igs-server.cnrs-mrs.fr/elnemo/.44 Chain A of StPGM (3NA5) was used for the calculation; chain A of 1KFI (parafusin) was used as a reference for the closed PGM conformation. The five lowest frequency normal modes (7 to 11) were examined at varying amplitude ranges; output from elNémo and visual inspection in COOT32 were used to assess the relevance of the different normal modes. Coordinate sets resulting from a combination of normal modes 7 and 10 for StPGM were produced by elNémo.
RESULTS AND DISCUSSION
Tertiary structure
The structure of StPGM was originally solved by Joachimiak and coworkers via SAD phasing and deposited in the PDB in 2006 (PDB id 2FUV), but never described in a publication. To further pursue our studies of enzyme specificity in the α-d-phosphohexomutase superfamily, we requested the expression plasmid used for 2FUV, which was kindly provided by the Joachimiak laboratory. The StPGM protein was purified and crystallized in our laboratory under similar conditions and in the same space group (P212121, form A) as the 2FUV structure, although optimization of crystallization conditions allowed us to collect a 1.7 Å data set (Table I). (The previously deposited 2FUV data set is at a nominal resolution of 2.0 Å with a completeness of 27% in the outer resolution shell). In addition, during efforts to produce an enzyme–ligand complex, an alternative crystal form for StPGM occurred rarely, crystallizing in a novel space group (P21, form B) and diffracting to 1.95 Å. In both crystal forms, the asymmetric unit contains two monomers that are essentially identical to each other: the monomer–monomer Cα root mean square deviation (rmsd) over all residues is 0.37 and 0.43 Å, for the form A and B structures, respectively. Structural differences between these two crystal forms will be discussed in below. Unless otherwise specified, the structural descriptions in the following sections refer to the 1.7 Å structure of StPGM.
The StPGM monomer is a 546-residue protein [Fig. 2(A)] with four domains of roughly equal size, arranged in an overall heart-shape. Domains 1–3 share a common mixed α/β core, with a central four-stranded β-sheet flanked on either side by an α-helix. Each domain has several insertions relative to the common a/β core, especially domain 1, which has two extra β-strands and a total of nine α-helices. Domain 4, in contrast, shares no structural similarity with the other three domains, and consists of a 5-stranded antiparallel β-sheet with several peripheral α-helices. This domain is a member of the TATA-box binding protein-like fold family.48 The active site of StPGM is located in its large central cleft, formed at the confluence of the four structural domains. This cleft has a surface area of more than 2300 Å2 as calculated by CASTp,49 and involves ~90 residues. The active site cleft is quite hydrophilic, with more than 60% of residues being charged or polar, consistent with the nature of the phosphosugar substrates. While the overall charge of the protein is negative (pI = 5.6), the active site is positively charged [Fig. 2(B)].
Figure 2.
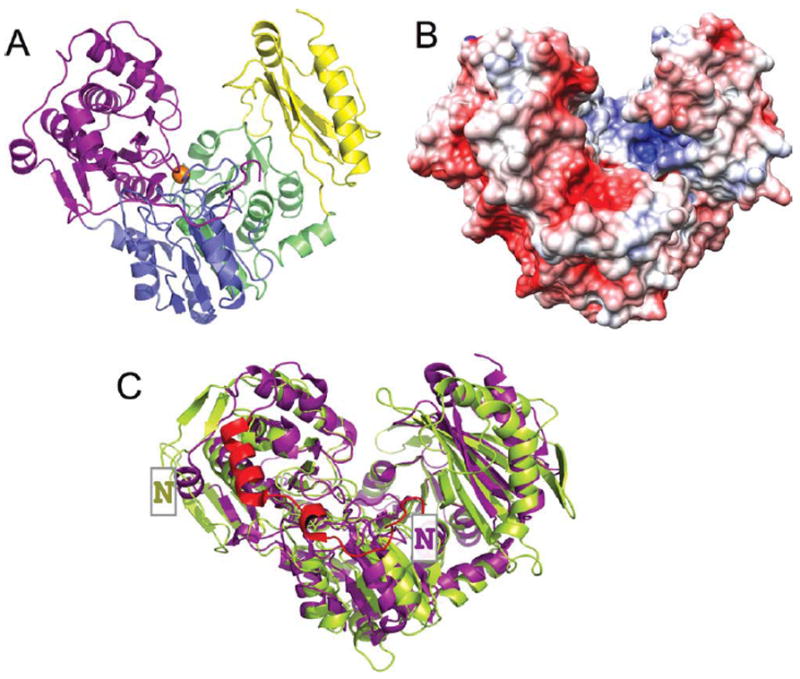
A: A ribbon diagram of the StPGM monomer colored by domain. Domain 1 (residues 1–205) is shown in purple, domain 2 (residues 206–319) in blue, domain 3 (residues 320–441) in green, and domain 4 (residues 442–546) in yellow. The bound Mg2+ ion in the active site is shown as an orange sphere. B: The electrostatic potential of StPGM shown on a surface rendering. Negative charge is in red, positive in blue. For the purpose of this figure, any charged side chains not included in the crystal structure due to disorder were built in a chemically reasonable position so their charge would contribute to the calculations. Figure made using PMV, MSMS, and Chimera.45-47 C: Ribbon diagram showing a superposition of the monomers of StPGM (purple) and rabbit PGM (green). Chain A from PDB files 3NA5 and 3PMG were used. The N-terminal extension (~20 residues) and dimerization helix of StPGM are shown in red. The NH2-terminus of each protein is indicated by a boxed N.
As noted in the Introduction Section, in addition to that of S. typhimurium, crystal structures of PGMs have been determined from three different organisms, including the bacterium T. thermophilus and the eukaryotes P. tetraurelia and rabbit. All of these proteins are ~550 residues in length (Supporting Information Fig. S1), and share the four-domain architecture described above for StPGM, and which more generally appears common to all enzymes in the α-d-phosphohexomutase superfamily.10 A superposition of the StPGM and rabbit PGM crystal structures is shown on Figure 2C. While the core topology of each of the four domains is conserved (rmsd 2.3 Å for 425 Cα pairs), there are a number of insertions and deletions in StPGM relative to rabbit PGM. The largest of these is an extension of ~20 residues at the N-terminus of StPGM. Similar differences (small to medium insertions/deletions) are seen when comparing StPGM with the PGM structures from T. thermophilus and P. tetraurelia (Supporting Information Fig. S1). Most of these structural differences localize to the periphery of the molecule. In contrast, the active sites of the proteins are structurally quite similar, and the catalytic residues are very highly conserved in both sequence and structure across the whole enzyme family (see following sections).
To facilitate the sequence-structure and comparative analyses of PGM enzymes herein, Supporting Information Fig. S1 shows a small alignment of 11 PGM sequences chosen because of previous structural, biochemical, or biological characterization. These include the four PGMs of known structure as well as PGM from A. xylinum, which has been biochemically characterized,19-21 and sequences from six human pathogens where this enzyme has been shown to play a role in infectivity.1,3-5,8,50-52 Despite their general structural similarity and similar chain length, the sequence diversity of the PGM enzymes is quite high. For example, the overall amino acid identity between StPGM and rabbit PGM is only ~25%, reflecting the enormous evolutionary distance between the bacterial enzymes and their eukaryotic counterparts. Also included in the alignment is the sequence of the related enzyme phosphomannomutase/phosphoglucomutase (PMM/PGM) from Pseudomonas aeruginosa. This protein belongs to a different sub-group of the α-d-phosphohexomutase superfamily that can utilize both glucose and mannose-based phosphosugar substrates, but it shares the overall structural topology and conservation of key active site regions with StPGM. We include PMM/PGM in the alignment because of its previous extensive structural and kinetic characterization.39,53-62 A much larger alignment of more than 400 PGM sequences is shown in Supporting Information Fig. S2.
Quaternary structure
The oligomeric state of StPGM was investigated in solution by several methods. Dynamic light scattering showed a hydrodynamic radius of 4.4 nm, consistent with a MW of 105.2 kD, not quite twice that of the expected monomeric molecular weight (60.8 kDa). The oligomeric state of StPGM was also examined by analytical ultracentrifugation [Fig. 3(A)]. An average mass of 109.6 ± 0.7 kDa was calculated by fitting data from 18 sedimentation equilibrium profiles to an ideal single-species model. This is within 10% of that expected for a dimer of StPGM, including the residues in the histidine tag. Single species and monomer-dimer models yielded statistically equivalent fits to the data. An association constant Ka of 7.7 × 10⁵ ± 0.2M−1 was obtained with the latter, corresponding to a dissociation constant of 1.3 μM. SAXS measurements were also performed [Fig. 3(B)]. The radius of gyration (Rg) estimated from Guinier analysis was 33.4 Å. A nearly identical value of 33.5 Å was obtained from calculations of the pair distribution function. The Rg calculated from the coordinates of the StPGM monomer is only 20.2 Å, suggesting that the monomer is not the predominant species in solution. Indeed, the scattering curve calculated from the monomer agrees poorly with the experimental one throughout the entire q range [Fig. 3(B)]. On the other hand, for the dimer in the asymmetric unit [Fig. 4(A)], the Rg of 43 Å and calculated profile agree well with the SAXS data [Fig. 3(B)]. Hence all three experimental methods suggest that StPGM forms a dimer in solution. To our knowledge, this is the first direct experimental demonstration of an oligomer for any PGM enzyme or member of the α-d-phosphohexomutase superfamily.
Figure 3.
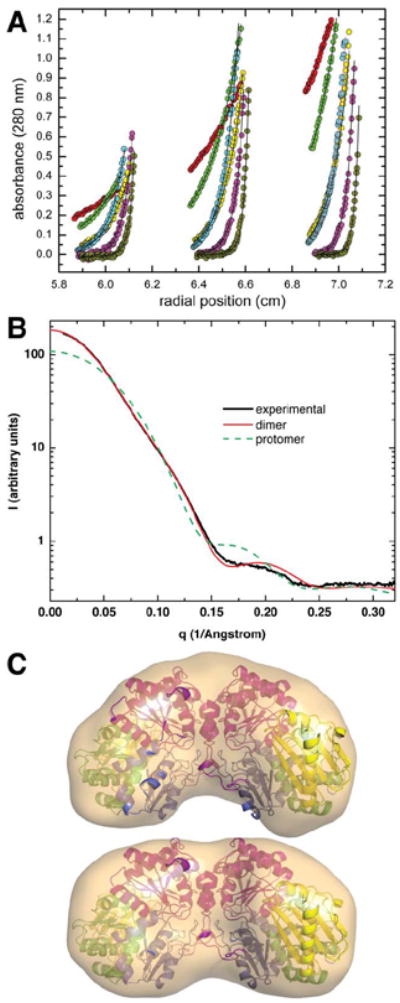
Biophysical studies of StPGM in solution. A: Sedimentation equilibrium data collected at 6000 (red), 9000 (green), 14,000 (yellow), 12,000 (cyan), 18,000 (magenta), and 25,000 (orange) rpm. The solid lines through the data represent the best fit to a single-species model. For clarity, only a subset of the data points is displayed. B: Experimental and calculated SAXS curves. The thick solid black curve represents the experimental data. The other curves represent SAXS profiles calculated from the dimer (solid red) and monomer (green dashes). C: Shape reconstructions calculated from SAXS data. The surfaces represent the SAXS reconstructions (averaged and filtered volumes) calculated using GASBOR without symmetry constraints (top) and with two-fold symmetry (bottom). The structure of the dimer is shown superimposed onto the SAXS shapes. Superposition calculations were performed using SUPCOMB.63
Figure 4.

A: Two views of the StPGM dimer as found in the asymmetric unit of crystal form A. Domain 1 of chain A is shown in purple, domain 1 of chain B in cyan. For clarity, the other three domains in each monomer are in white. B: A close-up view of the StPGM dimer interface. Orientation and colors as panel A, top. Side chains of key residues are shown as stick models as follows: the YY motif (red), residues that form hydrogen bonds (green), residues in salt bridges (yellow). C: A close-up view of the N-terminal dimerization helix, viewed down the twofold axis. Proteins are oriented similarly to panel A, bottom. Side chains of interacting residues are colored as in panel B. Only residues in chain A are labeled. D: The proposed C-H⋯π hydrogen bond network involving tyrosines 26 and 27 near the dimer interface of StPGM. Black dashed lines indicate the distance between the hydrogen and the center of mass of the tyrosine rings (red X). Side chains of the involved residues are shown as stick models, with hydrogens (gray) in their calculated positions.64 Horizontal gray line separates residues in chain A and B of the dimer. Virtually identical interactions (not shown) are found for the same residues in chain B.
Ab initio shape reconstruction calculations were also performed. The normalized spatial discrepancy (NSD) for the set of 10 GASBOR models calculated without enforcing twofold symmetry is 1.01 ± 0.02, which indicates a reasonably high quality shape reconstruction. The volume exhibits approximate twofold symmetry and agrees well with the coordinates of the dimer [Fig. 3(C), top]. GASBOR calculations were also performed with the constraint of twofold symmetry [Fig. 3(C), bottom]. The NSD is 1.02 ± 0.06. The dimer also exhibits good agreement with the P2 SAXS shape. It is concluded that the dimer in the crystallographic asymmetric unit is formed in solution.
Structural features and conservation of the StPGM dimer interface
An overview of the StPGM dimer is shown in Figure 4. The dimer has an interfacial area of ~1100 Å2 and is stabilized by 16 hydrogen bonds and 6 ion pairs.65 Approximately 30 residues from each monomer contribute to the dimer interface (~5% of the total surface area of the protein). Residues involved in electrostatic interactions in the dimer interface are listed in Supporting Information Table 2 and are highlighted according to their position in the amino acid sequence on Supporting Information Figure S1. A dimer nearly identical to that shown in Figure 4(A) is seen in the T. thermophilus PGM crystal. However, that structure has ~30 disordered residues that are missing from the model, some of which would be expected to be in the dimer interface based on the StPGM structure. Rabbit PGM and parafusin also crystallize with two molecules in the asymmetric unit, but neither is predicted to be a dimer by PISA (data not shown).
A large cluster of contacts in the dimer interface comes from residues in an α-helix (residues 19–28) near the N-terminus of the protein [Fig. 4(B,C), Supporting Information S1]. Near the C-terminus of this helix are two highly conserved, consecutive tyrosine residues (Y26 and Y27), one of which is involved directly in non-bonded interactions in the dimer interface. Several other residues in this helix, which we refer to as the N-terminal dimerization helix, also make hydrogen bond and van der Waals interactions with corresponding residues in the other chain. The striking sequence conservation of the two adjacent tyrosines in the N-terminal dimerization helix led us to more carefully scrutinize the structural context of these residues. In the case of Y26, the tyrosine hydroxyl participates in a hydrogen bond with the side chain of S97 within the same monomer. The side chain of Y27 makes a hydrogen bond with water, but not with other protein atoms, offering no obvious explanation for the strong sequence conservation of this residue.
Further analyses, however, suggest that the side chains of both Y26 and Y27 may participate in an alternative hydrogen bond network, mediated by C-H⋯π interactions. Although not commonly described in the literature, C-H⋯π hydrogen bonds have been proposed to be energetically important in protein structures.66 Based on the criteria described in,66 C-H⋯π hydrogen bonds involving Y26 and Y27 in StPGM contribute to both intra- and intermolecular interactions in the protein. As detailed in Figure 4(D), likely C-H⋯π interactions are found between Y27 and Y26 within each monomer, and between Y27 in chains A and B of the dimer. Another C-H⋯π hydrogen bond is observed between P93 and Y26 within the monomer, further extending the network. In the case of the Y27-Y27 and Y26-P93 interactions, an aliphatic Cβ hydrogen acts as the donor, while the aromatic ring of the tyrosine is the π-acceptor. In the Y26-27 interaction, an aromatic Cδ hydrogen on the edge one aromatic ring acts as the donor while the alternative ring acts as the π-acceptor (also called a “face-to-edge” interaction). Both of these C-H donor/π-acceptor arrangements are common in other proteins.66 Thus, the proposed C-H⋯π network involving Y26 and Y27 provides an explanation for the strong sequence conservation of these residues in the N-terminal dimerization helix. We note that in other bacterial PGM sequences, the conservative substitutions of Y-F or F-Y are sometimes found in place of Y-Y, supporting this notion (Supporting Information Fig. S3). These C-H⋯π interactions may help stabilize the dimer of StPGM, in addition to the many hydrogen bond and van der Waals interactions that are also found in the interface.
Sequence alignments show that the N-terminal dimerization helix is conserved in a large number of bacterial PGM proteins. This 10-residue helix has a consensus sequence of [IxxLxxAYYx] (where capital letters indicate >45% conservation) and is directly preceded by a well-conserved N/D. Moreover, secondary structure predictions of multiple PGM sequences with the YY motif (data not shown) indicate that this region of sequence has a high helical propensity. In our small selected alignment of PGMs (Supporting Information Fig. S1), the YY motif is found in 4 of the 11 sequences, and we therefore predict these proteins will also be dimers. Curiously, these four proteins are all from gram-negative bacteria, while the sequences from other bacterial species (including both gram-positive and gram-negative organisms) and the eukaryotes lack this motif. To further characterize the phylogenetic distribution of the PGMs with a dimerization helix, we aligned 416 PGM sequences (see Materials and Methods), and constructed a phylogenetic tree (Supporting Information Fig. S4). This large tree has two major sub-groups or clades (denoted I and II on Supporting Information Fig. S4). Sub-group I includes a majority of gram-negative organisms, whereas sub-group II comprises mostly gram-positive organisms. We find that the YY motif is found in 75 PGM sequences (Supporting Information Fig. S3), all of which localize to sub-group I, and that a majority of these sequences are from gram-negative bacteria (~19 of the 75 YY-motif containing PGMs are from gram-positive organisms). These 75 PGM proteins all contain the signature N-terminal dimerization helix, and are therefore are likely to be dimers. Also within PGM sub-group I is a clade containing eukaryotic sequences, none of which contain the YY motif. Likewise, the PGM sequences in sub-group II (primarily from gram-positive organisms and lower eukaryotes) all lack the YY-motif and dimerization helix. Thus it appears that the eukaryotic PGM proteins (and most from gram-positive organisms) are unlikely to be dimers. This prediction is consistent with analysis of the rabbit PGM and parafusin crystal structures by PISA.
Sequence and structural conservation of the active site
In lieu of an enzyme–ligand complex for StPGM, we have conducted a sequence-structure analysis to gain insights into the residues involved in catalysis and ligand binding. Previous studies have identified four critical regions of the active site of the α-d-phosphohexomutases, with characteristic sequence signatures for residues involved in catalysis and/or ligand binding (for review see Ref. 10). These are: (i) the phosphoserine residue that participates in phosphoryl transfer domain 1; (ii) the metal-binding loop in domain 2; (iii) a sugar-binding loop in domain 3; and (iv) the phosphate-binding site in domain 4 that interacts with the phosphate group of the substrate. We identify the residues of StPGM in these four regions as: (i) S146; (ii) D304, D306, and D308; (iii) the loop including E392 and S390; and (iv) the loop containing R507, S509, G510 and T511 (see also Supporting Information Table 3). Figure 5(A,B) shows a close-up view of these four regions in the active site of StPGM and highlights their structural similarity with the active site of rabbit PGM.
Figure 5.

A: Close-up view of the active site of StPGM. Domain colors are as Figure 1A. Residues highlighted on Supporting Information Table 3 are shown in stick model and labeled. Dotted line shows the distance in Å between the Cα atoms of the two latch residues (T44 and T511) in form A of StPGM (3NA5). B: A superposition of StPGM (purple) with the closed conformer of parafusin (1KFI) in salmon. Only the phosphate-binding loop of parafusin is shown, highlighting the differences with the same loop in StPGM (see green arrow). In cyan are the bound sulfate molecules found in the 1KFI structure. In green are the side chains of rabbit PGM from regions (i–iii) of the active site. The Mg2+ ion from StPGM is in orange, from rabbit PGM is in green. Also included is the ligand glucose-1,6-bisphosphate (green carbons) from a rabbit PGM structure (1C4G). Despite the presence of the ligand, the rabbit enzyme failed to adopt the closed conformation observed in the sulfate-bound parafusin structure. Nevertheless, the phosphates of the ligand align very closely with the sulfates from the closed parafusin structure, 1KFI, supporting our predicted enzyme–ligand contacts. C: Superposition of the open (purple) and half-closed (cyan) conformers of StPGM, observed in the form A and form B crystal structures respectively. Also superimposed are 17 coordinates sets (gold) showing the conformational fluctuations predicted by a combination of two low frequency normal modes from the elNémo server. The most closed of these 17 conformations closely resembles the sulfate-bound conformer of parafusin, placing the phosphate-binding loop of StPGM in appropriate position to contact bound ligand and close the interdomain latch. D: Residue patches with unusual physicochemical properties in the active sites of (top panel) StPGM (3NA5), and (bottom panel) rabbit PGM (3PMG) highlighting the overall differences between the two proteins. Residue patches (shown as spheres) were calculated by HotPatch, and are colored by rank in decreasing order: red, orange, yellow, green, cyan, and magenta. The locations, residues involved, and number of patches found differ between the two proteins. For both enzymes, the top-ranked (red) patch has a functional confidence value of 1.0, and contains at least three of the key active site residues from Supporting Information Table 3. For StPGM, these are: V371, E390, E391, S392, Y445, R507, and Y518. For rabbit PGM, these are: T18, T356, K359, R502, and R514. Only one identical corresponding residue pair (R507 and R502) is found in this patch for the two proteins. The neural network option in HotPatch that includes a combination of properties (e.g., hydrophobicity, electrostatic potential, etc.) was used for patch identification.
Region (i) of the active site, S146, defines the site of phosphoryl transfer, from the enzyme to the substrate, and from the intermediate back to the protein. This serine falls within a loop of highly conserved residues (Tp/aSHNP), which form a type II’ b-turn. To participate in phosphoryl transfer, S146 must be phosphorylated. Despite attempts at phosphorylation, only the dephosphoserine was observed in the StPGM crystals. To confirm the catalytic competence of the enzyme, its steady state kinetic parameters were determined (see Materials and Methods), with Km = 39.1 ± 3.2 μM, and kcat = 72 ± 2 s−1. Near the phosphoserine is a conserved arginine (R48 in StPGM) that may serve as a general/acid base for the phosphoryl transfer reaction. Mutation of this residue has been shown to result in an inactive enzyme in both A. xylinum PGM and P. aeruginosa PMM/PGM.20,56
The metal-binding site, region (ii), in each monomer of StPGM contains one Mg2+ ion, which is coordinated by the three aspartates, a water molecule, and also by the side chain oxygen of the conserved active site serine (S146). The Mg2+ serves as an electron-withdrawing group to facilitate phosphoryl transfer from S146 (see Fig. 1). The five Mg2+-ligand distances range from 1.98 to 2.04 Å, and are arranged in somewhat distorted trigonal pyramidal geometry [Fig. 5(A)].
Region (iii) is the sugar-binding loop. Two highly conserved residues, E390 and S392 in StPGM, are found in this region. In enzyme–ligand complexes of related proteins, including P. aeruginosa PMM/PGM, the corresponding residues make contacts with the O3 and O4 hydroxyl groups of the phosphosugar substrates.55 We therefore propose that E390 and S392 will make similar contacts to the O3 and O4 hydroxyls of the G1P and G6P substrates of StPGM. The importance of the conserved glutamate in region (iii) has been confirmed by site-directed mutagenesis in both A. xylinum PGM and P. aeruginosa PMM/PGM.20,60
Region (iv) of the active site includes residues in domain 4 that are proposed to interact with the phosphate group of the bound substrate or product. Potential enzyme–ligand interactions by this region are strongly affected by known conformational variability of domain 4 in the enzyme superfamily. To model these contacts, we superpose StPGM with a sulfate-bound structure of parafusin (1KFI), which adopts a closed conformation representative of the ligand-bound enzyme. Based on this superposition, the residues of StPGM expected to be involved in direct phosphate contacts are R507, S509, G510, and K516, which are highly conserved in all PGM proteins (Supporting Information Table 3). An analysis of the form B structure of StPGM, which has a phosphate ion bound to region (iv) of the protein, supports these suggested roles (see following section).
Another important structural feature of the PGM active site was revealed in the sulfate-bound parafusin structure.18 This is a group of highly conserved residues termed “the latch” that form an interface between domain 1 and domain 4 in the closed conformation of the enzyme (Supporting Information Fig. S5.) The latch involves two threonine residues, one from domain 1 and another from domain 4. In StPGM, the corresponding highly conserved residues are T44 and T511 [Fig. 5(A), Supporting Information Table 3]. The importance of the latch is shown by a mutation of the threonine residue domain 1 in PGM of A. xylinum, which results in an enzyme with kcat/Km = 0.04% that of wild-type.20 The latch appears to be a critical and unique feature of the ligand bound conformer of all PGMs, creating a lid that encloses bound substrate in the active site.
Conformational variability of domain 4
To better understand the conformational change expected upon ligand binding for StPGM, we compare the protein conformers observed in the two crystal forms. In the form B structure, domain 4 is found to rotate by ~10° relative to the form A structure [Fig. 5(C), compare purple and cyan chains]. Analysis by DYNDOM67 localizes this change partially to amino acids 440–445, which fall in a loop near the junction of domains 3 and 4. These residues of StPGM align with a region of P. aeruginosa PMM/PGM known as the hinge, and is a site conformational change in the enzyme–ligand complexes. 60 Depending on which pairs of monomers are compared (chain A vs. A, or A vs. B, etc.), other changes in backbone angles are found at several sites in domain 3 as well. We note that these observed conformational changes occur without affecting the dimer interface of StPGM, since it involves residues exclusively in domains 1 and 2 of the protein.
Despite the rotation of domain 4 observed in form B of StPGM, no convincing electron density for the intact ligand could be found in the maps. However, a phosphate ion bound to region (iv) of the protein was included in the final model based on the refined electron density maps. (Because of the high B-factor of these phosphates, possibly indicating partial occupancy, we include only a brief discussion of its interactions.) Residues contacting this phosphate include the conserved residues R507, S509, G510, and K516 (small differences in contacts are seen between the two monomers in the crystal). These residues are consistent with those of region (iv) predicted to make ligand contacts in the preceding section. Structural superpositions with the sulfate-bound structure of parafusin (data not shown), however, show that the closure of the active site in this structure of StPGM is incomplete. Apparently, the form B structure represents a partly closed conformer of the enzyme. These multiple conformational variants of StPGM (open, closed, half-closed) complicate modeling of enzyme–ligand interactions, but are potentially quite relevant to enzyme mechanism, as conformational change of the enzyme must occur at several points during the multi-step reaction.
To model the fully closed conformer of StPGM, we turned to normal mode analysis, which has been shown to successfully predict likely conformation fluctuations in many protein systems (for review see Ref. 68). These calculations were done as described in Materials and Methods, using the elNémo server.44 To assess whether a normal mode produced a conformational change relevant to ligand binding, the sulfate-bound structure of parafusin (1KFI) was used a reference for the fully closed conformation, and the distance between the Cα atoms of the latch residues of StPGM (T44-T511) was monitored. The five lowest frequency modes7-11 from elNémo all show some conformational variability of domain 4 (or segments thereof) relative to the rest of the protein. Of these, normal mode 7 produces a hinge-like rotation of domain 4 that generally opens or closes the active site cleft. Importantly, the fluctuations of normal mode 7 correlate very well with the conformational change observed in form B of StPGM (data not shown). The fluctuations of this mode decrease the T44-T511 distance, although not to the extent seen in the parafusin structures, where it changes from 13.5 in the apo-enzyme to 5.9 Å in the sulfate-bound structure. Another low frequency normal mode10 for StPGM, showed conformational fluctuations of a loop in domain 4 (amino acids 508–516), which includes residues from the region (iv) phosphate-binding site. By combining these two low frequency normal modes [Fig. 5(C)], a conformational change for StPGM was observed that reduces the T44-T511 distance from 14.2 to 6.9 Å (within 0.7 Å of the distance in the closed parafusin structure). The results of the normal mode analysis of StPGM are consistent with that seen in other protein systems, where one or two low frequency normal modes are sufficient to reproduce functionally important conformational changes.68
Prospects for inhibitor design
Effective inhibitors for the bacterial PGMs have potential for treating microbial infections, including those of antibiotic resistant bacterial organisms. To develop inhibitors with clinical utility, it is necessary to effectively target the PGM of the pathogen, rather than the human enzyme. Such inhibitors must therefore not rely exclusively on interactions with the highly conserved catalytic residues in the active site of the enzyme, such as those in Supporting Information Table 3. Fortunately, because of the sequence diversity between the eukaryotic and bacterial enzymes (see preceding sections), many residues within the large active site cleft are not conserved and provide opportunities for novel interactions with the bacterial enzymes and/or for excluding inhibitors from the active site of the human protein. To illustrate this point, we use the program HotPatch69 to identify groups of amino acids with unusual physicochemical properties. This program was developed to help identify functional sites in proteins, but here we use it simply to contrast the active site environments of StPGM and rabbit PGM. As can be seen on Figure 5(D), unusual residue patches cluster in and around the active sites of these two proteins, and even a cursory examination shows that they differ in location and ranking. It is likely that such differences in physicochemical environment could be effectively exploited in the design of specific inhibitors.
Developing inhibitors that can distinguish between related homologs is still a difficult design problem, but recent studies show some success in overcoming this challenge.70,71 Design approaches that utilize interactions outside of the active site, such as allosteric inhibition72 or protein packing defects,73 may be useful for the PGM family. In particular, the interdomain crevices that surround the active site could facilitate the development of inhibitors specific to the bacterial enzymes, as these interfaces are not as highly conserved as the catalytic residues. A recent analysis of P. aeruginosa PMM/PGM shows that the domain–domain interfaces of this enzyme provide highly favorable binding sites for small molecules.61
CONCLUSIONS
The critical metabolic role of PGM has been recognized for decades. Consistent with this, characterizations of PGM were among the first published reports of enzymes, dating back to the 1940s.74 Subsequently, rabbit PGM was the subject of a multi-decade investigation by the laboratory of William Ray, whose highly detailed and technical studies remain the epitome of work on this enzyme’s mechanism. However, the emerging role of PGM in bacterial pathogenesis has spurred new interest in this enzyme, with proteins from a number of bacterial species being characterized for the first time. These studies have shown that PGM plays a variety of roles in bacterial fitness and infectivity in a wide range of bacterial species, including human and animal pathogens. In light of the sequence diversity between the bacterial and eukaryotic enzymes, previous structural and mechanistic studies of PGM (e.g., from rabbit) may not be sufficient for understanding these distantly related bacterial homologs. The high-resolution crystal structure of S. typhimurium PGM presented here allows a detailed comparison of the bacterial and eukaryotic enzymes, and sheds light on key active site residues important for the entire enzyme family. This work lays a foundation for future studies of PGM enzymes from other organisms, including the design of site-directed mutants, substrate specificity studies, and mechanistic characterization.
Supplementary Material
Acknowledgments
The authors thank Dr. Jay Nix of ALS beamline 4.2.2 and Dr. Jon Schuermann of the APS NE-CAT beamline 24 ID-C for assistance with data collection and processing, Dr. Greg L. Hura of beamline 12.3.1 for help with SAXS data collection and analysis, and Dr. Cristina Furdui for helpful discussions. They also gratefully acknowledge the receipt of clone APC 24352 courtesy Dr. A. Joachimiak and Dr. F. Collart at Argonne National Lab, Illinois. Part of this work was performed at the Advanced Light Source. Part of this work is based upon research conducted at the Northeastern Collaborative Access Team beamlines of the Advanced Photon Source.
Grant sponsor: National Science Foundation; Grant number: MCB-0918389; Grant sponsor: Office of Basic Energy Sciences, U.S. Department of Energy; Grant number: DE-AC02-05CH11231, W-31-109-ENG-38; Grant sponsor: National Center for Research Resources, NIH; Grant number: RR-15301.
Abbreviations
- Bis-Tris
2[bis(2-hydroxyethyl (imino)-2-(hydroxymethyl)]-1,3 propanediol
- DTT
dithiothreitol
- EDTA
ethylenediaminetetraacetic acid
- IPTG
isopropyl β-d-1-thiogalactopyranoside
- LB
Luria-Bertani medium
- MOPS
3-(N-morpholino)propanesulfonic acid
- NADH
nicotinamide adenine dinucleotide (reduced form)
- NAD+
nicotinamide adenine dinucleotide (oxidized form)
- NSD
normalized spatial discrepancy
- PAGM
N-acetylglucosamine phosphate mutase
- PDB
Protein Data Bank
- PGM
phosphoglucomutase
- PIR
Protein Information Resource
- PMM/PGM
phosphomannomutase/phosphoglucomutase
- PMSF
phenylmethylsulfonyl fluoride
- Rg
radius of gyration
- rmsd
root mean square deviation
- SAXS
small-angle X-ray scattering
- StPGM
S. typhimurium PGM
- THP
Tris(hydroxypropyl) phosphine
- TLCK
tosyl lysyl chloromethyl ketone
Footnotes
Additional Supporting Information may be found in the online version of this article.
References
- 1.Paterson GK, Cone DB, Peters SE, Maskell DJ. The enzyme phosphoglucomutase (Pgm) is required by Salmonella enterica serovar Typhimurium for O-antigen production, resistance to antimicrobial peptides and in vivo fitness. Microbiology. 2009;155(Part 10):3403–3410. doi: 10.1099/mic.0.029553-0. [DOI] [PubMed] [Google Scholar]
- 2.Ugalde JE, Czibener C, Feldman MF, Ugalde RA. Identification and characterization of the Brucella abortus phosphoglucomutase gene: role of lipopolysaccharide in virulence and intracellular multiplication. Infect Immun. 2000;68:5716–5723. doi: 10.1128/iai.68.10.5716-5723.2000. [DOI] [PMC free article] [PubMed] [Google Scholar]
- 3.Bizzini A, Majcherczyk P, Beggah-Moller S, Soldo B, Entenza JM, Gaillard M, Moreillon P, Lazarevic V. Effects of alpha-phosphoglucomutase deficiency on cell wall properties and fitness in Streptococcus gordonii. Microbiology. 2007;153(Part 2):490–498. doi: 10.1099/mic.0.29256-0. [DOI] [PubMed] [Google Scholar]
- 4.Grundling A, Schneewind O. Genes required for glycolipid synthesis and lipoteichoic acid anchoring in Staphylococcus aureus. J Bacteriol. 2007;189:2521–2530. doi: 10.1128/JB.01683-06. [DOI] [PMC free article] [PubMed] [Google Scholar]
- 5.Felek S, Muszynski A, Carlson RW, Tsang TM, Hinnebusch BJ, Krukonis ES. Phosphoglucomutase of Yersinia pestis is required for autoaggregation and polymyxin B resistance. Infect Immun. 2010;78:1163–1175. doi: 10.1128/IAI.00997-09. [DOI] [PMC free article] [PubMed] [Google Scholar]
- 6.Jolly L, Wu S, van Heijenoort J, de Lencastre H, Mengin-Lecreulx D, Tomasz A. The femR315 gene from Staphylococcus aureus, the interruption of which results in reduced methicillin resistance, encodes a phosphoglucosamine mutase. J Bacteriol. 1997;179:5321–5325. doi: 10.1128/jb.179.17.5321-5325.1997. [DOI] [PMC free article] [PubMed] [Google Scholar]
- 7.Wu S, de Lencastre H, Sali A, Tomasz A. A phosphoglucomutase-like gene essential for the optimal expression of methicillin resistance in Staphylococcus aureus: molecular cloning and DNA sequencing. Microb Drug Resist. 1996;2:277–286. doi: 10.1089/mdr.1996.2.277. [DOI] [PubMed] [Google Scholar]
- 8.Buchanan JT, Stannard JA, Lauth X, Ostland VE, Powell HC, Westerman ME, Nizet V. Streptococcus iniae phosphoglucomutase is a virulence factor and a target for vaccine development. Infect Immun. 2005;73:6935–6944. doi: 10.1128/IAI.73.10.6935-6944.2005. [DOI] [PMC free article] [PubMed] [Google Scholar]
- 9.Ugalde JE, Comerci DJ, Leguizamon MS, Ugalde RA. Evaluation of Brucella abortus phosphoglucomutase (pgm) mutant as a new live rough-phenotype vaccine. Infect Immun. 2003;71:6264–6269. doi: 10.1128/IAI.71.11.6264-6269.2003. [DOI] [PMC free article] [PubMed] [Google Scholar]
- 10.Shackelford GS, Regni CA, Beamer LJ. Evolutionary trace analysis of the alpha-d-phosphohexomutase superfamily. Protein Sci. 2004;13:2130–2138. doi: 10.1110/ps.04801104. [DOI] [PMC free article] [PubMed] [Google Scholar]
- 11.Ray WJ, Jr, Burgner JW, II, Deng H, Callender R. Internal chemical bonding in solutions of simple phosphates and vanadates. Biochemistry. 1993;32:12977–12983. doi: 10.1021/bi00211a005. [DOI] [PubMed] [Google Scholar]
- 12.Ray WJ, Jr, Burgner JW, II, Post CB. Characterization of vanadate-based transition-state-analogue complexes of phosphoglucomutase by spectral and NMR techniques. Biochemistry. 1990;29:2770–2778. doi: 10.1021/bi00463a021. [DOI] [PubMed] [Google Scholar]
- 13.Ray WJ, Jr, Post CB, Puvathingal JM. Comparison of rate constants for (PO3-) transfer by the Mg(II). Cd(II), and Li(I) forms of phosphoglucomutase. Biochemistry. 1989;28:559–569. doi: 10.1021/bi00428a022. [DOI] [PubMed] [Google Scholar]
- 14.Lowry OH, Passonneau JV. Phosphoglucomutase kinetics with the phosphates of fructose, glucose, mannose, ribose, and galactose. J Biol Chem. 1969;244:910–916. [PubMed] [Google Scholar]
- 15.Dai JB, Liu Y, Ray WJ, Jr, Konno M. The crystal structure of muscle phosphoglucomutase refined at 2.7- angstrom resolution. J Biol Chem. 1992;267:6322–6337. [PubMed] [Google Scholar]
- 16.Lin Z, Konno M, Abad-Zapatero C, Wierenga R, Murthy MR, Ray WJ, Jr, Rossmann MG. The structure of rabbit muscle phosphoglucomutase at intermediate resolution. J Biol Chem. 1986;261:264–274. [PubMed] [Google Scholar]
- 17.Liu Y, Ray W, Baranidharan S. Structure of rabbit muscle phosphoglucomutase refined at 2.4 Å resolution. Acta Crystallogr D. 1997;53:392–405. doi: 10.1107/S0907444997000875. [DOI] [PubMed] [Google Scholar]
- 18.Muller S, Diederichs K, Breed J, Kissmehl R, Hauser K, Plattner H, Welte W. Crystal structure analysis of the exocytosis-sensitive phosphoprotein, pp63/parafusin (phosphoglucomutase), from Paramecium reveals significant conformational variability. J Mol Biol. 2002;315:141–153. doi: 10.1006/jmbi.2001.5168. [DOI] [PubMed] [Google Scholar]
- 19.Brautaset T, Petersen S, Valla S. An experimental study on carbon flow in Escherichia coli as a function of kinetic properties and expression levels of the enzyme phosphoglucomutase. Biotechnol Bioeng. 1998;58:299–302. [PubMed] [Google Scholar]
- 20.Brautaset T, Petersen SB, Valla S. In vitro determined kinetic properties of mutant phosphoglucomutases and their effects on sugar catabolism in Escherichia coli. Metab Eng. 2000;2:104–114. doi: 10.1006/mben.1999.0145. [DOI] [PubMed] [Google Scholar]
- 21.Kvam C, Olsvik ES, McKinley-McKee J, Saether O. Studies on recombinant Acetobacter xylinum alpha-phosphoglucomutase. Biochem J. 1997;326(Part 1):197–203. doi: 10.1042/bj3260197. [DOI] [PMC free article] [PubMed] [Google Scholar]
- 22.Wang Y, Zhang YH. A highly active phosphoglucomutase from Clostridium thermocellum: cloning, purification, characterization and enhanced thermostability. J Appl Microbiol. 2010;108:39–46. doi: 10.1111/j.1365-2672.2009.04396.x. [DOI] [PubMed] [Google Scholar]
- 23.Kato N, Mueller CR, Wessely V, Lan Q, Christensen BM. Aedes aegypti phosphohexomutases and uridine diphosphate-hexose pyrophosphorylases: comparison of primary sequences, substrate specificities and temporal transcription. Insect Mol Biol. 2005;14:615–624. doi: 10.1111/j.1365-2583.2005.00592.x. [DOI] [PubMed] [Google Scholar]
- 24.Hirose M, Sugimoto E, Sasaki R, Chiaa H. Crystallization and reaction mechanism of yeast phosphoglucomutase. J Biochem. 1970;68:449–457. doi: 10.1093/oxfordjournals.jbchem.a129375. [DOI] [PubMed] [Google Scholar]
- 25.Manjunath S, Lee CH, VanWinkle P, Bailey-Serres J. Molecular and biochemical characterization of cytosolic phosphoglucomutase in maize. Expression during development and in response to oxygen deprivation. Plant Physiol. 1998;117:997–1006. doi: 10.1104/pp.117.3.997. [DOI] [PMC free article] [PubMed] [Google Scholar]
- 26.Davies EJ, Tetlow IJ, Bowsher CG, Emes MJ. Molecular and biochemical characterization of cytosolic phosphoglucomutase in wheat endosperm (Triticum aestivum L. cv. Axona) J Exp Bot. 2003;54:1351–1360. doi: 10.1093/jxb/erg151. [DOI] [PubMed] [Google Scholar]
- 27.McClelland M, Sanderson KE, Spieth J, Clifton SW, Latreille P, Courtney L, Porwollik S, Ali J, Dante M, Du F, Hou S, Layman D, Leonard S, Nguyen C, Scott K, Holmes A, Grewal N, Mulvaney E, Wilson RK. Complete genome sequence of Salmonella enterica serovar Typhimurium LT2. Nature. 2001;413:852–856. doi: 10.1038/35101614. [DOI] [PubMed] [Google Scholar]
- 28.Otwinowski Z, Minor W. Processing of X-ray diffraction data collected in oscillation mode. Methods Enzymol. 1997;276:307–326. doi: 10.1016/S0076-6879(97)76066-X. [DOI] [PubMed] [Google Scholar]
- 29.Pflugrath JW. The finer things in X-ray diffraction data collection. Acta Crystallogr D Biol Crystallogr. 1999;55(Part 10):1718–1725. doi: 10.1107/s090744499900935x. [DOI] [PubMed] [Google Scholar]
- 30.Vagin A, Teplyakov A. MOLREP: an automated program for molecular replacement. J Applied Cryst. 1997;30:1022–1025. [Google Scholar]
- 31.Murshudov GN, Vagin AA, Lebedev A, Wilson KS, Dodson EJ. Efficient anisotropic refinement of macromolecular structures using FFT. Acta Crystallogr D. 1999;55(Part 1):247–255. doi: 10.1107/S090744499801405X. [DOI] [PubMed] [Google Scholar]
- 32.Emsley P, Cowtan K. Coot: model-building tools for molecular graphics. Acta Crystallogr D Biol Crystallogr. 2004;60(Part 12, Part 1):2126–2132. doi: 10.1107/S0907444904019158. [DOI] [PubMed] [Google Scholar]
- 33.DeLano WL. The PyMOL molecular graphics system. San Carlos, CA: DeLano Scientific; 2002. [Google Scholar]
- 34.Konarev PV, Volkov VV, Sokolova AV, Koch MHJ, Svergun DI. PRIMUS: a Windows PC-system for small angle scattering data analysis. J Appl Cryst. 2003;36:1277–1282. [Google Scholar]
- 35.Svergun DI. Determination of the regularization parameter in indirect-transform methods using perceptual criteria. J Appl Cryst. 1992;25:495–503. [Google Scholar]
- 36.Svergun DI, Petoukhov MV, Koch MH. Determination of domain structure of proteins from X-ray solution scattering. Biophys J. 2001;80:2946–2953. doi: 10.1016/S0006-3495(01)76260-1. [DOI] [PMC free article] [PubMed] [Google Scholar]
- 37.Volkov VV, Svergun DI. Uniqueness of ab initio shape determination in small-angle scattering. J Appl Cryst. 2003;36:860–864. doi: 10.1107/S0021889809000338. [DOI] [PMC free article] [PubMed] [Google Scholar]
- 38.Svergun D, Barberato C, Koch MHJ. CRYSOL—a program to evaluate X-ray solution scattering of biological macromolecules from atomic coordinates. J Appl Cryst. 1995;28:768–773. [Google Scholar]
- 39.Kleywegt GJ. Validation of protein models from Calpha coordinates alone. J Mol Biol. 1997;273:371–376. doi: 10.1006/jmbi.1997.1309. [DOI] [PubMed] [Google Scholar]
- 40.Naught LE, Tipton PA. Kinetic mechanism and pH dependence of the kinetic parameters of Pseudomonas aeruginosa phosphomannomutase/phosphoglucomutase. Arch Biochem Biophys. 2001;396:111–118. doi: 10.1006/abbi.2001.2618. [DOI] [PubMed] [Google Scholar]
- 41.Wu CH, Yeh LS, Huang H, Arminski L, Castro-Alvear J, Chen Y, Hu Z, Kourtesis P, Ledley RS, Suzek BE, Vinayaka CR, Zhang J, Barker WC. The protein information resource. Nucleic Acids Res. 2003;31:345–347. doi: 10.1093/nar/gkg040. [DOI] [PMC free article] [PubMed] [Google Scholar]
- 42.Edgar RC. MUSCLE. Multiple sequence alignment with high accuracy and high throughput. Nucleic Acids Res. 2004;32:1792–1797. doi: 10.1093/nar/gkh340. [DOI] [PMC free article] [PubMed] [Google Scholar]
- 43.Waterhouse AM, Procter JB, Martin DM, Clamp M, Barton GJ. Jalview Version 2—a multiple sequence alignment editor and analysis workbench. Bioinformatics. 2009;25:1189–1191. doi: 10.1093/bioinformatics/btp033. [DOI] [PMC free article] [PubMed] [Google Scholar]
- 44.Suhre K, Sanejouand YH. ElNemo: a normal mode web server for protein movement analysis and the generation of templates for molecular replacement. Nucleic Acids Res. 2004;32:W610–W614. doi: 10.1093/nar/gkh368. [DOI] [PMC free article] [PubMed] [Google Scholar]
- 45.Pettersen EF, Goddard TD, Huang CC, Couch GS, Greenblatt DM, Meng EC, Ferrin TE. UCSF Chimera—a visualization system for exploratory research and analysis. J Comput Chem. 2004;25:1605–1612. doi: 10.1002/jcc.20084. [DOI] [PubMed] [Google Scholar]
- 46.Sanner MF. Python: a programming language for software integration and development. J Mol Graph Model. 1999;17:57–61. [PubMed] [Google Scholar]
- 47.Sanner MF, Olson AJ, Spehner JC. Reduced surface: an efficient way to compute molecular surfaces. Biopolymers. 1996;38:305–320. doi: 10.1002/(SICI)1097-0282(199603)38:3%3C305::AID-BIP4%3E3.0.CO;2-Y. [DOI] [PubMed] [Google Scholar]
- 48.Murzin AG, Brenner SE, Hubbard T, Chothia C. SCOP: a structural classification of proteins database for the investigation of sequences and structures. J Mol Biol. 1995;247:536–540. doi: 10.1006/jmbi.1995.0159. [DOI] [PubMed] [Google Scholar]
- 49.Dundas J, Ouyang Z, Tseng J, Binkowski A, Turpaz Y, Liang J. CASTp: computed atlas of surface topography of proteins with structural and topographical mapping of functionally annotated residues. Nucleic Acids Res. 2006;34:W116–W118. doi: 10.1093/nar/gkl282. [DOI] [PMC free article] [PubMed] [Google Scholar]
- 50.Hardy GG, Caimano MJ, Yother J. Capsule biosynthesis and basic metabolism in Streptococcus pneumoniae are linked through the cellular phosphoglucomutase. J Bacteriol. 2000;182:1854–1863. doi: 10.1128/jb.182.7.1854-1863.2000. [DOI] [PMC free article] [PubMed] [Google Scholar]
- 51.Hardy GG, Magee AD, Ventura CL, Caimano MJ, Yother J. Essential role for cellular phosphoglucomutase in virulence of type 3 Streptococcus pneumoniae. Infect Immun. 2001;69:2309–2317. doi: 10.1128/IAI.69.4.2309-2317.2001. [DOI] [PMC free article] [PubMed] [Google Scholar]
- 52.Grass S, Buscher AZ, Swords WE, Apicella MA, Barenkamp SJ, Ozchlewski N, St Geme JW., III The Haemophilus influenzae HMW1 adhesin is glycosylated in a process that requires HMW1C and phosphoglucomutase, an enzyme involved in lipooligosaccharide biosynthesis. Mol Microbiol. 2003;48:737–751. doi: 10.1046/j.1365-2958.2003.03450.x. [DOI] [PubMed] [Google Scholar]
- 53.Naught LE, Regni C, Beamer LJ, Tipton PA. Roles of active site residues in P. aeruginosa phosphomannomutase/phosphoglucomutase. Biochemistry. 2003;42:9946–9951. doi: 10.1021/bi034673g. [DOI] [PubMed] [Google Scholar]
- 54.Naught LE, Tipton PA. Formation and reorientation of glucose 1,6-bisphosphate in the PMM/PGM reaction: transient-state kinetic studies. Biochemistry. 2005;44:6831–6836. doi: 10.1021/bi0501380. [DOI] [PubMed] [Google Scholar]
- 55.Regni C, Naught LE, Tipton PA, Beamer LJ. Structural basis of diverse substrate recognition by the enzyme PMM/PGM from P. aeruginosa. Structure. 2004;12:55–63. doi: 10.1016/j.str.2003.11.015. [DOI] [PubMed] [Google Scholar]
- 56.Regni C, Schramm AM, Beamer LJ. The Reaction of phosphohexomutase from Pseudomonas aeruginosa: structural insights into a simple processive enzyme. J Biol Chem. 2006;281:15564–15571. doi: 10.1074/jbc.M600590200. [DOI] [PubMed] [Google Scholar]
- 57.Regni C, Shackelford GS, Beamer LJ. Complexes of the enzyme phosphomannomutase/phosphoglucomutase with a slow substrate and an inhibitor. Acta Crystallogr Sect F Struct Biol Cryst Commun. 2006;62(Part 8):722–726. doi: 10.1107/S1744309106025887. [DOI] [PMC free article] [PubMed] [Google Scholar]
- 58.Regni C, Tipton PA, Beamer LJ. Crystal structure of PMM/PGM: an enzyme in the biosynthetic pathway of P. aeruginosa virulence factors. Structure. 2002;10:269–279. doi: 10.1016/s0969-2126(02)00705-0. [DOI] [PubMed] [Google Scholar]
- 59.Regni CA, Tipton PA, Beamer LJ. Crystallization and initial crystallographic analysis of phosphomannomutase/phosphoglucomutase from Pseudomonas aeruginosa. Acta Crystallogr D. 2000;56(Part 6):761–762. doi: 10.1107/s0907444900004431. [DOI] [PubMed] [Google Scholar]
- 60.Schramm AM, Mehra-Chaudhary R, Furdui CM, Beamer LJ. Backbone flexibility, conformational change, and catalysis in a phosphohexomutase from Pseudomonas aeruginosa. Biochemistry. 2008;47:9154–9162. doi: 10.1021/bi8005219. [DOI] [PubMed] [Google Scholar]
- 61.Chuang GY, Mehra-Chaudhary R, Ngan CH, Zerbe BS, Kozakov D, Vajda S, Beamer LJ. Domain motion and inter-domain hot spots in a multi-domain enzyme. Protein Sci. 2010;9:1662–1672. doi: 10.1002/pro.446. [DOI] [PMC free article] [PubMed] [Google Scholar]
- 62.Schramm AM, Karr D, Mehra-Chaudhary R, Van Doren SR, Furdui CM, Beamer LJ. Breaking the covalent connection: chain connectivity and the catalytic reaction of PMM/PGM. Protein Sci. 2010;19:1235–1242. doi: 10.1002/pro.402. [DOI] [PMC free article] [PubMed] [Google Scholar]
- 63.Kozin MB, Svergun DI. Automated matching of high- and low-resolution structural models. J Appl Cryst. 2001;34:33–41. [Google Scholar]
- 64.Collaborative Computational Project, Number 4. The CCP4 suite: programs for protein crystallography. Acta Crystallogr D Biol Crystallogr. 1994;50:760. doi: 10.1107/S0907444994003112. [DOI] [PubMed] [Google Scholar]
- 65.Krissinel E, Henrick K. Inference of macromolecular assemblies from crystalline state. J Mol Biol. 2007;372:774–797. doi: 10.1016/j.jmb.2007.05.022. [DOI] [PubMed] [Google Scholar]
- 66.Brandl M, Weiss MS, Jabs A, Suhnel J, Hilgenfeld R. C-H.pi-interactions in proteins. J Mol Biol. 2001;307:357–377. doi: 10.1006/jmbi.2000.4473. [DOI] [PubMed] [Google Scholar]
- 67.Hayward S, Berendsen HJ. Systematic analysis of domain motions in proteins from conformational change: new results on citrate synthase and T4 lysozyme. Proteins. 1998;30:144–154. [PubMed] [Google Scholar]
- 68.Ma J. Usefulness and limitations of normal mode analysis in modeling dynamics of biomolecular complexes. Structure. 2005;13:373–380. doi: 10.1016/j.str.2005.02.002. [DOI] [PubMed] [Google Scholar]
- 69.Pettit FK, Bare E, Tsai A, Bowie JU. HotPatch: a statistical approach to finding biologically relevant features on protein surfaces. J Mol Biol. 2007;369:863–879. doi: 10.1016/j.jmb.2007.03.036. [DOI] [PMC free article] [PubMed] [Google Scholar]
- 70.Larson ET, Deng W, Krumm BE, Napuli A, Mueller N, Van Voorhis WC, Buckner FS, Fan E, Lauricella A, DeTitta G, Luft J, Zucker F, Hol WG, Verlinde CL, Merritt EA. Structures of substrate- and inhibitor-bound adenosine deaminase from a human malaria parasite show a dramatic conformational change and shed light on drug selectivity. J Mol Biol. 2008;381:975–988. doi: 10.1016/j.jmb.2008.06.048. [DOI] [PMC free article] [PubMed] [Google Scholar]
- 71.Smyth LA, Collins I. Measuring and interpreting the selectivity of protein kinase inhibitors. J Chem Biol. 2009;2:131–151. doi: 10.1007/s12154-009-0023-9. [DOI] [PMC free article] [PubMed] [Google Scholar]
- 72.Scheer JM, Romanowski MJ, Wells JA. A common allosteric site and mechanism in caspases. Proc Natl Acad Sci USA. 2006;103:7595–7600. doi: 10.1073/pnas.0602571103. [DOI] [PMC free article] [PubMed] [Google Scholar]
- 73.Fernandez A. Incomplete protein packing as a selectivity filter in drug design. Structure. 2005;13:1829–1836. doi: 10.1016/j.str.2005.08.018. [DOI] [PMC free article] [PubMed] [Google Scholar]
- 74.Najjar VA. The isolation and properties of phosphoglucomutase. J Biol Chem. 1948;175:281–290. [PubMed] [Google Scholar]
Associated Data
This section collects any data citations, data availability statements, or supplementary materials included in this article.